AERATION CONDITION OF A CLAYEY OXISOL UNDER
LONG-TERM NO-TILLAGE
(1)Edner Betioli Junior(2), Cássio Antônio Tormena(3), Wagner Henrique Moreira(2), Bruce C. Ball(4), Getulio Coutinho Figueiredo(5), Álvaro Pires da Silva(6) & Neyde Fabíola Balarezo
Giarola(7)
SUMMARY
The hypothesis of this study was that the absence of soil tillage in long-term no-tillage (NT) systems can be detrimental to soil aeration. The objective was to assess the aeration condition of an Oxisol (Rhodic Ferrasol), very clayey texture (750 g kg-1 of clay; 200 g kg-1 of sand), after 30 years of cultivation under NT. The physical property soil air permeability (Ka) is sensitive to changes in the soil pore system. Aside from Ka, the air-filled porosity (Ɛa) and indices of pore continuity (K1 and N), derived from the relationship between Ka and Ɛa, were used as indices of soil aeration. From the soil layers 0.0-0.1 and 0.1-0.2 m, 240 undisturbed samples were collected along a transect perpendicular to the crop rows, at three sampling positions: corn plant row (CR); center of the interrow (INT); and the equidistant point between CR and INT (PE). The properties Ka and Ɛa were determined at soil matric potentials (ΨΨΨΨΨm) of -2, -4, -6, -10, -30, and -50 kPa. Soil bulk density (BD) was also determined. The results confirmed the hypothesis. In the 0.0-0.1 m layer, Ka, K1, N and Ɛa were significantly greater and BD significantly lower in CR than at the other sampling positions. At a ΨΨΨΨΨmof -10 kPa, the Ka of CR was 6.9 and 8.4 times higher than in PE and INT, respectively, in the 0.0-0.1 m layer. The properties Ka, K1 and N were sensitive enough to detect changes in the pore system and their
(1) Research funded by CNPq. Received for publication on July 23, 2013 and approved on February 27, 2014.
(2) Post-graduation Course in Agronomy, Universidade Estadual de Maringá - UEM. Av. Colombo, 5790. CEP 87020-900 Maringá
(PR), Brazil. E-mail: [email protected], [email protected]
(3) Associate Professor, Department of Agronomy, UEM. CNPq Fellowship. E-mail:[email protected]
(4) Professor, Scotland's Rural College, Crop and Soil Systems Research Group. West Mains Road, Edinburgh EH9 3JG, UK.
E-mail: [email protected]
(5) Agronomic Engineer, Doctor in Science, Escola Superior de Agricultura "Luiz de Queiroz" Universidade de São Paulo
-ESALQ/USP. Postal Box l9. Av. Pádua Dias, 11. CEP 13418-900 Piracicaba (SP), Brazil. E-mail: [email protected]
(6) Full Professor, Department of Soil Science and Plant Nutrition, ESALQ/USP. CNPq Fellowship. E-mail: [email protected] (7) Professor, Department of Soil Science and Agricultural Engineering, Universidade Estadual de Ponta Grossa. Av. Gal. Carlos
differences between the sampling positions demonstrated the importance of the spatial location for soil sampling. Tilling the crop rows provides better soil aeration under NT.
Index terms: soil compaction, air permeability, air-filled porosity, pore continuity, sampling spatial location.
RESUMO: CONDIÇÃO DE AERAÇÃO DE UM LATOSSOLO APÓS LONGO TEMPO SOB PLANTIO DIRETO
A hipótese deste estudo foi que a ausência de revolvimento do solo em sistema plantio direto (SPD) pode ser prejudicial à aeração do solo. O objetivo foi quantificar a condição de aeração de um Latossolo Vermelho distroférrico, classe textural muito argiloso (750 g kg-1 de argila; e 200 g kg-1 de areia), cultivado por 30 anos em SPD. A permeabilidade do solo ao ar (Ka) é um atributo físico do solo sensível às alterações no sistema poroso do solo. Ka, porosidade de aeração (Ɛa) e índices de continuidade de poros (K1 e N), obtidos de relações entre Ka e Ɛa, foram utilizados como indicadores da aeração do solo. Para o estudo, 240 amostras com estrutura preservada foram coletadas das camadas de 0,0-0,1 e 0,1-0,2 m de profundidade do solo, ao longo de um transecto estabelecido perpendicularmente às linhas de cultivo, em três posições distintas: linha da cultura do milho (CR); centro da entrelinha (INT); e ponto equidistante entre CR e INT (PE). A Ka e a Ɛa foram determinadas nos potenciais mátricos (Ψm) de -2, -4, -6, -10, -30 e -50 kPa. A densidade do solo também foi definida. Os resultados confirmaram a hipótese estabelecida. Valores de Ka, K1, N e Ɛa foram estatisticamente superiores na posição CR, na camada de 0,0-0,1 m. No Ψm de -10 kPa, a Ka da CR foi 6,9 e 8,4 vezes superior que em PE e INT, respectivamente, na camada de 0,0-0,1 m. Ka, K1 e N se apresentaram suficientemente sensíveis para detectar as alterações no sistema poroso, e suas diferenças entre as posições de amostragem comprovaram a importância da variabilidade espacial na obtenção de amostras de solo. A mobilização do solo na linha de semeadura propicia melhores condições de aeração do solo sob SPD.
Termos de indexação: compactação do solo, permeabilidade do solo ao ar, porosidade de aeração, continuidade de poros, posição espacial de amostragem.
INTRODUCTION
No-tillage (NT) is a soil management system in which the seeds of crops are deposited without prior plowing of the soil, where the soil is only disrupted when opening furrows for sowing. This amount of tillage is considered low and can maintain 30 to 100 % of the soil surface covered with plant residues (Soane et al., 2012). Despite economic and agronomic advantages in terms of reduced fuel consumption (Fernandes et al., 2008) and improved soil erosion control (Cogo et al., 2003), the reduced soil disturbance under NT along with the increased weight of modern agricultural machinery, have caused enough compaction of the soil surface layers to create an obstacle to the expansion of this cultivation system (Siqueira, 2008). In 2012, NT covered an area of 32 million ha in Brazil, a significant proportion of the approximately 117 million ha in the world (FEBRAPDP, 2012).
The main soil disruption under NT occurs along the sowing rows, due to the action of the shredder cutting discs and, mainly, the furrow opener (also known as knife or tine) whose function is to cut and penetrate the soil for fertilizer placement. According
to Siqueira (2008), the use of furrow openers for NT sowing has expanded in Brazil, as a means of breaking up surface compaction, especially in clayey and very clayey soils.
Compaction of soil can reduce soil aeration, sometimes to levels that limit the crop development (Czyz, 2004). An adequate oxygen supply to the soil is important for supporting populations of aerobic microorganisms, for enzymatic activity, and for the oxidation and reduction reactions of elements such as Fe2+ and Mn2+, which can be toxic to plants (Lal &
Shulka, 2004). Compaction alters various properties of the pore system, such as size distribution (Tarawally et al., 2004), continuity (Berisso et al., 2013) and geometry of the pores (Alaoui et al., 2011), modifying the dynamics of water and gases in soil.
The soil air permeability (Ka) is a physical property
Ressureccion et al., 2007) and is therefore sensitive to modifications in the distribution of soil macropores, which are responsible for the process of water drainage and soil gas flux. Alterations in Ka indicate changes
in quality of the soil physical environment for growing plants and changes in the rate of processes linked to gas concentrations in the soil (Silva et al., 2009). Soils with values of Ka 1 µm2 can be considered
impermeable, according to McQueen & Shepherd (2002).
Ball (1981), Ball et al. (1988) and McCarthy & Brown (1992) describe a direct relationship between Ka and air-filled porosity (Ɛa). Ball et al. (1988), Blackwell et al. (1990), Dörner & Horn (2006) and Groenevelt et al. (1984) used the relationships between Ka and Ɛa to estimate indexes of pore continuity that
characterize functional changes in the soil pore system. In Brazil, Silva et al. (2009) observed a reduction in Ka with increasing BD, approaching a value of 1 µm2
with BD of approximately 1.2 kg dm-3, in soil texture
classified as very clayey. On the other hand, Rodrigues et al. (2011) found values of approximately 5 µm2 in
very clayey soil with high organic matter contents and under NT management for 23 years.
Some studies demonstrate that soils under NT display values of Ka below those shown by conventional tillage (Ball & Robertson, 1994; Rodrigues et al., 2011). However, these studies of near surface soils ignore spatial locations when obtaining samples in the field. Since sowing is an operation that promotes localized loosening that determines differences in soil physical condition, in and between the crop rows, we highlight the importance of distinguishing sampling location when studying the soil air permeability. The hypothesis of this study is that the absence of soil tillage in long-term NT systems can be detrimental to soil aeration. The objective of this study was to determine BD, Ka and Ɛa as well as the relationships between Ka and Ɛa to obtain pore continuity indices to
estimate the structural quality and aeration status of an Oxisol (Rhodic Ferrasol) in a long-term (more than 30 years) NT system.
MATERIAL AND METHODS
The sampling was conducted in a commercial crop field near Maringá, State of Paraná, Brazil (23º 30' S, 51o 59' W; 454 m asl), with a smoothly undulating relief, an average slope of 3 %, and mean annual temperature and pluvial precipitation of 22 oC and 1,450 mm, respectively. In this region, the dominant climate type, according to the Köppen classification, is mesothermal humid subtropical. The soil at the study site was classified as Oxisol (Rhodic Ferrasol), with very clayey texture (750 g kg-1 clay and 200 g
kg-1 sand in the 0.0-0.2 m layer), with organic matter
contents of 19.77 g dm-3 in the 0.0-0.1 m and 14.52 g
dm-3 in the 0.1-0.2 m layer.
The sampling area (50 ha) was managed under NT as of 1980, in the following summer-winter crop sequence: corn-oat, soybean-corn, soybean-wheat. Throughout the last 30 years of cultivation, dolomitic limestone was periodically applied to the surface, based on results of soil chemical analysis. Fertilizers were applied during sowing, using a combined seeder-fertilizer drill equipped with cutting discs at the front and parabolic tines at the rear, at a cutting angle of 20o, a tip thickness of 20 mm and a penetration depth between 0.10 and 0.12 m. For oat and wheat sowing, another seeder-fertilizer was used, only equipped with cutting discs. During the corn and wheat crops, nitrogen fertilizer was applied, based on the recommendations for the respective crop. Pests, diseases and weeds were controlled as recommended specifically for each crop. In the sampled area, the track of tractors, harvesters and sprayers were set randomly to avoid excessively compacted regions in the field.
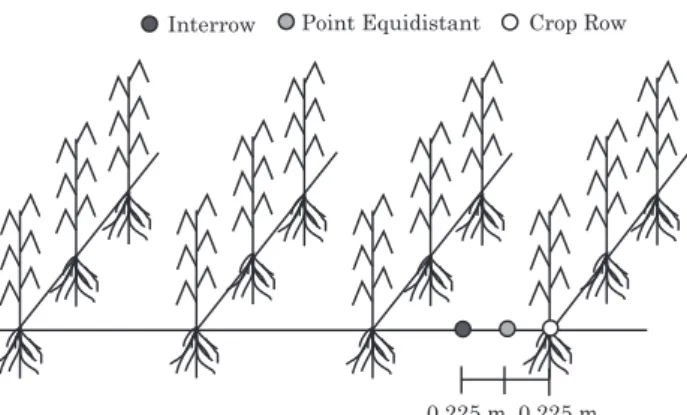
Soil sampling was carried out in September 2010, after harvesting the second corn crop grown at a spacing of 0.90 m. A transect of approximately 71 m was established perpendicular to the corn row. Forty undisturbed soil samples were taken from each of the following sampling positions: the crop row (CR); the center of the interrow (INT); and the point equidistant (PE) between the CR and the INT of the corn crop from layers 0.0-0.1 and 0.1-0.2 m depth (Figure 1). Per layer, 120 samples were taken. Undisturbed soil samples were collected in metal cylinders (7.5 diameter × 5.0 cm height), which were introduced slowly and continuously by an electro-mechanical automatic sampler (Figueiredo, 2010) to ensure the maintenance of the structural integrity of the soil sample.
In the laboratory, the soil samples were saturated for 48 h, through the gradual elevation of the water level, up to about 2/3 of the sample height. Samples were then weighed and subjected to the matric potentials (Ψm) of -2, -4, -6 and -10 kPa on a tension table similar to that described by Ball & Hunter (1988); the Ψm of -30 and -50 kPa, were established using pressure chambers (Klute, 1986). After attaining hydraulic equilibrium at each Ψm, each soil sample
Interrow Point Equidistant Crop Row
0.225 m 0.225 m
was reweighed and, immediately, the Ka was determined using a constant head permeameter (Figueiredo, 2010). The permeameter was similar to that proposed by Ball & Schjønning (2002), based on the application of successive increments of constant rates of air-flow into a soil sample, to generate different pressure gradients.
For each Ψm, Ka (µm2) was calculated using
equation 1:
÷÷ ø ö çç è æ =
p z A Qn Ka
s (1)
where Q is the mass flow (m3 s-1); η the viscosity of
air at 20 oC (N s m-2); As the area perpendicular to
the air movement (m2); z the height of the soil column
(m); and P is the differential air pressure (Pa). After calculating Ka at Ψm = -50 kPa, the samples were oven-dried at 105 oC for 24 h, to determine BD according to Grossman & Reinsch (2002).
The Ɛa was computed as the difference between total porosity (TP) and volumetric water content of the soil, after establishing the hydraulic equilibrium for each Ψm. The TP was obtained using equation 2:
Pd BD
TP=1- (2)
where Pd is the particle density (kg dm-3). The Pd
was estimated by the volumetric flask method (Embrapa, 1997) and the mean value of 2.86 Mg m-3
was used to calculate TP.
Pore continuity was evaluated using the relationship between Ka and Ɛa, using the
Kozeny-Carman equation in its analogous form, as described by Ahuja et al. (1984):
N a
a M
K = e (3)
where M and N are the empirical parameters obtained by fitting the equation to the data. N is considered an index of pore continuity that reflects the increase in Ka with the increasing of Ɛa or the decreasing of pore
tortuosity and surface area with an increase in the fraction of pores available for flow (Groenevelt et al., 1984). The relationship between Ka and Ɛa was fitted
to a logarithmic form for equation 3, which was conducted using equation 4:
log(Ka) = log (M) + N log (εa) (4) Considering equation 4, the intercept with the axis log Ɛa (in which Ka = 1 µm2) is referred to as the
limiting air content, and was proposed by Ball et al. (1988) and Schjønning et al. (2002) as the amount of soil pores blocked to aeration, that do not participate in the convective transport of air, and is represented by Ɛb. Therefore, Ɛb is the value of Ɛa below which air-flow through the soil ceases due to the discontinuity in the pore and aeration network and may be obtained by using equation 5:
εb = 10(-log M)/N (5)
Another index of pore continuity, K1, was calculated for the relationship Ka/Ɛa, according to
Groenevelt et al. (1984).
The BD and Ɛa were compared between treatments through the confidence interval (85 %) of the mean, in accordance with Payton et al. (2000). The normality of the distributions of the values for Ɛa, Ka and K1 were evaluated by the Shapiro-Wilk test. When normal distribution was absent, a logarithmic transformation was applied to the data to adjust the distributions to normality (Blackwell et al., 1990). The correlations between log Ka and BD, and log Ɛa were
assessed by the Pearson correlation test. The coefficients M and N and the means of K1 were tested using a t test (p<0.05). All these procedures were conducted using SAS (SAS, 2002) statistical software.
RESULTS AND DISCUSSION
In the 0.0-0.1 m layer, BD was lowest in the CR (Table 1). At all sampling locations, BDs were greater in the 0.1-0.2 m than the 0.0-0.1 m layer. For BD, coefficient of variation (CV) values were lower in the 0.1-0.2 m layer than in the 0.0-0.1 m layer, indicating more homogeneous soil physical condition in the 0.1-0.2 m layer. Heterogeneity in the 0.0-0.1 m layer was probably due to the increased action of the drill cutter, the root activity of the maize crop and wetting and drying cycles. The lower BD values recorded in CR in the 0.1-0.2 m layer can be the result of small variations in deeper layers caused by the drill cutter, in addition to the effect of the root system of the plants.
In a study in the same experimental area, Betioli Jr et al. (2012) determined the least limiting water range (LLWR) using the same sampling system (CR, PE and INT positions), and found a critical BD (Bdc) of 1.32 kg dm-3. The Bdc corresponds to the BD value
at and above which the LLWR is zero and the penetration resistance and aeration conditions are extremely limiting to plant growth. At the sampling positions PE and INT, the average BD values were greater than Bdc (Table 1). This suggests that long-term NT systems promote the confinement of the plant in a volume where soil physical quality is better, however small in spatial extent. This is restricted to a depth of approximately 0.1 m and horizontally probably to a few centimeters (around 0.12 m).
Layer Sampling location Mean CI Maximum Minimum CV
m Mg m-3 %
0.0-0.1 CR 1.098 Bb ±0.011 1.274 0.919 6.883
PE 1.351 Ab ±0.010 1.502 1.106 7.799
INT 1.347 Ab ±0.013 1.511 1.142 6.401
0.1-0.2 CR 1.349 Ca ±0.005 1.464 1.250 3.364
PE 1.376 Aa ±0.006 1.483 1.296 2.986
INT 1.369 Ba ±0.005 1.438 1.274 2.591
Table 1. Bulk density in the layers 0.0-0.1 and 0.1-0.2 m at the sampling locations crop row (CR), interrow (INT), and the point equidistant between CR and INT (PE)
Mean, confidence interval (CI), maximum and minimum have the same unit as the corresponding soil property. Means followed by the same letter, uppercase for comparison in the same layer and lowercase for comparison of the same position between layers, do not differ significantly by the mean confidence interval (p>0.05).
0.00 0.05 0.10 0.15 0.20 0.25 0.30
0.0-0.1 m
0.00 0.05 0.10 0.15 0.20 0.25 0.30
-2 -4 -6 -10 -30 -50
CR INT PE 0.1-0.2 m
Ɛa,
m
m
3
-3
Ym, kPa
Figure 2. Mean values of air-filled porosity (Ɛa) at the sampling locations crop row (CR), interrow (INT) and the point equidistant between CR and INT (PE) in two soil layers (0.0-0.1 and 0.1-0.2 m). Overlapping confidence intervals of the mean indicate no statistical difference (p>0.05).
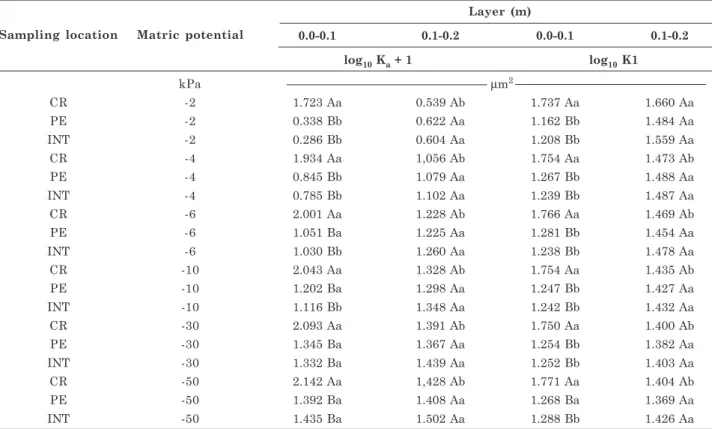
The values of Ka for each Ψm are presented in
table 2. The statistical distribution of the Ka values
was non-normal so a log+1 transformation was applied to adjust the data distribution closer to normality and allow parametrical statistical tests (Blackwell et al., 1990).
The mean values of log Ka for location CR were
higher than those of PE and in INT in the layer of 0.0-0.1 m at all Ψm evaluated (Table 2). In the
0.1-0.2 m layer no differences were found between sampling locations, demonstrating that the mechanisms that caused the lower BD in CR apparently had no influence on Ka. These results
indicate that the effects of soil cultivation on soil aeration at location CR were restricted to the 0.0-0.1 m layer.
The values of log Ka in CR in the 0.0-0.1 m layer
were greater than in the layer below, at all Ψm evaluated. At sampling position INT, the values for log Ka in the 0.1-0.2 m layer were greater than those
obtained within the 0.0-0.1 m layer at -2, -4, -6 and -10 kPa, despite the higher BD observed in 0.1-0.2 m layer (Table 1). The increase in BD within the 0.1-0.2 m layer and the increasing log Ka value at position INT at Ψm of -2, -4, -6, and -10 kPa, showed that other soil factors aside from porosity determine this property, such as the presence of a stable and continuous pore network. A similar behaviour can be observed in the PE position, which showed greater log Ka values in the 0.1-0.2 m layer at Ψm of -2, -4
kPa. Conversely to the surface, the 0.1-0.2 m layer is less affected by disruption from machinery traffic, which results in less blockage in the pore network (Figure 3). The behaviour of the CR position reflects the effect of soil loosening on the reduction of the blockage by the creation of larger and more interconnected pores. Ressureccion et al. (2007) recommended the measurement of Ka at matric potential equivalent to
field capacity (-10 kPa), once Ka is mainly governed by soil structure, specially by the larger soil pores, corresponding to the pores drained at -10 kPa. The mean values of Ka (without log transformation) obtained at -10 kPa were 11.04, 1.59 and 1.31 µm2 for
the sampling locations CR, PE and INT respectively, in the 0.0-0.1 m layer. For the 0.1-0.2 m layer, the Ka values were 2.13, 1.99 and 2.23 µm2 respectively, at
the sampling locations CR, PE and INT. As also observed for BD, the Ka values in CR were greatest in
the 0.0-0.1 m layer. These Ka values are lower than
between the soil in those studies and in the present paper.
K1 distribution was also non-normal and was log-transformed. In general, a comparison between sampling locations demonstrated that greater pore continuity was associated with higher values of log Ka (Table 2). However, in the comparison between the same sampling locations, in different layers, some cases have higher log K1 in the 0.1-0.2 m layer, even without significant differences in log Ka. This can be
seen at sampling location INT, at -2, -30 and -50 kPa, and PE, at -2, -4, -6, -10 and -30 kPa. In these cases, according to Groenevelt et al. (1984), aspects of the pore system, such as size distribution, tortuosity, and pore continuity are determinants for these differences. The behaviour was also opposite in CR at Ψm -2 kPa, where log K1 did not differ between the layers, despite the increase in log Ka observed in the 0.0-0.1 m layer.
This situation can be explained by the proportional reduction of Ka and Ɛa from the first to the second soil
layer; since K1 is the result of the ratio Ka/Ɛa, differences would be found if the numerator value had remained stable in the two soil layers while the denominator varied, or vice-versa. However, the greater log Ka values in the 0.0-0.1 m layer cannot be attributed solely to greater soil pore continuity (Table 2), but also to greater Ɛa (Figure 2).
The pore continuity index N demonstrated higher pore continuity at sampling location CR than INT, in the 0.0-0.1 m layer. As also found for Ka and K1, no
significant treatment differences in N were found in the 0.1-0.2 m layer (Figure 3). With the exception of position CR, where both K1 and N were higher in the 0.0-0.1 m layer in relation to CR in the 0.1-0.2 m layer, some divergences between K1 and N were found. At the same sampling location, log K1 was greater in the 0.1-0.2 m layer for INT and PE at most Ψm, yet no significant difference (p>0.05) was observed for N. For PE, N was also lower in the 0.1-0.2 m than the 0.0-0.1 m layer. Continuity indices based on single measurements and on overall relationships do not necessarily agree (Ball et al., 1988). Rodrigues et al. (2011) also found different trends for pore continuity as determined by the logarithmic relationship between Ka and Ɛa (N) and the ratio Ka/Ɛa (K1). In that study, N indicated pores supposedly more continuous in the 0.0-0.1 m layer, whereas log K1 showed greater pore continuity in the 0.1-0.2 m layer. In this study, the values of N are below those reported in other studies under NT, where N varied from 1.83 to 9.97 (Ball et al., 1988; Roseberg & McCoy, 1992; Rodrigues et al., 2011).
According to Ball et al. (1988), Ɛb can be considered as the percentage of Ɛa of the sample that is Sampling location Matric potential
Layer (m)
0.0-0.1 0.1-0.2 0.0-0.1 0.1-0.2 log10 Ka + 1 log10 K1
kPa µm2
CR -2 1.723 Aa 0.539 Ab 1.737 Aa 1.660 Aa
PE -2 0.338 Bb 0.622 Aa 1.162 Bb 1.484 Aa
INT -2 0.286 Bb 0.604 Aa 1.208 Bb 1.559 Aa
CR -4 1.934 Aa 1,056 Ab 1.754 Aa 1.473 Ab
PE -4 0.845 Bb 1.079 Aa 1.267 Bb 1.488 Aa
INT -4 0.785 Bb 1.102 Aa 1.239 Bb 1.487 Aa
CR -6 2.001 Aa 1.228 Ab 1.766 Aa 1.469 Ab
PE -6 1.051 Ba 1.225 Aa 1.281 Bb 1.454 Aa
INT -6 1.030 Bb 1.260 Aa 1.238 Bb 1.478 Aa
CR -10 2.043 Aa 1.328 Ab 1.754 Aa 1.435 Ab
PE -10 1.202 Ba 1.298 Aa 1.247 Bb 1.427 Aa
INT -10 1.116 Bb 1.348 Aa 1.242 Bb 1.432 Aa
CR -30 2.093 Aa 1.391 Ab 1.750 Aa 1.400 Ab
PE -30 1.345 Ba 1.367 Aa 1.254 Bb 1.382 Aa
INT -30 1.332 Ba 1.439 Aa 1.252 Bb 1.403 Aa
CR -50 2.142 Aa 1,428 Ab 1.771 Aa 1.404 Ab
PE -50 1.392 Ba 1.408 Aa 1.268 Ba 1.369 Aa
INT -50 1.435 Ba 1.502 Aa 1.288 Bb 1.426 Aa
Table 2. Soil air permeability (Ka) and index of pore continuity (K1) at the sampling locations crop row (CR), interrow (INT) and the point equidistant between these CR and INT (PE), in two soil layers (0.0-0.1 and 0.1-0.2 m) at six matric potentials
impermeable to gas flow. It was observed that in the 0.0-0.1 m layer, there was a greater volume of blocked pores at the sampling locations INT and PE, while in the 0.1-0.2 m layer the parameter was similar at the three sampling locations (Figure 3). The Ɛb values found in this study were similar to those obtained by Ball et al. (1988) in soil under NT in the UK. However, the observed behavior of Ɛb in relation to pore
continuity, evaluated by index N, differed from that reported by Ball et al. (1988), who found higher values for Ɛb, directly linked to those of N.
The degree of association between log Ka and the
soil physical properties (BD and log Ɛa) were evaluated by the Pearson correlation coefficient (Table 3). It was observed that BD was significantly negatively correlated with log Ka in the 0.0-0.1 m layer but there
was no significant correlation in 0.1-0.2 m layer. The correlation of log Ka with log Ɛa was highly significant
between the two layers of sampling, with slightly higher correlation values in the surface soil layer.
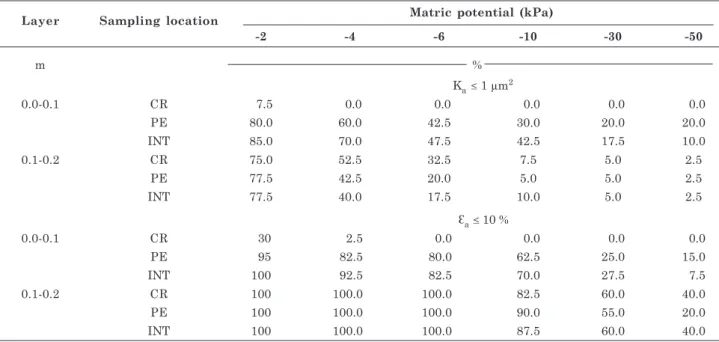
Considering a critical value of Ka 1 µm2
(McQueen & Shepherd, 2002) as the condition under which soil aeration is low enough to affect plant growth in the 0.0-0.1 m layer, with the exception of sampling location CR, the Ka of most samples was below the
1.00 1.20 1.40 1.60 1.80 2.00
0.0-0.1 m 0.1-0.2 m
1.00 3.00 5.00 7.00 9.00
CR PE INT
0.0-0.1 m 0.1-0.2 m
N
Ɛ
b, %
Figure 3. Mean values of the regression parameter (N) between log Ka and log Ɛa and blocked pores (Ɛb) at the sampling locations crop row (CR), interrow (INT) and the point equidistant between CR and INT (PE) in the layers 0.0-0.1 and 0.1-0.2 m. Overlapping confidence intervals of the mean indicate no statistical difference (p>0.05).
Layer Sampling location BD(1) log Ɛa(2)
m
0.0-0.1 CR -0.51* 0.72*
PE -0.66* 0.85*
INT -0.58* 0.85*
0.1-0.2 CR -0.13 ns 0.61*
PE -0.12 ns 0.65*
INT -0.04 ns 0.66*
Table 3. Pearson correlation coefficients between log Ka and some soil physical properties at sampling locations crop row (CR), interrow (INT) and the point equidistant between CR and INT (PE), in the 0.0-0.1 and 0.1-0.2 m layer
* (p<0.05), ns (p>0.05). (1) BD, soil bulk density. (2) log Ɛ
a, logarithm
of air-filled porosity.
critical value up to Ψm of -10 kPa. In the 0.1-0.2 m layer, a large increase was observed in the percentage of samples from CR which had Ka 1 µm2 up to Ψm
of -10 kPa, besides the standardization of the percentages of samples with Ka below 1 µm2 at the
different sampling positions. These results demonstrate the importance of a spatial differentiattion between the sampling locations when studying Ka.
The reduction in the percentage of samples with Ka 1 µm2, as a result of the reduction in Ψm (Table
4) reflects the increase in Ka values obtained as the
soil dries and demonstrates the important effect of soil water content or air-filled porosity on Ka (Ball et
al., 1988).
The comparison (ratio) between the percentage of samples with Ka 1 µm2 and the percentage of
samples with critical values of Ɛa (Ɛa 10 %) (Table 4) shows differences of up to 18 times, as observed in the PE position in the 0.1-0.2 m layer, at Ψm of -10 kPa. These results support the claim of Silva et al. (2009) that Ɛa may not reflect in precise measurements of the behavior of gases in the soil for measuring the volume and not taking pore continuity into consideration, which is more important for the soil air flow. Aeration is a dynamic process and is dependent on other factors, e.g., the saturation degree (Juca & Maciel, 2006), wetting/drying process (Kamiya et al., 2006) and the presence of biopores and vertical cracks (Tang et al., 2011). For the positions PE and INT, fewer samples with Ka 1 µm2 were in the 0.1-0.2 m
layer in relation to the 0.0-0.1 m layer even though BD was greater in the 0.1-0.2 m layer. This result is probably related to Ɛb, which showed a similar behavior, with lower values at the positions PE and INT in the 0.1-0.2 m than the 0.0-0.1 m layer. These results suggest that a higher percentage of pores available to the air flux could have contributed to the lower percentage of samples with Ka 1 µm2.
terms of BD and Ka are best in the CR position, as
this is the point of action of the cutting discs and furrow opener for seed and fertilizer deposition, which also break the compacted layer. Nevertheless, it is observed that in the space between two crop rows, represented here by the positions PE and INT, the Ka
conditions are very restrictive, suggesting that the NT system can provide a zone with satisfactory soil physical conditions, but a rather small soil volume that can be explored by the crop root system. Considering a tillage surface area of approximately 0.12 m, action of the tines to a depth of approximately 0.1 m, and considering the spacing between corn rows of 0.9 m, the volume of tilled soil at sowing in which the physical conditions are theoretically nonrestrictive to root growth was calculated as 66.66 m3 ha-1.
CONCLUSIONS
1. Values of air permeability (Ka), air-filled porosity and indices of pore continuity were significantly greater and bulk density significantly lower in the crop rows than at the other sampling positions in the 0.0-0.1 m layer.
2. At a matric potential of -10 kPa, the air permeability in the crop rows was 6.9 and 8.4 times higher than at the equidistant point between crop rows and interrows and in the center of the interrow, respectively, in the 0.0-0.1 m layer.
3. In the 0.1-0.2 m layer, the evaluated parameters, except for bulk density, did not differ
significantly between sampling positions and were in general more restrictive than in the 0.0-0.1 m layer. 4. The soil aeration parameters (Ka, K1 and N) were sensitive enough to detect changes in the pore system and their differences between the sampling positions demonstrated the relevance of the choice of the spatial location of soil sampling.
5. The absence of soil disturbance between crop rows under long-term no-tillage can restrict soil aeration.
LITERATURE CITED
AHUJA, L.R.; NANEY, J.W.; GREEN, R.E. & NIELSEN, D.R. Macroporosity to characterize spatial variability of hydraulic conductivity and effects of land management. Soil Sci. Soc. Am. J., 48:699-702, 1984.
ALAOUI, A.; LIPIEC, J. & GERKE, H.H. A review of the changes in the soil pore system due to soil deformation: A hydrodynamic perspective. Soil Till. Res., 115/116:1-15, 2011.
BALL, B.C. & HUNTER, R. The determination of water release characteristics of soil cores at low suctions. Geoderma, 43:195-212, 1988.
BALL, B.C. & ROBERTSON, E.A.G. Effects of uniaxial compaction on aeration and structure of plowed or direct drilled soils. Soil Till. Res., 31:135-148, 1994.
BALL, B.C. & SCHJØNNING, P. Air permeability. In: DANE, J.H. & TOPP, G.C., eds. Methods of soil analysis: Physical methods. Madison, American Society of Agronomy, 2002. Part 4. p.1141-1158. (SSSA Book Ser. 5)
Layer Sampling location Matric potential (kPa)
-2 -4 -6 -10 -30 -50
m %
Ka 1 µm2
0.0-0.1 CR 7.5 0.0 0.0 0.0 0.0 0.0
PE 80.0 60.0 42.5 30.0 20.0 20.0
INT 85.0 70.0 47.5 42.5 17.5 10.0
0.1-0.2 CR 75.0 52.5 32.5 7.5 5.0 2.5
PE 77.5 42.5 20.0 5.0 5.0 2.5
INT 77.5 40.0 17.5 10.0 5.0 2.5
Ɛ
a 10 %
0.0-0.1 CR 30 2.5 0.0 0.0 0.0 0.0
PE 95 82.5 80.0 62.5 25.0 15.0
INT 100 92.5 82.5 70.0 27.5 7.5
0.1-0.2 CR 100 100.0 100.0 82.5 60.0 40.0
PE 100 100.0 100.0 90.0 55.0 20.0
INT 100 100.0 100.0 87.5 60.0 40.0
BALL, B.C. Pore characteristics of soils from two cultivation experiments as shown by gas diffusivities and air permeabilities and air-filled porosities. J. Soil Sci., 32:483-498, 1981.
BALL, B.C.; O’SULLIVAN, M.F. & HUNTER, R. Gas diffusion, fluid flow and derived pore continuity indices in relation to vehicle traffic and tillage. J Soil Sci., 39:327-339, 1988. BERISSO, F.E.; SCHJØNNING, P.; KELLER, T.; LAMANDÉ, M.; SIMOJOKI, A.; IVERSEN, B.V.; ALAKUKKU, L. & FORKMAN, J. Gas transport and subsoil pore characteristics: Anisotropy and long-term effects of compaction. Geoderma, 195/196:184-191, 2013.
BETIOLI JR, E.; MOREIRA, W.H.; TORMENA, C.A.; FERREIRA, C.J.B.; SILVA, A.P. & GIAROLA, N.F.B. Intervalo hídrico ótimo e grau de compactação de um Latossolo Vermelho após 30 anos sob plantio direto. R. Bras. Ci. Solo, 36:971-982, 2012.
BLACKWELL, P.S.; RINGROSE-VOASE, A.J.; JAYAWARDANE, N.S.; OLSSON, K.A.; McKENZIE, D.C. & MASON, W.K. The use of air filled porosity and intrinsic permeability to characterize structure of macropore space and saturated hydraulic conductivity of clay soils. J Soil Sci., 41:215-228, 1990.
CAVALIERI, K.M.V.; SILVA, A.P.; TORMENA, C.A.; LEÃO, T.P.; DEXTER, A.R. & HAKANSSON, I. Long-term effects of no-tillage on dynamic soil physical properties in a Rhodic Ferrasol in Paraná, Brazil. Soil Till. Res., 103:158-164, 2009.
COGO, N.P.; LEVIEN, R. & SCHWARZ, R.A. Perdas de solo e água por erosão hídrica influenciadas por métodos de preparo, classes de declive e níveis de fertilidade do solo. R. Bras. Ci. Solo., 27:743-753, 2003.
CZYZÿ, E.A. Effects of traffic on soil aeration, bulk density and growth of spring barley. Soil Till. Res., 79:153-166, 2004.
DÖRNER, J. & HORN, R. Anisotropy of pore functions in structured Stagnic Luvisols in the Weichselien moraine region in N Germany. J. Plant Nutr. Soil Sci., 169:213-220, 2006.
EMPRESA BRASILEIRA DE PESQUISA AGROPECUÁRIA -EMBRAPA. Centro Nacional de Pesquisa de Solos. Manual de métodos de análises de solos. 2.ed. Rio de Janeiro, 1997. 212p.
FEDERAÇÃO BRASILEIRA DE PLANTIO DIRETO NA PALHA - FEBRAPDP. Available at: <http:// www.febrapdp.org.br>. Accessed: May 12, 2012. FERNANDES, H.C.; SILVEIRA, J.C.M. & RINALDI, P.C.N.
Avaliação do custo energético de diferentes operações agrícolas mecanizadas. Ci. Agrotec., 32:1582-1587, 2008. FIGUEIREDO, G.C. Avanços metodológicos e instrumentais em física do solo. Piracicaba, Escola Superior de Agricultura “Luiz de Queiroz”, 2010. 163p. (Tese de Doutorado)
GROENEVELT, P.H.; KAY, B.D. & GRANT, C.D. Physical assessment of soil with respect to rooting potential. Geoderma, 34:101-114, 1984.
GROSSMAN, R.B. & REINSCH, T.G. Bulk density and linear extensibility. In: DANE, J.H. & TOPP, C., eds. Methods of soil analysis: Physical methods. Madison, American Society of Agronomy, 2002. Part 4. p.201-228. (SSSA Book Ser. 5) JUCA, J.F.T. & MACIEL, F.J. Gas permeability of a compacted soil used in a landfill cover layer. In: INTERNATIONAL CONFERENCE ON UNSATURATED, 4., Reston, 2006. Reston, American Society of Civil Engineers, 2006. p.1535-1546. (Geotechnical Special Publication, 1, 147)
KAMIYA, K.; BAKRIE, R. & HONJO, Y. A new method for the measurement of air permeability coefficient of unsaturated soil. In: INTERNATIONAL CONFERENCE ON UNSATURATED, 4, Reston, 2006. Reston, American Society of Civil Engineers, 2006. p.1741-1752. (Geotechnical Special Publication, 2, 147)
KLUTE, A. Water retention: Laboratory methods. In: KLUTE, A., ed. Methods of soil analysis: Physical and mineralogical methods. Madison, America Society of Agronomy, 1986. Part 1. p.635-660.
LAL, R. & SHUKLA, M.K. Principles of soil physics. New York, Marcel Dekker, 2004. 716 p.
McCARTHY, K.P. & BROWN, K.W. Soil gas permeability as influenced by soil gas-filled porosity. Soil Sci. Soc. Am. J., 56:997-1003, 1992.
McQUEEN, D.J. & SHEPHERD, T.G. Physical changes and compaction sensitivity of a fien-textured, poorly drained soil (Typic Endoaquept) under varying durations of cropping, Manawatu Region, New Zealand. Soil Till. Res., 25:217-230, 2002.
PAYTON, M.E.; MILLER, A.E. & RAUN, W.R. Testing statistical hypotheses using standard error bars and confidence intervals. Commun. Soil Sci. Plant Anal., 31:547-551, 2000.
RESSURECCION, A.C.; KAWAMOTO, K.; KOMATSU, T.; MOLDRUP. P.; OZAKI, N. & ROLSTON, D.E. Gas transport parameters along field transects of a volcanic soils. Soil Sci., 172:3-16, 2007.
RODRIGUES, S.; SILVA, A.P.S.; GIAROLA, N.F.B. & ROSA, J.A. Permeabilidade ao ar em Latossolo Vermelho sob diferentes sistemas de manejo. R. Bras. Ci. Solo, 35:105-114, 2011.
ROSEBERG, R.J. & McCOY, E.L. Tillage and traffic-induced changes in macroporosity and macropore continuity: Air permeability assessment. Soil Sci. Soc. Am. J., 56:1261-1267, 1992.
SAS Institute. SAS: user’s guide: statistics. 9.ed. Cary, 2002. 943p.
SCHJØNNING, P.; MUNKHOLM, L.J.; MOLDRUP, P. & JACOBSEN, O.H. Modeling soil pore characteristics from measurements of air exchange: The long-term effects of fertilization and crop rotation. Eur. J. Soil Sci., 53:331-339, 2002.
SIQUEIRA, R. Milho: semeadoras-adubadoras para sistema plantio direto com qualidade. 2008. Available: <http:// www.leb.esalq.usp.br/disciplinas/Molin/leb432/Semeadoras/ semeadoraadubadora%20para%20sistema%20de%20plantio% 20direto%20com%20qualidade.pdf>. Accessed: May 20, 2011. SOANE, B.D.; BALL, B.C.; ARVIDSSON, J.; BASCH, G.; MORENO, F. & ROGER-ESTRADE, J. No-till in northern, western and south-western Europe: A review of problems and opportunities for crop production and the environment. Soil Till. Res., 118:66-87, 2012.
TANG, A.M.; CUI, Y.; RICHARD, G. & DÉFOSSEZ, P. A s t u d y o n t h e a i r p e r m e a b i l i t y a s a f f e c t e d b y compression of three French soils. Geoderma, 162:171-181, 2011.