Epistasis interaction of QTL effects as a genetic parameter influencing
estimation of the genetic additive effect
Jan Bocianowski
Department of Mathematical and Statistical Methods, Poznan University of Life Sciences, Poznan, Poland.
Abstract
Epistasis, an additive-by-additive interaction between quantitative trait loci, has been defined as a deviation from the sum of independent effects of individual genes. Epistasis between QTLs assayed in populations segregating for an entire genome has been found at a frequency close to that expected by chance alone. Recently, epistatic effects have been considered by many researchers as important for complex traits. In order to understand the genetic con-trol of complex traits, it is necessary to clarify additive-by-additive interactions among genes. Herein we compare es-timates of a parameter connected with the additive gene action calculated on the basis of two models: a model excluding epistasis and a model with additive-by-additive interaction effects. In this paper two data sets were ana-lysed: 1) 150 barley doubled haploid lines derived from the Steptoe´Morex cross, and 2) 145 DH lines of barley ob-tained from the Harrington´TR306 cross. The results showed that in cases when the effect of epistasis was different from zero, the coefficient of determination was larger for the model with epistasis than for the one excluding epistasis. These results indicate that epistatic interaction plays an important role in controlling the expression of complex traits.
Keywords: additive gene action effect, barley, doubled haploid lines, epistasis, QTL.
Received: July 16, 2012; Accepted: December 12, 2012.
Introduction
Epistasis (an additive-by-additive interaction be-tween quantitative trait loci or a nonallelic interaction of homozygous loci) was recognized as early as 100 years ago by Bateson (1909) to describe a situation where the action of one locus masks the allelic effects at another locus. How-ever, in classical statistical genetics, epistasis has been used as a statistical abstraction, so that less attention has been paid to the molecular and physiological nature of the gene interaction involved (Tachida and Cockerham, 1989).
Epistatic interactions of major genes, denoted asaa
(Kearsey and Pooni, 1998), have often been inferred from modified segregation ratios (Eshed and Zamir, 1996). For genes affecting quantitative traits epistasis has been de-fined as a deviation from the sum of independent effects of individual genes (Falconer, 1989). Epistasis between quan-titative trait loci (QTLs) assayed in populations segregating for an entire genome has been found at a frequency close to that expected by chance alone (Edwards et al., 1987; Doebley and Stec, 1991; Patersonet al., 1991; Stuberet al., 1992; De-Vicente and Tanksley, 1993; Linet al., 1995; Xiaoet al., 1995). Recently epistatic effects have been con-sidered by many researchers as important for complex traits
(Larket al., 1995; Eshed and Zamir, 1996; Cockerham and Zeng, 1996; Yuet al., 1997; Contiet al., 2011; Gowdaet al., 2011; Jianget al., 2011; Li et al., 2011; Maoet al., 2011; Upadhyaya et al., 2011; Bocianowski, 2012a,b,c). Hence, genetic models for QTL mapping assuming no epistasis could lead to a biased estimation of QTL parame-ters.
A common problem reported so far as associated with the analyses of data is that analyses of single-locus QTLs and epistatic interactions were conducted sepa-rately using different analytical tools (Xinget al., 2002; Bocianowski, 2008, 2012a,b,c; Krajewskiet al., 2012). Although both of the analytical tools can provide statisti-cal estimates for the amount of the effects and the propor-tions of variance explained, it is necessary for a joint estimation to evaluate the relative importance of individ-ual QTLs and epistatic interactions in determining the per-formance of these traits.
The aim of the current study was to compare esti-mates of a parameter connected with the additive gene action calculated on the basis of two models: a model ex-cluding epistasis and a model with additive-by-additive interaction effects. To this end, two data sets were ana-lysed: 1) 150 barley doubled haploid lines derived from the Steptoe´ Morex cross, and 2) 145 doubled haploid lines of barley obtained from the HarringtonTR ´ 306 cross.
www.sbg.org.br
Send correspondence to Jan Bocianowski. Department of Mathe-matical and Statistical Methods, Poznan University of Life Sci-ences, Wojska Polskiego 28, 60-637 Poznan, Poland. E-mail: [email protected].
Material and Methods
Estimation method
If in an experimentn biparental homozygous (dou-bled haploid, DH) plant lines were observed, ann-vector of phenotypic mean observationsy= [y1y2...yn]’ andq n
-vec-tors of marker genotype observationsml,l= 1, 2, ...,qwere obtained. Thei-th element (i= 1, 2, ..., n) of vectormlis equal to -1 or 1, depending on the parent’s genotype exhib-ited by thei-th line.
The estimation of an additive effect of a QTL (de-noted bya) is based on the assumption that genes responsi-ble for the trait are closely linked to the observed molecular marker. By choosingpfrom all the observed markers we can explain the variability of the trait, and model observa-tions for the lines as:
y=1m+Xb+e, (1)
or
y=1m+Xb+Zg+e, (2)
where1denotes then-dimensional vector of ones,mthe general mean,Xa (n´p)-dimensional matrix of the form
[
]
X = ml1 ml2 ... mlp ,l1,l2, ...,lpÎ{1, 2, ...,q} andb
the p-dimensional vector of unknown parameters of the formb¢ =
[
al1 al2 ... alp]
. Finally,Zdenotes a matrixwhose columns are products of certain columns of matrix
X, g is the vector of unknown parameters of the form
[
]
¢ =
-g aal l1 2 aal l1 3 ... aalp1lp , andethen-dimensional
vector of random variables, such thatE(ei) = 0,Var(ei) =s2,
andCov(ei,ej) = 0 fori¹j,i,j= 1, 2, ...,n. The parameters al1,al2,... ,alp are the additive effects of the genes
control-ling the trait and the parametersaal l1 2,aal l1 3,... ,aalp-1lp are
the additive´additive interaction effects. We assume that the epistatic interaction effects reveal only loci with cant additive gene action effects. This assumption signifi-cantly reduces the number of potential significant effects and improves the usefulness of the regression model.
The total additive effect of genes influencing the traits, defined as the sum of absolute values of individual additive effects, can be found in Bocianowski and Kra-jewski (2009) as:
$ $
a al k p k = =
å
1 (3)The total epistasis effect of gene pairs influencing the trait, defined as the sum of values of individual pairs ef-fects, is given in Bocianowski (2012b) as:
aa aal l k k k p k p k k ^ ^ ' ' ' = = ¹ =
-å
å
2 1 1 (4)Markers chosen for models (1) and (2) may, for ex-ample, be selected, by a stepwise regression procedure (Charcossetet al., 2001). Here we used a three-stage algo-rithm, in which selection was first made by a backward stepwise search conducted independently within all linkage groups and then markers selected in this way were placed in one group and subjected to the second backward selection (see Jansen and Stam, 1994). Finally, at the third stage, we considered situations in which selected markers were lo-cated on the chromosome very close to each other (closer than 5 cM). Because these markers are probably linked to one QTL, only the marker with the largest value of the sta-tistic test was retained in the set. At the first and second stages the Bonferroni correction was applied to control type I error for multiple tests (Province, 2001). For epistasis only markers showing significant association with traits were tested.
The coefficient of determination (R2) was used to measure how the model fits the data and, in this study, how the amount of the phenotypic variance is explained by the marker effects and marker interaction effects.
Examples
To compare the estimates ofaobtained by the two methods (excluding and including epistasis), the following data sets were used.
Example 1
The data concern 150 doubled haploid (DH) lines of barley obtained from the Steptoe´Morex cross, used in the North American Barley Genome Mapping (NABGM) pro-ject and tested in sixteen environments (Kleinhofset al., 1993; Romagosa et al., 1996; GrainGenes database, Steptoe´Morex cross). The linkage map used consisted of 223 molecular markers, mostly RFLP, with a mean dis-tance between markers of 5.66 cM. The lines were analysed for eight phenotypic traits (alpha amylase, AA; diastatic power, DP; grain protein, GP; grain yield, GY; height, H; heading date, HD; lodging, L; malt extract, ME; Hayeset al., 1993). Grain protein, lodging and malt extract were transformed by arcsin x/100. Missing marker data were estimated by the method of Martinez and Curnow (1994), using non-missing data of flanking markers.
Example 2
The data also come from the NABGM project (Tinker
planting until physiological maturity, NM; plant height, H; lodging transformed by arcsin x/100, L; 1000 kernel weight, KW; and test weight, TW). We used a map com-posed of 127 molecular markers (mostly RFLP) with the mean distance between markers of 10.62 cM. Results shown below concern observations from five environments (in four environments observations were made over two years).
The total additive effects of QTLs were estimated for model (1) - without epistasis and for model (2) - with
epistasis, for each environment independently for both data sets.
Results
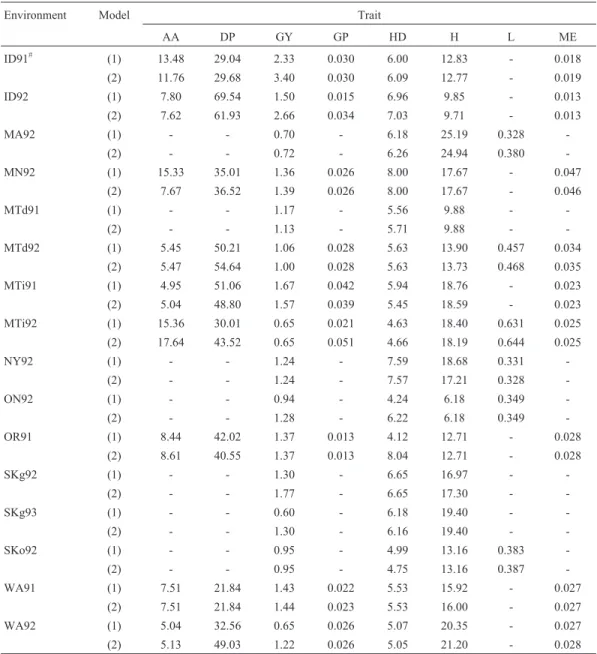
Table 1 presents estimates of the total additive effects for the 150 doubled haploid lines of barley obtained from the Steptoe´Morex cross calculated by an assumption of a lack of epistasis effect (model 1), as well as by an assump-tion of the effect of epistasis interacassump-tions of genes (model 2). The obtained results showed that in 27 cases (30%) no
Table 1- The total additive effect estimated on the basis of model (1) and model (2) for the 150 doubled haploid lines of barley obtained from the Steptoe
´Morex cross (all epistasis effects are statistically significant at the 0.05 level).
Environment Model Trait
AA DP GY GP HD H L ME
ID91# (1) 13.48 29.04 2.33 0.030 6.00 12.83 - 0.018
(2) 11.76 29.68 3.40 0.030 6.09 12.77 - 0.019
ID92 (1) 7.80 69.54 1.50 0.015 6.96 9.85 - 0.013
(2) 7.62 61.93 2.66 0.034 7.03 9.71 - 0.013
MA92 (1) - - 0.70 - 6.18 25.19 0.328
-(2) - - 0.72 - 6.26 24.94 0.380
-MN92 (1) 15.33 35.01 1.36 0.026 8.00 17.67 - 0.047
(2) 7.67 36.52 1.39 0.026 8.00 17.67 - 0.046
MTd91 (1) - - 1.17 - 5.56 9.88 -
-(2) - - 1.13 - 5.71 9.88 -
-MTd92 (1) 5.45 50.21 1.06 0.028 5.63 13.90 0.457 0.034
(2) 5.47 54.64 1.00 0.028 5.63 13.73 0.468 0.035
MTi91 (1) 4.95 51.06 1.67 0.042 5.94 18.76 - 0.023
(2) 5.04 48.80 1.57 0.039 5.45 18.59 - 0.023
MTi92 (1) 15.36 30.01 0.65 0.021 4.63 18.40 0.631 0.025
(2) 17.64 43.52 0.65 0.051 4.66 18.19 0.644 0.025
NY92 (1) - - 1.24 - 7.59 18.68 0.331
-(2) - - 1.24 - 7.57 17.21 0.328
-ON92 (1) - - 0.94 - 4.24 6.18 0.349
-(2) - - 1.28 - 6.22 6.18 0.349
-OR91 (1) 8.44 42.02 1.37 0.013 4.12 12.71 - 0.028
(2) 8.61 40.55 1.37 0.013 8.04 12.71 - 0.028
SKg92 (1) - - 1.30 - 6.65 16.97 -
-(2) - - 1.77 - 6.65 17.30 -
-SKg93 (1) - - 0.60 - 6.18 19.40 -
-(2) - - 1.30 - 6.16 19.40 -
-SKo92 (1) - - 0.95 - 4.99 13.16 0.383
-(2) - - 0.95 - 4.75 13.16 0.387
-WA91 (1) 7.51 21.84 1.43 0.022 5.53 15.92 - 0.027
(2) 7.51 21.84 1.44 0.023 5.53 16.00 - 0.027
WA92 (1) 5.04 32.56 0.65 0.026 5.07 20.35 - 0.027
(2) 5.13 49.03 1.22 0.026 5.05 21.20 - 0.028
#
statistically significant epistasis interaction effects were found. In 24 cases the values of additive effects were lower after epistasis had been incorporated in the model, com-pared to the case when this effect was excluded. The largest decrease of values of additive effects was observed for AA in MN92 - by 49.97% (Table 1). In 39 cases, allowance for the epistasis effect caused an increase in the value of addi-tive effects (Table 1). The largest increase ofaamounted to 142.86% (for GP in MTi92). The percentage phenotypic variance explained by QTL effects and their epistasis ef-fects was larger thanR2100 for model (1), except for one case, ME in MN92, where the decrease amounted to 0.3% (Table 2). The maximal increase of the observed pheno-typic variation was 16.6% (from 25.2% to 41.8% for GY in
WA92). In ten cases, an increase in R2 was observed, amounting to at least 10% (Table 2).
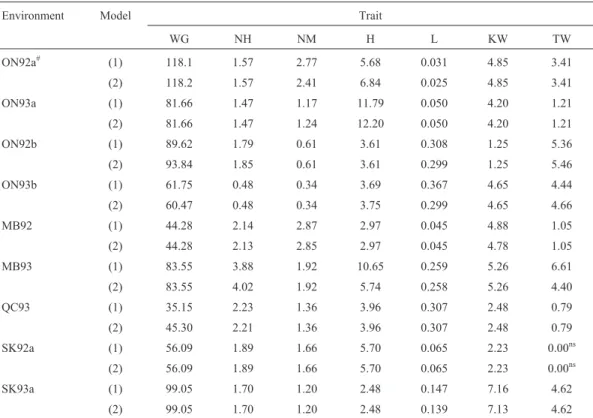
For the second dataset (146 doubled haploid lines of barley obtained from the HarringtonTR´306 cross), no epistasis effects were found in 38 cases (Table 3). With the incorporation of the effect of epistasis interaction in 14 cases, an increase of additive effect value and a reduction in the value ofawas denoted in 11 cases (Table 3). The largest reduction in the value of parameterawas 46.10% (for H in MB93), whereas the largest increase of an additive effect was 28.88% (for WG in QC93). In all the cases, when the effect of epistasis was different from zero, the coefficient of determination was larger for model (2) than for model (1).
Table 2- Percentage phenotypic variance (R2100 [in %]) explained by QTL effects (for model 1) and by QTL effects and their epistasis effects (for model 2) for 150 doubled haploid lines of barley obtained from the Steptoe´Morex cross.
Environment Model Trait
AA DP GY GP HD H L ME
ID91# (1) 40.9 50.9 40.5 36.5 74.5 56.8 - 33.6
(2) 51.7 55.6 55.3 36.5 75.5 58.1 - 35.4
ID92 (1) 36.6 67.4 50.1 36.5 76.2 32.4 - 26.2
(2) 39.3 73.4 60.4 46.6 76.5 34.2 - 26.2
MA92 (1) - - 37.0 - 75.2 80.9 62.8
-(2) - - 37.9 - 75.7 81.8 63.0
-MN92 (1) 40.5 34.4 28.3 11.1 78.1 61.5 - 17.8
(2) 47.7 43.5 29.6 11.1 78.1 61.5 - 17.5
MTd91 (1) - - 63.7 - 68.9 48.4 -
-(2) - - 66.4 - 71.1 48.4 -
-MTd92 (1) 37.5 57.1 33.8 54.9 73.9 53.3 41.9 42.5
(2) 39.8 67.9 39.0 54.9 73.9 55.4 43.1 44.9
MTi91 (1) 18.8 66.5 47.9 31.7 68.7 61.5 - 36.8
(2) 20.0 75.4 52.4 37.6 73.3 63.2 - 36.8
MTi92 (1) 52.5 51.8 26.5 38.2 76.6 61.3 41.2 40.3
(2) 59.9 67.1 26.5 48.2 77.2 63.5 42.3 40.3
NY92 (1) - - 30.4 - 80.0 48.2 53.2
-(2) - - 30.4 - 80.5 51.3 54.1
-ON92 (1) - - 24.7 - 12.9 35.9 23.7
-(2) - - 32.8 - 16.4 35.9 23.7
-OR91 (1) 52.7 42.7 13.1 22.4 47.5 26.5 - 40.0
(2) 54.7 48.3 13.1 22.4 55.9 26.5 - 40.0
SKg92 (1) - - 37.4 - 78.7 53.0 -
-(2) - - 48.0 - 78.7 56.7 -
-SKg93 (1) - - 38.4 - 83.4 75.1 -
-(2) - - 45.9 - 84.0 75.1 -
-SKo92 (1) - - 19.7 - 61.4 57.5 44.8
-(2) - - 19.7 - 63.6 57.5 46.6
-WA91 (1) 27.6 39.6 54.9 39.8 67.3 67.6 - 31.5
(2) 27.6 39.6 55.9 42.4 67.3 68.1 - 31.5
WA92 (1) 43.2 53.2 25.2 40.4 77.3 62.4 - 45.9
(2) 44.1 68.4 41.8 40.4 77.8 68.1 - 48.1
The largest increase in theR2value, amounting to 11.0%, was observed for L in ON93b (Table 4).
Discussion
The identification of QTLs and the elucidation of their genetic control (main effects and their epistatic ef-fects) are essential for the development of efficient mar-ker-assisted selection (MAS), aimed at improving breeding efficiency (Govindarajet al., 2009). A direct implication of epistasis, especially the involvement of QTLs in epistatic interactions, is that the effects of single-locus QTLs are mostly dependent on the genotypes of other loci, and the ef-fect of a QTL can sometimes be negated by the genotypes of a second locus. Thus any attempt to utilize QTLs in breeding programs has to take into account such epistatic effects. It is worthy of note that, although this study re-vealed a large number of epistases events through statistical genetic analysis, many further studies are needed before we can fully understand the biological meaning of these phe-nomena.
The most-important results of this study relate to the statistical characterization of the genetic components that control the expression of the traits, including additive-by-additive epistatic interactions. Ma et al.(2007) observed
that 37% of the main-effect QTLs were involved in the epistatic interactions in maize grain yield and its compo-nents. This indicated that many loci in epistatic effects might not have significant effects for studied trait alone but might affect its expression by epistatic effects with the other loci. The results obtained herein also suggest that some of the additive QTLs might be detected with effects confounded by epistatic effects, if the epistatic effects were ignored in QTL mapping.
Incorporation of epistasis interaction of QTLs pro-vided a more comprehensive characterization of the ana-lyzed DH lines. This is evidenced by the higherR2values for model (2) than for model (1),i.e. the one excluding epistasis (Tables 2 and 4). Thus it may be concluded that QTL epistasis is a significant component for the under-standing of the genetic control of determined phenotypic values, while failure to include epistasis may result in an in-complete or even erroneous characterization of the ana-lyzed. In the presence of epistasis, however, the control of only main-effect markers is insufficient, because the epistatic effects of QTLs will also show influences, particu-larly in the case of complex phenotypes (Liet al., 1997a,b). Thus, inclusion of interaction markers closely linked to epistatic QTLs in the statistical models is expected to im-Table 3- The total additive effect estimated on the basis of model (1) excluding epistasis and on the basis of model (2) including epistasis for 145 doubled haploid lines of barley obtained from the Harrington x TR306 cross (all epistasis effects, except for TW in SK92a, are statistically significant at the 0.05 level).
Environment Model Trait
WG NH NM H L KW TW
ON92a# (1) 118.1 1.57 2.77 5.68 0.031 4.85 3.41
(2) 118.2 1.57 2.41 6.84 0.025 4.85 3.41
ON93a (1) 81.66 1.47 1.17 11.79 0.050 4.20 1.21
(2) 81.66 1.47 1.24 12.20 0.050 4.20 1.21
ON92b (1) 89.62 1.79 0.61 3.61 0.308 1.25 5.36
(2) 93.84 1.85 0.61 3.61 0.299 1.25 5.46
ON93b (1) 61.75 0.48 0.34 3.69 0.367 4.65 4.44
(2) 60.47 0.48 0.34 3.75 0.299 4.65 4.66
MB92 (1) 44.28 2.14 2.87 2.97 0.045 4.88 1.05
(2) 44.28 2.13 2.85 2.97 0.045 4.78 1.05
MB93 (1) 83.55 3.88 1.92 10.65 0.259 5.26 6.61
(2) 83.55 4.02 1.92 5.74 0.258 5.26 4.40
QC93 (1) 35.15 2.23 1.36 3.96 0.307 2.48 0.79
(2) 45.30 2.21 1.36 3.96 0.307 2.48 0.79
SK92a (1) 56.09 1.89 1.66 5.70 0.065 2.23 0.00ns
(2) 56.09 1.89 1.66 5.70 0.065 2.23 0.00ns
SK93a (1) 99.05 1.70 1.20 2.48 0.147 7.16 4.62
(2) 99.05 1.70 1.20 2.48 0.139 7.13 4.62
ns - not statistically significant.
prove the power and accuracy of QTL mapping. The phe-nomenon of a biased estimation of additive effects in the absence of important interaction effects has already been addressed by Zenget al.(2005) in the analysis of simula-tion data. A significant proporsimula-tion of the identified additive effect QTLs were involved in digenic interactions with background loci. Thus, the usual estimates of additive ef-fects of a QTL can be confounded by interactions, which may change according to genetic backgrounds, environ-ments, and other factors. This means that QTLs and the epistatic loci are interchangeable, depending on the genetic backgrounds and probably environments where they are identified. This study showed that, besides the main (addi-tive) effect QTLs, epistatic QTLs also play a crucial role in determining phenotypic values. Even if the epistatic inter-actions of main effect QTLs limit their usefulness in MAS programmes (Tanet al., 2001), the pronounced individual additive effects of these QTLs are sufficient enough to re-cruit them for MAS (Govindarajet al., 2009). Because of the interaction between different loci, the offspring pheno-type will be largely influenced by the genetic background of the receptor line when marker-directed selection is car-ried out (Tanet al., 2001).
The results obtained herein reinforce the importance of epistasis investigations in marker trait association stud-ies, as the individual effect of a marker as locus depends on the marker genotype at other interacting loci. In fact, a
fa-vorable allele at one locus may be an unfafa-vorable one in a different genetic background, and vice versa (Holland, 2001). Thus, this has to be taken in consideration, espe-cially for sugarcane, due to the several possible interactions between the multiple alleles from different loci.
Furthermore, the results indicate that epistatic inter-action plays an important role in controlling the expression of complex traits. Yuet al.(1997) and Rahmanet al.(2007) also identified a number of epistatic QTLs influencing yield and yield components. Thus, the utilization of marker assisted selection in different plant breeding programs has to take epistatic effects into consideration.
References
Bateson W (1909) Mendel’s Principles of Heredity. Cambridge University Press, Cambridge, 396 pp.
Bocianowski J (2008) Comparison of two methods of estimation of nonallelic interaction of QTL effects on the basis of dou-bled haploid lines in barley. Agric Conspec Sci 73:183-187. Bocianowski J (2012a) A comparison of two methods to estimate
additive-by-additive interaction of QTL effects by a simula-tion study. J Theor Biol 308:20-24.
Bocianowski J (2012b) Analytical and numerical comparisons of two methods of estimation of additive´additive interaction of QTL effects. Sci Agric 69:240-246.
Bocianowski J (2012c) Using weighted multiple linear regression in estimation of QTL-by-QTL epistasis effects. Genet Mol Biol 35:802-809.
Table 4- Percentage phenotypic variance (R2100 [in %]) explained by QTL effects (for model 1) and by QTL effects and their epistasis effects (for model 2) for 145 doubled haploid lines of barley obtained from the Harrington´TR306 cross.
Environment Model Trait
WG NH NM H L KW TW
ON92a# (1) 41.6 43.9 41.2 18.3 7.0 34.8 34.8
(2) 47.7 43.9 47.2 18.5 9.2 34.8 34.8
ON93a (1) 36.6 39.8 25.3 31.0 4.1 42.2 14.6
(2) 36.6 39.8 28.6 34.3 4.1 42.2 14.6
ON92b (1) 28.0 42.7 14.0 20.4 28.3 16.2 43.5
(2) 29.9 46.7 14.0 20.4 29.7 16.2 44.6
ON93b (1) 50.5 23.5 11.6 26.8 34.2 32.8 34.3
(2) 54.8 23.5 11.6 27.9 45.2 32.8 36.8
MB92 (1) 21.6 43.2 45.4 20.8 9.6 29.1 20.0
(2) 21.6 44.3 48.4 20.8 9.6 30.5 20.0
MB93 (1) 39.1 48.6 33.4 46.1 23.7 55.8 51.1
(2) 39.1 50.9 33.4 48.1 25.9 55.8 54.8
QC93 (1) 32.7 42.4 25.5 21.0 22.0 39.0 16.2
(2) 32.7 45.4 27.5 21.0 22.0 39.0 16.2
SK92a (1) 10.8 27.6 16.8 15.8 4.7 17.1 0.0
(2) 10.8 27.6 16.8 15.8 4.7 17.1 0.0
SK93a (1) 27.4 30.4 22.7 18.6 17.6 68.1 54.2
(2) 27.4 30.4 22.7 18.6 20.2 70.5 54.2
#
Bocianowski J and Krajewski P (2009) Comparison of the genetic additive effect estimators based on phenotypic observations and on molecular marker data. Euphytica 165:113-122. Charcosset A, Mangin B, Moreau L, Combes L, Jourjon M-F and
Gallais A (2001) Heterosis in maize investigated using con-nected RIL populations. In: Gallais A, Dillmann C and Goldringer I (eds) Quantitative Genetics and Breeding Methods: The Way Ahead. Proceedings of the Eleventh Meeting of the EUCARPIA, Section Biometrics in Plant Breeding, Institut National de la Recherche Agronomique, Paris, France, Les Colloques 96, pp 89-98.
Cockerham CC and Zeng ZB (1996) Design with marker loci. Ge-netics 143:1437-1456.
Conti V, Roncallo PF, Beaufort V, Cervigni GL, Miranda R, Jensen CA and Echenique VC (2011) Mapping of main and epistatic effect QTLs associated to grain protein and gluten strength using a RIL population of durum wheat. J Appl Genet 52:287-298.
De-Vicente MC and Tanksley SD (1993) QTL analysis of trans-gressive segregation in an interspecific tomato cross. Genet-ics 134:585-596.
Doebley J and Stec A (1991) Genetic analysis of the morphologi-cal differences between maize and teosinte. Genetics 129:285-295.
Edwards MD, Stuber CW and Wendel JF (1987) Molecular-marker-facilitated investigations of quantitative-trait loci in maize. I. Numbers, genomic distribution and types of gene action. Genetics 116:113-125.
Eshed Y and Zamir D (1996) Less-than-additive epistatic interac-tions of quantitative trait loci in tomato. Genetics 143:1807-1817.
Falconer DS (1989) Introduction to Quantitative Genetics. John Wiley and Sons, New York, 340 pp.
Govindaraj P, Vinod KK, Arumugachamy S and Maheswaran M (2009) Analysing genetic control of cooked grain traits and gelatinization temperature in a double haploid population of rice by quantitative trait loci mapping. Euphytica 166:165-176.
Gowda SJM, Radzika P, Mhase LB, Jamadagni BM, Gupta VS and Kadro NY (2011) Mapping of QTLs governing agro-nomic and field traits in chickpea. J Appl Genet 52:9-21. Hayes PM, Liu BH, Knapp SJ, Chen F, Jones B, Blake T,
Franc-kowiak J, Rasmusson D, Sorrells M, Ullrich SE,et al.(1993) Quantitative trait locus effects and environmental interac-tion in a sample of North American barley germ plasm. Theor Appl Genet 87:392-401.
Holland J (2001) Epistasis and plant breeding. In: Janick J (ed) Plant Breeding Reviews. Vol. 21. John Wiley & Sons, Inc., New York, pp 27-112.
Jansen RC and Stam P (1994) High resolution of quantitative traits into multiple loci via interval mapping. Genetics 136:1447-1455.
Jiang Z, Zhang B, Teng W, Han Y, Zhao X, Sun D, Zhang Z and Li W (2011). Impact of epistasis and QTL´environmental interaction on the oil filling rate of soybean seed at different developmental stages. Euphytica 177:431-442.
Kearsey MJ and Pooni HS (1998) The Genetical Analysis of Quantitative Traits. Chapman and Hall, London, 381 pp. Kleinhofs A, Kilian A, Saghai Maroof MA, Biyashev RM, Hayes
P, Chen FQ, Lapitan N, Fenwick A, Blake TK, Kanazin V,et al.(1993) A molecular, isozyme and morphological map of
the barley (Hordeum vulgare) genome. Theor Appl Genet 86:705-712.
Krajewski P, Bocianowski J, Gawlowska M, Kaczmarek Z, Pniewski T, Swiecicki W and Wolko B (2012) QTL for field components and protein content: A multienvironmental stu-dy of two pea (Pisum sativumL.) populations. Euphytica 183:323-336.
Lark KG, Chase K, Adler FR, Mansur LM and Orf JJ (1995) Inter-actions between quantitative trait loci in soybean in which trait variation at one locus is conditional upon a specific al-lele at another. Proc Natl Acad Sci USA 92:4656-4660. Li ZK, Pinson SRM, Park WD, Paterson AH and Stansel JW
(1997a) Epistasis for three grain yield components in rice (Oryza sativaL.). Genetics 145:453-465.
Li ZK, Pinson SRM, Paterson AH, Park WD and Stansel JW (1997b) Genetics of hybrid sterility and hybrid breakdown in an inter-subspecific rice (Oryza sativaL.) population. Ge-netics 145:1139-1148.
Li Z-M, Ding J-Q, Wang R-X, Chen J-F, Sun X-D, Chen W, Song W-B, Dong H-F, Dai X-D, Xia Z-L,et al.(2011) A new QTL for resistance toFusariumear rot in maize. J Appl Ge-netics 52:403-406.
Lin Y, Schertz KF and Paterson AH (1995) Comparative analysis of QTLs affecting plant height and maturity across Poacceae, in reference to an interspecific sorghum popula-tion. Genetics 141:391-411.
Ma XQ, Tang JH, Teng WT, Yan JB, Meng YJ and Li JS (2007) Epistatic interaction is an important genetic basis of grain yield and its components in maize. Mol Breed 20:41-51. Mao D, Liu T, Xu C, Li X and Xing Y (2011). Epistasis and
com-plementary gene action adequately account for the genetic bases of transgressive segregation of kilo-grain weight in rice. Euphytica 180:261-271.
Martinez O and Curnow RN (1994) Missing markers when esti-mating quantitative trait loci using regression mapping. He-redity 73:198-206.
Paterson AH, Damon S, Hewitt JD, Zamir D, Rabinowitch HD, Lincoln SE, Lander ES and Tanksley SD (1991) Mendelian factors underlying quantitative traits in tomato: Comparison across species, generations and environments. Genetics 127:181-197.
Province MA (2001) 30 Sequential methods of analysis for ge-nome scan. Advance in Genetics 42:499-514.
Rahman ML, Chu SH, Choi MS, Qiao YL, Jiang W, Piao R, Khanam S, Cho YI, Jeung J, Jena KK,et al.(2007) Identifi-cation of QTLs for some agronomic traits in rice using an introgression line fromOryza minuta. Mol Cells 24:16-26. Romagosa I, Ullrich SE, Han F and Hayes PM (1996) Use of the
additive main effects and multiplicative interaction model in QTL mapping for adaptation in barley. Theor Appl Genet 93:30-37.
Stuber CW, Lincoln SE, Wolff DW, Helentjaris T and Lander ES (1992) Identification of genetic factors contributing to hete-rosis in a hybrid from two elite maize inbred lines using mo-lecular markers. Genetics 132:823-839.
Tachida H and Cockerham CC (1989) A building block model for quantitative genetics. Genetics 121:839-844.
re-combinant inbred line population derived from an elite rice hybrid. Theor Appl Genet 103:1037-1045.
Tinker NA, Mather DE, Rossnagel BG, Kasha KJ, Kleinhofs A, Hayes PM, Falk DE, Ferguson T, Shugar LP, Legge WG,et al.(1996) Regions of the genome that affect agronomic per-formance in two-row barley. Crop Sci 36:1053-1062. Upadhyaya HD, Sharma S, Singh S and Singh M (2011).
Inheri-tance of drought resisInheri-tance related traits in two crosses of groundnut (Arachis hypogaeaL.). Euphytica 177:55-66. Xiao J, Li J, Yuan L and Tanksley SD (1995) Dominance is the
major genetic basis of heterosis in rice as revealed by QTL analysis using molecular markers. Genetics 140:745-754. Xing YZ, Tan YF, Hua JP, Sun XL and Zhang Q (2002)
Charac-terization of the main effects, epistatic effects and their envi-ronmental interactions of QTLs on the genetic basis of yield traits in rice. Theor Appl Genet 105:248-257.
Yu SB, Li JX, Xu CG, Tan YF, Gao YJ, Li XH, Zhang Q and Maroof MAS (1997) Importance of epistasis as the genetic
basis of heterosis in an elite rice hybrid. Proc Natl Acad Sci USA 94:9226-9231.
Zeng Z-B, Wang T and Zou W (2005) Modeling quantitative trait loci and interpretation of models. Genetics 169:1711-1725.
Internet Resources
GrainGenes, a database for Triticeae and Avena: The Steptoe´
Morex Barley Mapping Population,
http://wheat.pw.usda.gov/ggpages/SxM (July 16, 2012). GrainGenes, a database for Triticeae and Avena: Hordeum,
http://wheat.pw.usda.gov/ggpages/maps/ Hordeum (July 16, 2012).
Associate Editor: Dario Grattapaglia
![Table 2 - Percentage phenotypic variance (R 2 100 [in %]) explained by QTL effects (for model 1) and by QTL effects and their epistasis effects (for model 2) for 150 doubled haploid lines of barley obtained from the Steptoe ´ Morex cross.](https://thumb-eu.123doks.com/thumbv2/123dok_br/16065632.696967/4.918.161.755.431.1089/percentage-phenotypic-variance-explained-effects-epistasis-obtained-steptoe.webp)
![Table 4 - Percentage phenotypic variance (R 2 100 [in %]) explained by QTL effects (for model 1) and by QTL effects and their epistasis effects (for model 2) for 145 doubled haploid lines of barley obtained from the Harrington ´ TR306 cross.](https://thumb-eu.123doks.com/thumbv2/123dok_br/16065632.696967/6.918.157.758.146.565/percentage-phenotypic-variance-explained-effects-epistasis-obtained-harrington.webp)
