Acta Scientiarum
http://www.uem.br/acta ISSN printed: 1679-9275
ISSN on-line: 1807-8621
Doi: 10.4025/actasciagron.v38i3.28347
Acta Scientiarum. Agronomy Maringá, v. 38, n. 3, p. 317-328, July-Sept., 2016
Genetic effects for controlling stripe rust (
Puccinia striiformis f. sp.
tritici
) resistance in wheat through joint segregation analysis
Kalim Ullah1, Naqib Ullah Khan2*, Rozina Gul2, Samrin Gul2, Mohammad Irfaq Khan3 and Imdad Ullah Khan4
1
PCCC Cotton Research Station, Dera Ismail Khan, Pakistan. 2Department of Plant Breeding and Genetics, The University of Agriculture,
Peshawar 25130, Pakistan. 3
Nuclear Institute for Food and Agriculture, Peshawar, Pakistan. 4
Department of Soil and Environmental Sciences, Faculty of Agriculture, Gomal University, Dera Ismail Khan, Pakistan. *Author for correspondence. E-mail: nukmarwat@yahoo.com;
nukmarwat@aup.edu.pk
ABSTRACT. Mixed inheritance analysis using joint segregation analysis (JSA) for stripe rust (Puccinia striiformis f. sp. tritici) resistance was carried out in six basic populations (P1, F1, P2, BC1, BC2 and F2) of four
wheat crosses (Hashim-08 × LU-26, Farid-06 × Shafaq, Parula × Blue Silver, TD-1 × D-97603) during crop season 2009 to 2012. Genes controlling stripe rust resistance were assessed by using area under disease progress curve (AUDPC). The AUDPC was controlled by mixed two additive-dominant-epistatic major genes plus additive-dominant-epistasis of polygenes in cross Hashim-08 × LU-26 (model E), while in Farid-06 × Shafaq, it was controlled by mixed two major additive-dominant genes plus additive-dominant polygenes (model E-2). In cross Parula × Blue Silver, the AUDPC was managed by additive, dominance and epistasis of two major genes (model B-1), however, it was controlled by mixed one major gene and additive dominant polygenes in cross TD-1 × D-97603 (model D-1). Genetic variation and heritability was higher in major genes than polygene for all the crosses showing that AUDPC was mainly controlled by major genes. The genetic behavior of the AUDPC revealed that stripe rust resistance was controlled by mixed interaction of one to two major genes plus polygenes.
Keywords: area under disease progress curve (AUDPC), major gene and polygene inheritance, segregating populations, stripe rust (Puccinia striiformis f. sp. tritici), Triticum aestivum L.
Análise da herança mista da resistência do trigo à ferrugem linear (Puccinia striiformis f.
sp. tritici) por meio da análise conjunta da segregação
RESUMO. Foi utilizada a análise conjunta da segregação (JSA) para o estudo da herança mista da resistência do trigo à ferrugem linear (Puccinia striiformis f. sp. tritici), a partir de seis populações (P1, F1, P2, RC1, RC2 e F2) obtidas de quatro cruzamentos de trigo (Hashim-08 × LU-26; Farid-06 × Shafaq; Parula × Blue Silver e TD-1 × D-97603), entre as safras 2009 e 2012. O efeito dos genes que controlam a resistência do trigo à ferrugem linear foi avaliado pela área formada sob a curva de progressão da doença (ASCPD). No cruzamento entre Hashim-08 e LU-26, o controle foi exercido por dois genes principais de efeito aditivo-dominante-epistático, mais o efeito de poligenes aditivos-dominantes-epistáticos (modelo E). No cruzamento Farid-06 × Shafaq, a resistência foi controlada por dois genes dominantes principais e também por poligenes aditivos-dominantes (modelo E-2). No cruzamento Parula× Blue Silver, a ASCPD indicou uma resistência controlada por dois genes principais de efeito aditivo, dominante e epistático (modelo B-1). No cruzamento T1 × D-97603, a ASCPD permitiu inferir um controle decorrente da ação de um único gene maior, acrescido ao efeito de poligenes aditivos dominantes (modelo D-1). Considerando que o efeito dos genes principais sobre a variação genética e herdabilidade foi superior ao efeito dos poligenes, para todos os híbridos, a ASCPD dependeu principalmente da expressão dos genes maiores. O padrão genético indicado pela ASCPD permitiu concluir que a resistência do trigo à ferrugem linear foi decorrente da interação de um a dois genes principais com os poligenes.
Palavras-chave: área s área formada sob a curva de progressão da doença; genes maiores e poligenes; herança; populações segregantes; ferrugem amarela.
Introduction
Rusts are the most important constraints in wheat production throughout the world. In our continent, leaf and stripe rust affects the production on approximately 60 (63%) and 43 (46%) million
resistance sources, however, is the most stable and economical method. Thus from the last few decades, rust management has been focused mainly through genetic resistance. In the beginning, rust was controlled through the integration of major resistance genes. However, due to the non-durability, later on the trend changed and hence growing the cultivars with adequate levels of durable resistance (additive effect of partial resistance of adult plant resistance genes) seems to be the best control strategy.
Stripe rust, also called yellow rust (Yr), is a fungal disease caused by P. striiformis. f. sp. tritici. It is the most damaging disease in the wheat growing areas in the world (Zhang, Yang, Li, Jin, & Yang, 2001). The disease requires cool and humid climatic conditions (Mamluk, 1992) and lower optimum temperature for its development (Ma & Singh, 1996). Presently, the yellow rust is a major wheat production constraint in most of the wheat growing areas of Pakistan. Grain yield losses of 10 to 70% have been reported depending upon the cultivar grown and the environmental conditions during ear emergence (Imtiaz, Cromey, Hampton, & Ogbonnaya, 2005). Tremendous losses of wheat production have been associated with yellow rust, when epiphytotics occurred under favourable conditions (Yahyaoui et al., 2002).
Stripe rust being a foliar disease has characteristic infection of powdery masses (uredial pustules) of yellow spores which forms stripes on the leaf surface. The uredial pustules have a characteristic torn margin and can occur on both sides of the leaves, stems, and heads. The pustules can cover large areas of affected leaves on young plants, and on older plants, the pustules arranged in parallel lines. This arrangement gives affected leaves a characteristic striped appearance. Severe attacks quickly give rise to yellowing, chlorosis and later necrosis. When the pustules mature, they break open to release a yellow-orange mass of urediospores. On seedlings, the pustules are scattered across the leaves in no order. In many wheat cultivars, the spores (pustules) develop in long, narrow, yellow stripes on leaves, leaf sheaths and heads. Once infected plants mature or become stressed, the tissue becomes brown and dry, and plants have a scorched and droughty appearance (Ma & Singh, 1996).
Most of the wheat cultivars released so far have race specific resistant with no resistance against the virulence of all pathogenic races. The gene Yr9
controlling race specific resistance to stripe rust, after being widely used in early 1980s, was rendered ineffective by new stripe rust fungus races resulting in larger wheat yield losses. Another type of resistance introduced as durable resistance which remains effective in a cultivar is high temperature adult plant
(HTAP) resistance which is non-race specific (Suenaga,Singh, Haurta-Espino, & William, 2003). In addition, other terms such as slow rusting and horizontal resistance are used to describe such type of resistance pattern. This type of resistance may be conditioned by group of minor genes and may not be easily and rapidly overcome. Wheat genotypes having slow rusting genes are often susceptible at seedling stage, but in adult stage, they exhibit moderate to high resistance to all types of the pathogens (Singh, Nelson, & Sorrells, 2000). Transgressive segregation has been observed in wheat for HTAP resistance and slow rusting resistance to stripe rust, and currently three stripe rust resistance genes named Yr18, Yr29 and Yr30
confer slow rusting (Singh, 1992; Suenaga, et al., 2003; William, Singh, Huerta-Espino, Ortiz, & Hoisington, 2003).
From the above information, regarding genetic control of stripe rust in wheat, it could be conferred that race specific or vertical resistance is of no more importance due to the occurrence of new pathotypes of fungus. At present, our ultimate aim should be to emphasize on non-race specific adult plant resistance and slow rusting which suggests that the stripe rust is not controlled by single major gene, and is inherited polygenically (Imtiaz, Cromey, Hampton, & Ahmad, 2003; Imtiaz et al., 2005). Therefore, the present study was designed to evaluate the genetic behavior and inheritance pattern of the genes controlling the area under disease progress curve (AUDPC) and to select the desirable genotypes for future breeding strategies.
Material and methods
Plant materials and procedure
Eight genetically diverse parental genotypes selected from wheat germplasm, were crossed in four combinations i.e. Hashim-08 × LU-26, Farid-06 × Shafaq, Parula × Blue Silver and T1 × D-97603. Six basic populations i.e. Parent-1 (P1: pollen
recipient), first filial generation (F1), Parent-2 (P2:
pollen donor), Back cross-1 (BC1: F1 (pollen
recipient) × P1 (pollen donor), Back cross-2 (BC2:
F1 (pollen recipient) × P2 (pollen donor) and second
filial generation (F2) of each cross were developed
Acta Scientiarum. Agronomy Maringá, v. 38, n. 3, p. 317-328, July-Sept., 2016
different populations, two rows (having 80 plants) were planted for parents (P1, P2) and F1 populations,
four rows (160 plants) for back cross populations (BC1, BC2) and six rows (240 plants) for F2
populations in each replication. Row length, plants and rows spacing were kept at four meters, 10 and 30 cm, respectively. All other cultural practices and inputs were applied same to all the entries to minimize the environmental variations.
Each accession of the yellow rust screening nursery was bordered with a susceptible check of ‘Morocco’ as a spreader of yellow rust disease. Nursery was inoculated at tillering stage as to provide artificial yellow rust diseased condition in the field by making uniform spray of yellow rust urediospores (Puccinia striiformis) suspension at the end of February (Zadoks, Chang, & Konzak, 1974). The inoculum was contained mixture of urediospores of different yellow rust races prevalent in Pakistan. The urediospores were collected every year from different wheat growing regions in the country under Crop Disease Research Program (CDRP) at National Agricultural Research Centre (NARC), Islamabad, Pakistan. The inoculum was obtained from Wheat Research Institute Faisalabad, Pakistan. Preparation of spore's suspension, spores concentration of the inoculum, spraying of the spore’s suspension on the nursery material and making of conditions conducive for disease development in the nursery were adapted as used by Khan, Ajab, Khattak, Mohammad, and Shah (2009b).
Measurement of the area under disease progress curve (AUDPC)
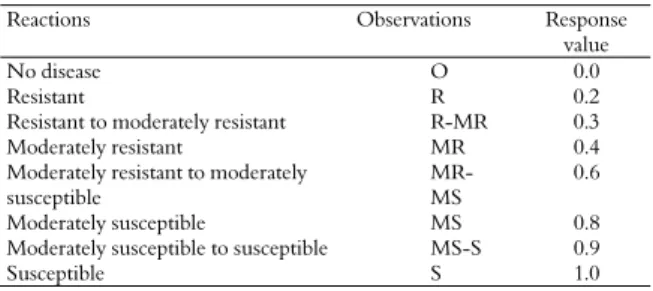
The disease severity data on ten randomly selected plants were visually recorded three times after seven days interval between the consecutive readings as suggested by Imtiaz et al. (2003). The severity was recorded from 0 to 100% rust infection on selected plants according to method of modified cob scale (Peterson, Campbell, & Hannah, 1948), and the response of individual plants was recorded (Table 1). Coefficient of infection (CI) was calculated by multiplying the response value with the intensity of infection in percent (Table 3). Average coefficient of infection (ACI) was derived from the sum of CI values of each entry divided by the number of replications. The area under disease progress curve (AUDPC) was calculated for individual plants using the CI values from the original rust severity data by using the following formula as suggested by Arama, Parlevliet, and Van-Silfhout (2000).
] )/ [(
AUDPC =
Xi + Xi+ 1 2 tiwhere X i and Xi +1 are severity on date i and date i
+ 1, respectively and ti is the number of days
between date i and date i + 1.
Table 1. Response values of major infection type classes for stripe rust.
Reactions Observations Response
value
No disease O 0.0
Resistant R 0.2
Resistant to moderately resistant R-MR 0.3 Moderately resistant MR 0.4 Moderately resistant to moderately
susceptible
MR- MS
0.6
Moderately susceptible MS 0.8 Moderately susceptible to susceptible MS-S 0.9
Susceptible S 1.0
Statistical analysis
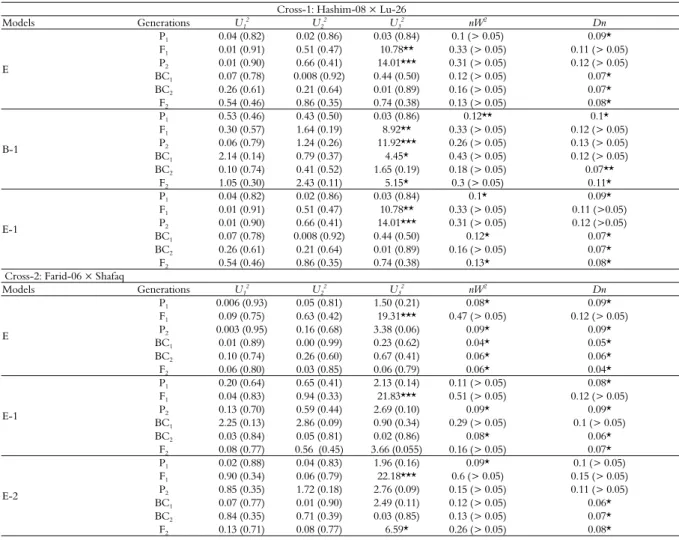
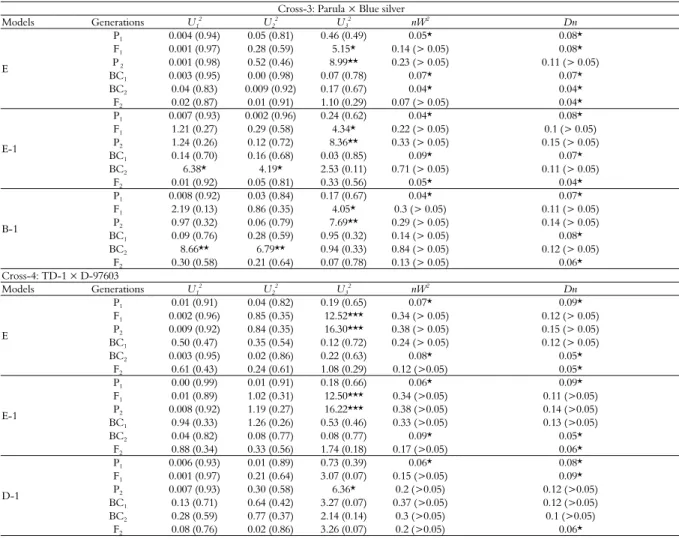
The data regarding AUDPC were subjected to five groups consisting of 24 different genetic models of Joint Segregation Analysis (JSA) designed for six basic populations (Gai & Wang, 1998; Gai, Zhang, & Wang, 2003; Gai, Wang, Wu, & Chen, 2007) (Table 2). Suitable genetic models for each cross combination were determined by using maximum log of likelihood estimates (Wang & Gai, 1997) and Akaike’s information criterion (Akaike, 1977). Further selection of best fit model was made on the basis of all non-significant or least number of non-significant values of three chi-square statistics i.e. U12, U22and U32 (Table 5 and
6). Two other important completely distribution free tests i.e. Smirnov’s statistics (nW2) and Kolmogorove’s
statistics (Dn) were used as goodness of fit tests to determine whether the selected model sufficiently explains the data (Table 5 and 6). However, if for a particular genetic model, none of these five statistics were found significant, then the data were adequately fit to the model (Gai & Wang, 1998; Ullah et al., 2014a). The data were analyzed by using sin.exe software
and the major gene-polygene mixed inheritance model to a joint analysis of multi-generations (Gai et al., 2003). In case of the best fit model, the values of second order genetic parameters as well as variation due to major genes (σmg2) and polygene (σpg2) for BC1,
BC2 and F2 were worked out with the help of proposed
formulae (Gai et al., 2003; Zhang, Gai, & Yang, 2003). Under the second order genetic parameters, the phenotypic variation (σp2) partitioned into genetic and
environmental variation (σe2) for each cross. Based on
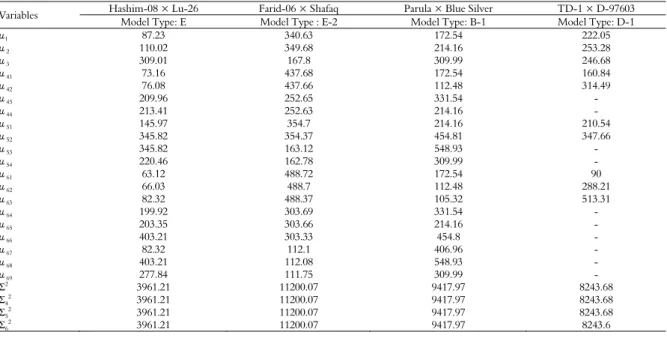
Mather and Jinks (1982), the values from μ1 to μ69 presented in Table 7 are representing different means of component distributions (Wang, Podlich, Cooper, & Delacy, 2001; Zhang et al., 2003; Ullah et al., 2014b) regarding six basic populations (P1, F1, P2, BC1, BC2
and F2) which are to put in the formulae as suggested
by Gai et al. (2003) for calculating 1st and 2nd order
Results
Plant population distribution for AUDPC in various crosses
In frequency distribution of plant population in P1,
F1, P2, BC1, BC2 and F2 with respect to AUDPC level
revealed that in cross Hashim-08 × LU-26, the tendency of both F1 and BC1 was towards disease
susceptible parent (P1) and AUDPC values ranged
from 250 to 450, 150 to 400 and 200 to 500 for P1, F1
and BC1, respectively (Table 3). While the tendency of
BC2 was towards stripe rust resistant parent (P2) and
AUDPC was recorded from 0 to 250 and 0 to 400 for P2 and BC2, respectively (Table 3). For cross Farid-06
× Shafaq, in F1 and BC1 populations the trend was
towards P1 and their corresponding AUDPC values
were ranging from 200 to 550, 150 to 650 and 150 to 600 for P1, F1 and BC1, respectively. The AUDPC
values for P2 and BC2, were ranging from 50-300 and
50-550, respectively indicating the tendency of BC2
towards P2. Similar response and tendency of F1, BC1
and BC2 was also observed in cross Parula × Blue Silver,
and the ranges were 50 to 350, 50 to 400 and 0 to 400 for P1, F1 and BC1, respectively. Similarly, P2 (150 to 500)
and BC2 (150 to 700) revealed the tendency of BC2
towards the respective parent. In cross T1 × D-97603, the F1, BC1 and BC2 were equally distributed
between the parents for AUDPC level because of slight differences between the P1 (100 to 400) and P2 (100 to
450). The F2 segregating populations among four crosses
were almost equally distributed between the both parents. The genetic behavior of AUDPC revealed that in F2 and some BC1 and BC2 generations, the resistance
to stripe rust was controlled by mixed interaction of one to two major genes plus polygene.
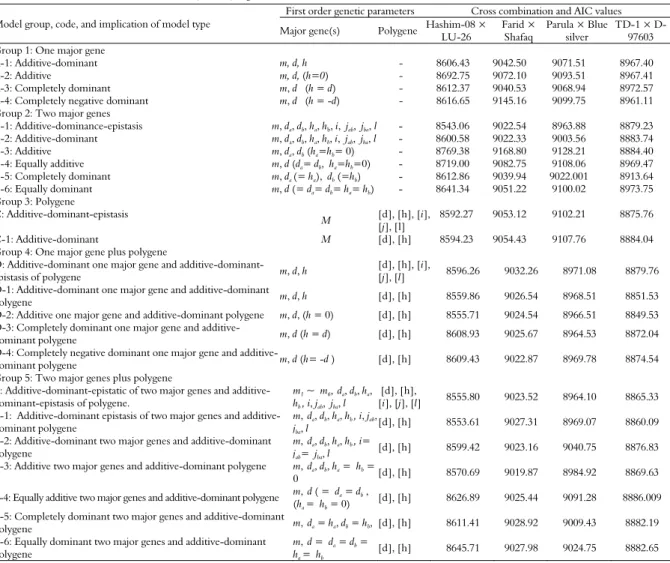
Table 2. Akaike’s information criterion (AIC) values for AUDPC under five groups of 24 genetic models estimated through the iterated expectation and conditional maximization (IECM) algorithm.
Model group, code, and implication of model type
First order genetic parameters Cross combination and AIC values
Major gene(s) Polygene Hashim-08 × LU-26
Farid × Shafaq
Parula × Blue silver
T1 × D-97603 Group 1: One major gene
A-1: Additive-dominant m, d, h - 8606.43 9042.50 9071.51 8967.40 A-2: Additive m, d, (h=0) - 8692.75 9072.10 9093.51 8967.41 A-3: Completely dominant m, d (h = d) - 8612.37 9040.53 9068.94 8972.57 A-4: Completely negative dominant m, d (h = -d) - 8616.65 9145.16 9099.75 8961.11 Group 2: Two major genes
B-1: Additive-dominance-epistasis m, da, db, ha, hb, i, jab, jba,l - 8543.06 9022.54 8963.88 8879.23
B-2: Additive-dominant m, da, db, ha, hb, i, jab, jba,l - 8600.58 9022.33 9003.56 8883.74
B-3: Additive m, da, db (ha=hb= 0) - 8769.38 9168.80 9128.21 8884.40
B-4: Equally additive m, d (da= db, ha=hb=0) - 8719.00 9082.75 9108.06 8969.47
B-5: Completely dominant m, da (= ha), db (=hb) - 8612.86 9039.94 9022.001 8913.64
B-6: Equally dominant m, d (= da= db= ha= hb) - 8641.34 9051.22 9100.02 8973.75
Group 3: Polygene
C: Additive-dominant-epistasis
M [d], [h], [i], [j], [l]
8592.27 9053.12 9102.21 8875.76
C-1: Additive-dominant M [d], [h] 8594.23 9054.43 9107.76 8884.04 Group 4: One major gene plus polygene
D: Additive-dominant one major gene and additive-dominant-epistasis of polygene m, d, h
[d], [h], [i],
[j], [l] 8596.26 9032.26 8971.08 8879.76 D-1: Additive-dominant one major gene and additive-dominant
polygene m, d, h [d], [h] 8559.86 9026.54 8968.51 8851.53 D-2: Additive one major gene and additive-dominant polygene m, d, (h = 0) [d], [h] 8555.71 9024.54 8966.51 8849.53 D-3: Completely dominant one major gene and
additive-dominant polygene m, d (h = d) [d], [h] 8608.93 9025.67 8964.53 8872.04 D-4: Completely negative dominant one major gene and
additive-dominant polygene m, d (h= -d ) [d], [h] 8609.43 9022.87 8969.78 8874.54 Group 5: Two major genes plus polygene
E: Additive-dominant-epistatic of two major genes and additive-dominant-epistasis of polygene.
m1 ~ m6,da, db, ha,
hb , i, jab, jba, l
[d],[h],
[i], [j],[l] 8555.80 9023.52 8964.10 8865.33 E-1: Additive-dominant epistasis of two major genes and
additive-dominant polygene
m,da, db, ha, hb , i, jab,
jba, l
[d],[h] 8553.61 9027.31 8969.07 8860.09
E-2: Additive-dominant two major genes and additive-dominant polygene
m,da, db, ha, hb , i=
jab= jba, l
[d],[h] 8599.42 9023.16 9040.75 8876.83
E-3: Additive two major genes and additive-dominant polygene m,da, db, ha = hb =
0 [d], [h] 8570.69 9019.87 8984.92 8869.63
E-4: Equally additive two major genes and additive-dominant polygene m, d ( = da = db ,
(ha = hb = 0)
[d], [h] 8626.89 9025.44 9091.28 8886.009
E-5: Completely dominant two major genes and additive-dominant
polygene m,da= ha, db = hb, [d], [h] 8611.41 9028.92 9009.43 8882.19
E-6: Equally dominant two major genes and additive-dominant polygene
m,d = da = db =
ha = hb
[d], [h] 8645.71 9027.98 9024.75 8882.65
m: Population mean. d, [d]: Additive effect due to major gene(s) and polygenes, respectively. h, [h]: Dominant component due to major gene(s) and polygenes, respectively. i, [i]: Additive × Additive component due to major gene(s) and polygene, respectively. jab:da× hb: First major gene with additive ×
second major gene with dominant effect. jba: db× ha: Second major gene with additive × first major gene with dominant effect. [j]: Additive-dominance
Acta Scientiarum. Agronomy Maringá, v. 38, n. 3, p. 317-328, July-Sept., 2016 Table 3. Frequency distribution of plant population of area under disease progress curve (AUDPC) in P1, F1, P2, BC1, BC2 and F2 of four bread wheat crosses.
Crosses Generations Range of area under disease progress curve (AUDPC) Size Mean Variance 0 50 100 150 200 250 300 350 400 450 500 550 600 650 700
Hashim -08 × LU-26
P1 - - - - - 6 12 15 17 6 - - - - - 60 87.23 3337.03
F1 - - - 25 15 10 16 19 5 - - - - - - 90 110.02 5136.00
P2
1
0 8 12 13 10 11 - - - -
- - -
60 309.01 6659.57
BC1 - - - - 23 22 21 12 21 26 25 - - - - 150 141.58 8102.01
BC2
1
2 11 8 13 19 31 19 16 14 - - -
- - -
150 261.29 14641.75
F2
1
2 14 24 17 23 20 18 22 16 19 15 -
- - - 200 225.37 20299.61
Farid-06 × Shafaq
P1 - - - - 7 11 6 8 12 6 6 4 - - - 60 339.73 11891.83
F1 - - - 7 9 12 12 9 8 13 8 6 4 2 - 90 340.72 18271.91
P2 - 8 10 10 12 13 7 - - - - - - 60 155.25 6651.03
BC1 - - - 12 13 9 16 22 28 17 13 15 5 - - 150 347.53 15471.98
BC2 - 7 12 11 21 19 23 17 8 11 11 10 - - - 150 272.16 19126.62
F2
1
2 9 14 10 22 23 15 20 14 11 16 17
7 7 3
200 300.31 33193.92
Parula × Blue Silver
P1 - 7 9 8 10 14 7 5 - - - - - - - 60 172.93 8805.38
F1 - 9 11 12 13 17 13 7 8 - - - - - - 90 197.72 10909.15
P2 - - - 8 6 10 7 9 6 9 5 - - - - 60 295.66 12292.97
BC1 8 12 13 17 25 19 16 31 9 - - - - - - 150 209.38 14740.10
BC2 - - - 4 6 12 13 15 19 21 12 15 13 9 11 150 421.96 21620.88
F2 9 8 13 15 19 16 21 17 22 23 16 6 6 7 2 200 301.38 28682.10
TD-1 × D-97603
P1 - - 8 7 10 12 13 7 3 - - - 60 220.61 7314.41
F1 - - 8 12 14 9 17 13 11 6 - - - - - 90 252.11 10519.45
P2 - - 6 10 8 7 8 9 7 5 - - - 60 246.36 12271.25
BC1 - 7 13 17 15 18 25 31 14 10 - - - - - 150 242.78 12938.37
BC2 - - 11 15 14 16 20 30 26 13 7 - - - - 150 282.85 12093.24
F2 8 12 20 17 13 23 17 15 14 21 12 9 13 6 - 200 289.55 32906.28
Genetic analysis of stripe rust in various wheat crosses
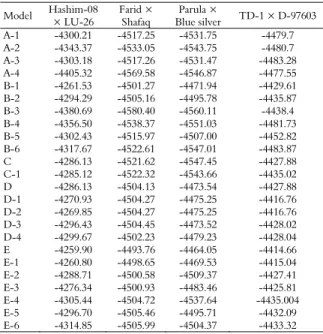
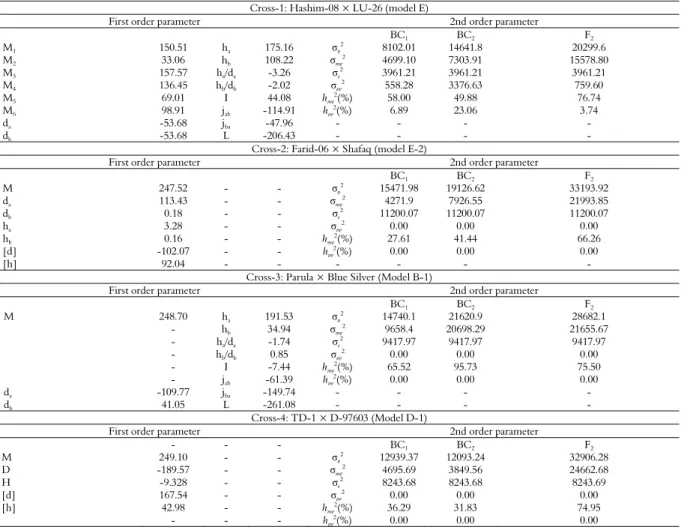
According to Akaike’s information criterion (Table 2), maximum log of likelihood values (Table 4), and goodness of fit tests (Table 5), the model E was selected as the best fit genetic model for cross Hashim-08 × LU-26. The model E revealed that AUDPC was controlled by mixed two dominant-epistatic major genes plus additive-dominant-epistasis of polygene. Regarding AUDPC, the negative and equal additive (da, db) effect (-53.68) was exhibited by two major genes (A & B). While dominant effects (ha, hb) were exhibited by two major genes (A & B) regarding AUDPC with values of 175.16 and 108.22, respectively. Dominant ratios (ha/da & hb/db) of major genes A and B were recorded as -3.26 and -2.02, respectively. Additive × additive effect (i) of the major genes plus polygene was found to be 44.08. The additive × dominant effect of gene A over gene B (Jab) and that of B over A (Jba) were -114.91 and -47.96, respectively. Negative dominant × dominant type of non-allelic interaction (l) was recorded as -206.43.
The second order genetic parameters in cross Hashim-08 × LU-26, represents the phenotypic variation for AUDPC in segregating generations BC1, BC2 and F2 (Table 8). The genetic variation
was further divided into variation due to major genes and polygene. According to the best-fit model E, as the resistance was controlled by two major genes plus polygene, therefore higher phenotypic
variation (σp2) was observed in BC1, BC2 and F2. The
major-gene heritability (hmg2) values which are
among the most important second order parameters were recorded as 58, 49.88 and 76.74% for BC1,
BC2, and F2, respectively. The polygene heritability
(hpg2) values were estimated as 6.98, 23.06 and 3.74%
for BC1, BC2 and F2, respectively. Maximum
variation and heritability were estimated in major genes than polygene, however, the polygene heritability revealed its contribution in controlling the said trait.
For cross Farid-06 × Shafaq, the Model E-2 was selected as the best fit model on the basis of Akaike’s information criterion (Table 2), maximum log of likelihood values (Table 4) and goodness of fit test (Table 5). Genetic model E-2 represents that AUDPC was controlled by mixed two major additive-dominant genes plus additive-dominant polygene. The population mean for the cross Farid-06 × Shafaq was 247.52, while the additive components were estimated to be 113.43 and 0.18, respectively. The dominant components for the said cross were recorded as 3.28 and 0.16, respectively. Adverse additive effect was negative (-102.07) while dominance effect was positive (92.04) produced by of polygene. The second order genetic parameters for the said cross indicates that the phenotypic variation among BC1, BC2 and F2 was
mainly due to major genes and environment (Table 8). The major gene heritability values for BC1, BC2 and F2
very few minor genes (polygene) were involved in controlling the AUDPC by contributing very small effects towards controlling of the trait.
Table 4. Maximum log of likelihood estimates for area under disease progress curve (AUDPC) under various genetic models estimated through IECM algorithm.
Model Hashim-08 × LU-26
Farid × Shafaq
Parula ×
Blue silver TD-1 × D-97603 A-1 -4300.21 -4517.25 -4531.75 -4479.7 A-2 -4343.37 -4533.05 -4543.75 -4480.7 A-3 -4303.18 -4517.26 -4531.47 -4483.28 A-4 -4405.32 -4569.58 -4546.87 -4477.55 B-1 -4261.53 -4501.27 -4471.94 -4429.61 B-2 -4294.29 -4505.16 -4495.78 -4435.87 B-3 -4380.69 -4580.40 -4560.11 -4438.4 B-4 -4356.50 -4538.37 -4551.03 -4481.73 B-5 -4302.43 -4515.97 -4507.00 -4452.82 B-6 -4317.67 -4522.61 -4547.01 -4483.87 C -4286.13 -4521.62 -4547.45 -4427.88 C-1 -4285.12 -4522.32 -4543.66 -4435.02 D -4286.13 -4504.13 -4473.54 -4427.88 D-1 -4270.93 -4504.27 -4475.25 -4416.76 D-2 -4269.85 -4504.27 -4475.25 -4416.76 D-3 -4296.43 -4504.45 -4473.52 -4428.02 D-4 -4299.67 -4502.23 -4479.23 -4428.04 E -4259.90 -4493.76 -4464.05 -4414.66 E-1 -4260.80 -4498.65 -4469.53 -4415.04 E-2 -4288.71 -4500.58 -4509.37 -4427.41 E-3 -4276.34 -4500.93 -4483.46 -4425.81 E-4 -4305.44 -4504.72 -4537.64 -4435.004 E-5 -4296.70 -4505.46 -4495.71 -4432.09 E-6 -4314.85 -4505.99 -4504.37 -4433.32
For cross Parula × Blue Silver, the suitable model was B-1 which selected on the basis of smallest AIC values (Table 3), likelihood estimates (Table 4) and goodness of fit tests (Table 6). However, the model B-1 represents that AUDPC was controlled by additive, dominance and epistasis of two major genes. The population mean for the AUDPC was recorded as 248.70. The additive effect due to the first major gene (A) was negative (-109.77) while that was positive (41.05) due to the 2nd major gene (B). Positive dominant effects were
exhibited both by first and second major genes with values of 191.53 and 34.94, respectively. Under the epistasis of the two major genes, the additive × additive and dominant × dominant effects were negative i.e. -7.44 and -261.018, respectively. The additive × dominant epistatic effects were found negative due to first major gene and second major gene. The second order genetic parameters of the cross revealed the phenotypic variations in the segregating generations BC1, BC2 and F2 which were
controlled by genetic and environmental components (Table 8). Heritability values of major genes were for BC1 (66.03%), BC2 (95.63%) and F2
(75.50%). However, polygene variation and heritability values were zero because no minor genes (polygene) were involved for expression of AUDPC in cross Parula × Blue Silver.
For cross TD-1 × D-97603, on the basis of likelihood and smallest AIC values (Tables 3 and 4) and goodness of fit tests (Table 6), the best fit genetic model was D-1 representing the effect of mixed one major gene and additive dominant polygene for AUDPC. The population mean of the cross was found to be 249.10. Due to major genes, negative additive effect (-189.57) was recorded while polygene showed positive additive and dominant effects with values of 167.54 and 42.98, respectively. As evident from the 2nd order genetic parameters
(Table 8), the variance and broad sense heritability of the major genes were higher than those of the polygene in cross TD-1 × D-97603 for AUDPC. The values with respect to polygenic varianceas well as polygenic heritability were equal to zero for BC1,
BC2 and F2 generations. The lower values of
polygenic variation and heritability might be due to epistatic effects between the major and minor genes.
Discussion
Joint segregation analysis (JSA) is used to analyze the segregating data of quantitatively controlled traits like the Mendelian procedure. Unlike quantitative trait locus (QTL) mapping, the JSA neither can identify many QTLs nor locate the position of the major genes on a particular chromosome (Gai et al., 2007). While designing breeding experiments for the improvement of quantitative traits, selecting parents for crosses, progeny selection and gene pyramiding, the JSA is strongly recommended as a simple and useful technique. The technique is helpful to know the number of major genes, their kinds of genetic effects, heritability values of polygene as well as genetic information on all kinds of genetic effects (Wang & Gai, 2001; Gai et al., 2007). In addition, JSA can also be used as a check for QTLs mapping and it should be conducted before QTL mapping is performed so that plant breeders can have a first impression on the genetic system of involved trait (Gai et al., 2007).
Acta Scientiarum. Agronomy Maringá, v. 38, n. 3, p. 317-328, July-Sept., 2016
dominant negative effects also favor the epistasis of major genes and polygene. Past studies revealed that the AUDPC in wheat crosses was controlled by additive dominance epistatic effect of two major genes plus polygene (Khan et al., 2009a). In QTLs mapping for leaf and stripe rust in wheat, Singh et al. (2014) also identified several epistatic effects both for both rusts resistance QTL. In wheat cultivars, the AUDPC was controlled by three/four genes in cv. Sonoita 81, two/three genes in Tanager-S, three genes in Galvez 87, and cvs. Ures-81 and Moncho-S have two genes for slow rusting resistance to leaf rust (Das, Rajaram, Kronstad, Mundt, & Singh, 1993; Das, Rajaram, Mundt, & Kronstad, 2004). Leaf rust resistance was reported in 50 Mexican wheat cultivars and several genotypes were identified with adult plant resistance (Singh & Rajaram, 1991). For stripe rust resistance, the wheat cvs. Libellula and Xian Nong-4 showed two to three resistance genes,
and cv. San Pastore appears to have two to four resistance genes (Zhang et al., 2001).
In cross Farid-06 × Shafaq, the resistance to stripe rust was controlled by mixed two major additive-dominant genes plus additive dominant polygene. Due to first and second major genes, positive additive effects were recorded. This revealed that AUDPC was under the control of additive effect of both major and minor genes. In previous studies, the AUDPC was under the control of two major genes with additive dominance epistatic effect plus additive dominant polygene in wheat crosses (Khan et al., 2009b). In inheritance of resistance to stripe rust in winter wheat cultivars, the dominant component was detected in some cases, and the resistance was conditioned by oligogenes (polygene) with heritability of the resistance ranging from 50 to 79% (Feng et al., 2007). Three and four QTL controlled the slow leaf rusting resistance in the wheat crosses (William et al., 2003).
Table 5. Test for goodness of fit regarding area under disease progress curve (AUDPC) of models C, D and E.
Cross-1: Hashim-08 × Lu-26
Models Generations U1
2 U
2
2 U
3
2 nW2 Dn
E
P1 0.04 (0.82) 0.02 (0.86) 0.03 (0.84) 0.1 (> 0.05) 0.09*
F1 0.01 (0.91) 0.51 (0.47) 10.78** 0.33 (> 0.05) 0.11 (> 0.05)
P2 0.01 (0.90) 0.66 (0.41) 14.01*** 0.31 (> 0.05) 0.12 (> 0.05)
BC1 0.07 (0.78) 0.008 (0.92) 0.44 (0.50) 0.12 (> 0.05) 0.07*
BC2 0.26 (0.61) 0.21 (0.64) 0.01 (0.89) 0.16 (> 0.05) 0.07*
F2 0.54 (0.46) 0.86 (0.35) 0.74 (0.38) 0.13 (> 0.05) 0.08*
B-1
P1 0.53 (0.46) 0.43 (0.50) 0.03 (0.86) 0.12** 0.1*
F1 0.30 (0.57) 1.64 (0.19) 8.92** 0.33 (> 0.05) 0.12 (> 0.05)
P2 0.06 (0.79) 1.24 (0.26) 11.92*** 0.26 (> 0.05) 0.13 (> 0.05)
BC1 2.14 (0.14) 0.79 (0.37) 4.45* 0.43 (> 0.05) 0.12 (> 0.05)
BC2 0.10 (0.74) 0.41 (0.52) 1.65 (0.19) 0.18 (> 0.05) 0.07**
F2 1.05 (0.30) 2.43 (0.11) 5.15* 0.3 (> 0.05) 0.11*
E-1
P1 0.04 (0.82) 0.02 (0.86) 0.03 (0.84) 0.1* 0.09*
F1 0.01 (0.91) 0.51 (0.47) 10.78** 0.33 (> 0.05) 0.11 (>0.05)
P2 0.01 (0.90) 0.66 (0.41) 14.01*** 0.31 (> 0.05) 0.12 (>0.05)
BC1 0.07 (0.78) 0.008 (0.92) 0.44 (0.50) 0.12* 0.07*
BC2 0.26 (0.61) 0.21 (0.64) 0.01 (0.89) 0.16 (> 0.05) 0.07*
F2 0.54 (0.46) 0.86 (0.35) 0.74 (0.38) 0.13* 0.08*
Cross-2: Farid-06 × Shafaq
Models Generations U1
2 U
2
2 U
3
2 nW2 Dn
E
P1 0.006 (0.93) 0.05 (0.81) 1.50 (0.21) 0.08* 0.09*
F1 0.09 (0.75) 0.63 (0.42) 19.31*** 0.47 (> 0.05) 0.12 (> 0.05)
P2 0.003 (0.95) 0.16 (0.68) 3.38 (0.06) 0.09* 0.09*
BC1 0.01 (0.89) 0.00 (0.99) 0.23 (0.62) 0.04* 0.05*
BC2 0.10 (0.74) 0.26 (0.60) 0.67 (0.41) 0.06* 0.06*
F2 0.06 (0.80) 0.03 (0.85) 0.06 (0.79) 0.06* 0.04*
E-1
P1 0.20 (0.64) 0.65 (0.41) 2.13 (0.14) 0.11 (> 0.05) 0.08*
F1 0.04 (0.83) 0.94 (0.33) 21.83*** 0.51 (> 0.05) 0.12 (> 0.05)
P2 0.13 (0.70) 0.59 (0.44) 2.69 (0.10) 0.09* 0.09*
BC1 2.25 (0.13) 2.86 (0.09) 0.90 (0.34) 0.29 (> 0.05) 0.1 (> 0.05)
BC2 0.03 (0.84) 0.05 (0.81) 0.02 (0.86) 0.08* 0.06*
F2 0.08 (0.77) 0.56 (0.45) 3.66 (0.055) 0.16 (> 0.05) 0.07*
E-2
P1 0.02 (0.88) 0.04 (0.83) 1.96 (0.16) 0.09* 0.1 (> 0.05)
F1 0.90 (0.34) 0.06 (0.79) 22.18*** 0.6 (> 0.05) 0.15 (> 0.05)
P2 0.85 (0.35) 1.72 (0.18) 2.76 (0.09) 0.15 (> 0.05) 0.11 (> 0.05)
BC1 0.07 (0.77) 0.01 (0.90) 2.49 (0.11) 0.12 (> 0.05) 0.06*
BC2 0.84 (0.35) 0.71 (0.39) 0.03 (0.85) 0.13 (> 0.05) 0.07*
Table 6. Test for goodness of fit regarding area under disease progress curve (AUDPC) of models C, D, E, E-1 and B-1.
Cross-3: Parula × Blue silver Models Generations U1
2
U2 2
U3 2
nW2
Dn
E
P1 0.004 (0.94) 0.05 (0.81) 0.46 (0.49) 0.05* 0.08*
F1 0.001 (0.97) 0.28 (0.59) 5.15* 0.14 (> 0.05) 0.08*
P 2 0.001 (0.98) 0.52 (0.46) 8.99** 0.23 (> 0.05) 0.11 (> 0.05)
BC1 0.003 (0.95) 0.00 (0.98) 0.07 (0.78) 0.07* 0.07*
BC2 0.04 (0.83) 0.009 (0.92) 0.17 (0.67) 0.04* 0.04*
F2 0.02 (0.87) 0.01 (0.91) 1.10 (0.29) 0.07 (> 0.05) 0.04*
E-1
P1 0.007 (0.93) 0.002 (0.96) 0.24 (0.62) 0.04* 0.08*
F1 1.21 (0.27) 0.29 (0.58) 4.34* 0.22 (> 0.05) 0.1 (> 0.05)
P2 1.24 (0.26) 0.12 (0.72) 8.36** 0.33 (> 0.05) 0.15 (> 0.05)
BC1 0.14 (0.70) 0.16 (0.68) 0.03 (0.85) 0.09* 0.07*
BC2 6.38* 4.19* 2.53 (0.11) 0.71 (> 0.05) 0.11 (> 0.05)
F2 0.01 (0.92) 0.05 (0.81) 0.33 (0.56) 0.05* 0.04*
B-1
P1 0.008 (0.92) 0.03 (0.84) 0.17 (0.67) 0.04* 0.07*
F1 2.19 (0.13) 0.86 (0.35) 4.05* 0.3 (> 0.05) 0.11 (> 0.05)
P2 0.97 (0.32) 0.06 (0.79) 7.69** 0.29 (> 0.05) 0.14 (> 0.05)
BC1 0.09 (0.76) 0.28 (0.59) 0.95 (0.32) 0.14 (> 0.05) 0.08*
BC2 8.66** 6.79** 0.94 (0.33) 0.84 (> 0.05) 0.12 (> 0.05)
F2 0.30 (0.58) 0.21 (0.64) 0.07 (0.78) 0.13 (> 0.05) 0.06*
Cross-4: TD-1 × D-97603
Models Generations U1 2
U2 2
U3 2
nW2
Dn
E
P1 0.01 (0.91) 0.04 (0.82) 0.19 (0.65) 0.07* 0.09*
F1 0.002 (0.96) 0.85 (0.35) 12.52*** 0.34 (> 0.05) 0.12 (> 0.05)
P2 0.009 (0.92) 0.84 (0.35) 16.30*** 0.38 (> 0.05) 0.15 (> 0.05)
BC1 0.50 (0.47) 0.35 (0.54) 0.12 (0.72) 0.24 (> 0.05) 0.12 (> 0.05)
BC2 0.003 (0.95) 0.02 (0.86) 0.22 (0.63) 0.08* 0.05*
F2 0.61 (0.43) 0.24 (0.61) 1.08 (0.29) 0.12 (>0.05) 0.05*
E-1
P1 0.00 (0.99) 0.01 (0.91) 0.18 (0.66) 0.06* 0.09*
F1 0.01 (0.89) 1.02 (0.31) 12.50*** 0.34 (>0.05) 0.11 (>0.05)
P2 0.008 (0.92) 1.19 (0.27) 16.22*** 0.38 (>0.05) 0.14 (>0.05)
BC1 0.94 (0.33) 1.26 (0.26) 0.53 (0.46) 0.33 (>0.05) 0.13 (>0.05)
BC2 0.04 (0.82) 0.08 (0.77) 0.08 (0.77) 0.09* 0.05*
F2 0.88 (0.34) 0.33 (0.56) 1.74 (0.18) 0.17 (>0.05) 0.06*
D-1
P1 0.006 (0.93) 0.01 (0.89) 0.73 (0.39) 0.06* 0.08*
F1 0.001 (0.97) 0.21 (0.64) 3.07 (0.07) 0.15 (>0.05) 0.09*
P2 0.007 (0.93) 0.30 (0.58) 6.36* 0.2 (>0.05) 0.12 (>0.05)
BC1 0.13 (0.71) 0.64 (0.42) 3.27 (0.07) 0.37 (>0.05) 0.12 (>0.05)
BC2 0.28 (0.59) 0.77 (0.37) 2.14 (0.14) 0.3 (>0.05) 0.1 (>0.05)
F2 0.08 (0.76) 0.02 (0.86) 3.26 (0.07) 0.2 (>0.05) 0.06*
In above crosses, the maximum variation and heritability were shown by major genes than polygene. The heritability due to major genes was higher than polygene in various wheat populations (Khan et al., 2009a). The slow leaf rusting resistance heritability has been reported to be moderate to high in wheat (Bjarko & Line, 1988). In most of the wheat crosses, the broad and narrow-sense heritability were high while some crosses revealed moderate narrow-sense heritability (Zhang et al., 2001). Moderate to high heritability was reported for slow rusting resistance, and suggested selection of tolerant genotypes in early segregating generations against leaf rusting disease (Das, Rajaram, Mundt, & Kronstad, 1992; 2004). Positive values of dominant effects and additive × additive effect of the major genes plus polygene, and negative values of dominant ratios of major genes exhibited that contribution of major genes in controlling the AUDPC was maximum, however, was of epistatic nature with polygene. In various wheat crosses, the negative and positive signs of the additive as well as dominant effect due to major genes and polygene may occur due to
varied genetic background of the parental lines involved (Wang & Gai, 2001). However, additive × dominant negative effects also favor the epistasis of major genes and polygene. Higher phenotypic variation was observed in BC1, BC2 and F2 populations because the resistance was controlled by two major genes plus polygene. Leaf rust resistant genes were reported in 70 wheat cultivars and suggested 11 cultivars with adult-plant resistance genes (Singh et al., 2000). In adult-plant resistance of leaf rust in wheat, the leaf rust resistance gene Lr34 and two to three other effective genes were reported (Singh & Rajaram, 1993).
Acta Scientiarum. Agronomy Maringá, v. 38, n. 3, p. 317-328, July-Sept., 2016
of both the major genes were noted which revealed that AUDPC was under the influence of combined dominant effects of the major genes. The polygenic variance and heritability values for BC1, BC2 and F2
were equal to zero because no minor genes (polygene) were involved in controlling the said trait. Additive dominant as well as dominant × dominant epistasis for leaf rust have been reported in wheat crosses (Bjarko & Line,1988). In segregating generations for stripe rust resistance, the additive / modifying action of two genes was reported in a cross between susceptible and resistant cultivars of wheat (Imtiaz et al., 2003).
The two genes with additive effect were found to be responsible for stripe rust resistance in a cross between resistant and susceptible wheat parental lines (Ma, Singh, & Abdalla, 1997).
The AUDPC was controlled by mixed one major gene and additive dominant polygene in cross TD-1 × D-97603. A higher and positive value of additive component of polygene indicates that leaf rust resistance was mainly controlled by the favorable interaction of polygene found in both parents. Non-race specific resistance and slow rusting suggests that the stripe rust resistance was not controlled by a single major gene, but is inherited polygenically (Imtiaz et al., 2005). Additive effect with respect to stripe rust resistance has also been reported in wheat crosses (Ma et al., 1997). The involvement of epistasis with significant additive x additive component in controlling AUDPC for adult plant resistance has been reported in parental cultivars, F1, F2 and backcross populations in
wheat (Chen, Soria, Yan, Sun, & Dubcovsky, 2003).
Using generation mean analysis, Das et al. (2004) reported digenic epistasis with predominant additive gene effect for stripe rust resistance in different wheat crosses. Across the environments, eight QTL were detected for leaf rust resistance and ten QTL for the quantitative expression of leaf tip necrosis in various wheat cultivars, and at these loci, the alleles of cv. Forno increased the level of resistance as well as the extent of leaf tip necrosis, indicating pleiotropy (Messmer et al., 2000). In a genetic analysis for latent period of Puccinia recondita in wheat, four genes with unequal and epistatic effects controlled the latent period, whereas some findings revealed that at least five genes were found to be involved in the prolongation of the latent period (Shaner, Buechley, & Nyquist, 1997).
In segregating populations of all the crosses, the major gene heritability was higher than polygene showing that the leaf rust resistance was mainly under the control of major genes with a very small contribution of polygenes. Higher environmental variation was also observed in all the crosses indicating that the resistance to stripe rust was under greater influence of environmental fluctuations. Similar fluctuations due to environment for stripe rust resistance at adult plant stage were also reported (Das et al., 2004). The contradictions between the present and the previous findings might be because of the different statistical approaches i.e. diallel or generation mean analysis used to measure the genetic effect as the polygenic system and have no power to determine the effect of the individual major genes and aggregate effect of the polygene.
Table 7. Maximum likelihood estimates of component parameters regarding area under disease progress curve (AUDPC) in four wheat crosses in their respective best fit model.
Variables Hashim-08 × Lu-26 Farid-06 × Shafaq Parula × Blue Silver TD-1 × D-97603 Model Type: E Model Type : E-2 Model Type: B-1 Model Type: D-1
μ1 87.23 340.63 172.54 222.05
μ 2 110.02 349.68 214.16 253.28
μ 3 309.01 167.8 309.99 246.68
μ 41 73.16 437.68 172.54 160.84
μ 42 76.08 437.66 112.48 314.49
μ 43 209.96 252.65 331.54 -
μ 44 213.41 252.63 214.16 -
μ 51 145.97 354.7 214.16 210.54
μ 52 345.82 354.37 454.81 347.66
μ 53 345.82 163.12 548.93 -
μ 54 220.46 162.78 309.99 -
μ 61 63.12 488.72 172.54 90
μ 62 66.03 488.7 112.48 288.21
μ 63 82.32 488.37 105.32 513.31
μ 64 199.92 303.69 331.54 -
μ 65 203.35 303.66 214.16 -
μ 66 403.21 303.33 454.8 -
μ 67 82.32 112.1 406.96 -
μ 68 403.21 112.08 548.93 -
μ 69 277.84 111.75 309.99 -
Σ2 3961.21 11200.07 9417.97 8243.68
Σ42 3961.21 11200.07 9417.97 8243.68
Σ5
2
3961.21 11200.07 9417.97 8243.68
Σ6
Table 8. Estimates of first and second order genetic parameters for area under disease progress curve (AUDPC) in four wheat crosses.
Cross-1: Hashim-08 × LU-26 (model E)
First order parameter 2nd order parameter
BC1 BC2 F2
M1 150.51 ha 175.16 σp
2
8102.01 14641.8 20299.6
M2 33.06 hb 108.22 σmg
2 4699.10 7303.91 15578.80
M3 157.57 ha/da -3.26 σe2 3961.21 3961.21 3961.21
M4 136.45 hb/db -2.02 σpg
2 558.28 3376.63 759.60
M5 69.01 I 44.08 hmg
2(%) 58.00 49.88 76.74
M6 98.91 jab -114.91 hpg
2
(%) 6.89 23.06 3.74
da -53.68 jba -47.96 - - - -
db -53.68 L -206.43 - - - -
Cross-2: Farid-06 × Shafaq (model E-2)
First order parameter 2nd order parameter
BC1 BC2 F2
M 247.52 - - σp
2
15471.98 19126.62 33193.92
da 113.43 - - σmg
2 4271.9 7926.55 21993.85
db 0.18 - - σe
2
11200.07 11200.07 11200.07
ha 3.28 - - σpg
2 0.00 0.00 0.00
hb 0.16 - - hmg2(%) 27.61 41.44 66.26
[d] -102.07 - - hpg
2
(%) 0.00 0.00 0.00
[h] 92.04 - - -
Cross-3: Parula × Blue Silver (Model B-1)
First order parameter 2nd order parameter
BC1 BC2 F2
M 248.70 ha 191.53 σp2 14740.1 21620.9 28682.1
- hb 34.94 σmg
2 9658.4 20698.29 21655.67
- ha/da -1.74 σe
2 9417.97 9417.97 9417.97
- hb/db 0.85 σpg
2
0.00 0.00 0.00
- I -7.44 hmg
2(%) 65.52 95.73 75.50
- jab -61.39 hpg2(%) 0.00 0.00 0.00
da -109.77 jba -149.74 - - - -
db 41.05 L -261.08 - - - -
Cross-4: TD-1 × D-97603 (Model D-1)
First order parameter 2nd order parameter
- - - BC1 BC2 F2
M 249.10 - - σp
2
12939.37 12093.24 32906.28
D -189.57 - - σmg
2 4695.69 3849.56 24662.68
H -9.328 - - σe2 8243.68 8243.68 8243.69
[d] 167.54 - - σpg
2
0.00 0.00 0.00
[h] 42.98 - - hmg
2(%) 36.29 31.83 74.95
- - - hpg
2
(%) 0.00 0.00 0.00
Conclusion
In most of the crosses, mixed two additive-dominant-epistatic major genes with polygene controlled the AUDPC. A significantly larger portion of genetic variation and heritability could be attributed to genes with major effects rather than the polygene. However, the environmental variations could not be ignored as the stripe rust resistance was under influence of environmental fluctuations. The genetic behavior of AUDPC revealed that in all crosses the resistance to stripe rust was controlled by mixed interaction of one to two major genes plus polygene, and suggested the selection of resistant genotypes in early generation i.e. F2 ~ F3.
References
Akaike, H. (1977). On the Entropy Maximum Principle. In
P. R. Krishnaiah (Ed.), Applications of Statistics (p. 27-41).
Amsterdam, NL: North-Holland Publishing Company. Arama, P. F., Parlevliet, J. E., & Van-Silfhout, C. H.
(2000). Trangressive segregation for resistance in
wheat to Septoria tritici blotch. African Crop Science
Journal, 8(3), 213-222.
Bjarko, M. E., & Line, R. F. (1988). Heritability and
number of genes controlling leaf rust resistance in
four cultivars of wheat. Phytopathology, 78(4), 457-461.
Chen, X., Soria, M. A., Yan, G.; Sun, J., & Dubcovsky, J. (2003). Development of sequence tagged site and cleaved amplified polymorphic sequence markers for
wheat stripe rust resistance gene Yr5. Crop Science,
43(6), 2058-2064.
Das, M. K., Rajaram, S., Kronstad, W. E., Mundt, C. C., & Singh, R. P. (1993). Associations and genetics of three components of slow rusting resistance in leaf rust of
wheat. Euphytica, 68(1), 99-109.
Das, M. K., Rajaram, S., Mundt, C. C., & Kronstad, W. E. (1992). Inheritance of slow rusting resistance to leaf
rust in wheat. Crop Science, 32(6), 1452-1456.
Das, M. K., Rajaram, S., Mundt, C. C., & Kronstad, W. E. (2004). Number of genes controlling slow rusting resistance to leaf rust in five spring wheat cultivars.
Annals of Applied Biology, 145(1), 91-94.
Acta Scientiarum. Agronomy Maringá, v. 38, n. 3, p. 317-328, July-Sept., 2016
rust in winter wheat cultivars Aquileja and Xian Nong 4. Journal of Applied Genetics, 48(1), 43-46.
Gai, J., Wang, Y., Wu, X., & Chen, S. (2007). A comparative study on segregation analysis and QTL mapping of quantitative traits in plants with a case in
soybean. Frontiers of Agriculture in China, 1(1), 1-7.
Gai, J. Y., & Wang, J. K. (1998). Identification and
estimation of QTL model and its effects. Theoretical
and Applied Genetics, 97(7), 1162-1168.
Gai, J. Y., Zhang, Y., & Wang, J. (2003). Mixed genetic model for two major genes plus multi-genes in genetic system of quantitative traits in plants (p. 277-285). Beijing, YAN: Science press.
Ghaledozdani, H. (2005). Variability of Puccinia striiformis
in Iran. In Procedings of the 2nd Asian Conference on Plant
Pathology (p. 64). Singapore: National University of Singapore.
Imtiaz, M., Cromey, M. G., Hampton, J. G., & Ahmad, M. (2003). Inheritance of durable adult plant
resistance to stripe rust (P. striiformis f. sp. tritici) in
‘Otane’ wheat (T. aestivum L.). New Zealand Journal of
Crop and Horticultural Science, 31(1), 23-31.
Imtiaz, M., Cromey, M. G., Hampton, J. G., & Ogbonnaya, F. C. (2005). Genetics of stripe rust
resistance in ‘Karamu’ wheat. Australian Journal
Agricultural Research, 56(6), 619-624.
Khan, M. I., Ajab, M., Hongxiang, M., & Khattak, G. S. S. (2009a). Assessment of genes controlling area under
disease progress curve (AUDPC) for stripe rust (P.
striiformis f. sp. tritici) in two wheat (T. aestivum L.)
crosses. Cytology and Genetics, 43(4), 25-38.
Khan, M. I., Ajab, M., Khattak, G. S. S., Mohammad, T., & Shah, S. J. A. (2009b). Genetic behavior of controlling area under disease progress curve for stripe
rust (Puccinia striiformis f. sp. tritici) in two wheat (T.
aestivum L.) crosses. Phytopathology, 99(11), 1265-1272. Ma, H., & Singh, R. P. (1996). Expression of adult
resistance to stripe rust at different growth stages of
wheat. Plant Disease, 80(4), 375-379.
Ma, H., Singh, R. P., & Abdalla, O. (1997). Resistance to
stripe rust in five durum wheat cultivars. Plant Disease,
81(1), 27-30.
Mamluk, O. F. (1992). Durum wheat diseases in West Asia and North Africa (WANA). In S. Rajaram, E. E. Sarri, G.
P. Hettel (Ed.), Durum wheats: challenges and opportunities
(9th ed., p. 89-106). Mexico: CIMMYT Wheat Special Report.
Mather, K.; Jinks, J. L. (1982). Biometrical Genetics (2nd
ed.). London, UK: Chapman and Hall Ltd.
Messmer, M. M., Seyfarth, R., Keller, M., Schachermayr, G., Winzeler, M., Zanetti, S., ... Keller, B. (2000). Genetic analysis of durable leaf rust resistance in
winter wheat. Theoretical and Applied Genetics, 100(3),
419-431.
Peterson, R. F., Campbell, A. B., & Hannah, A. E. (1948). A diagnostic scale for estimating rust intensity on
leaves and stems of cereals. Canadian Journal of Research,
26(5), 496-500.
Shaner, G., Buechley, G., & Nyquist, W. E. (1997).
Inheritance of latent period of Puccinia recondita in
wheat. Crop Science, 37(3), 748-756.
Singh, A., Knox, R. F., Depauw, R. M., Singh, R. K., Cuthbert, R. D., Campbell, H. L., ... Bhavani, S. (2014). Stripe rust and leaf rust resistance QTL mapping, epistatic interactions, and co-localization with stem rust resistance loci in spring wheat
evaluated over three continents. Theoretical and Applied
Genetics, 127(11), 2465-2477.
Singh, R. P. (1992). Genetic association of leaf rust
resistance gene Lr34 with adult plant resistance to
stripe rust in bread wheat. Phytopathology, 82(8),
835-838.
Singh, R. P., Nelson, J. C., & Sorrells, M. E. (2000).
Mapping Yr28 and other genes for resistance to stripe
rust in wheat. Crop Science, 40(4), 1148-1155.
Singh, R. P., & Rajaram, S. (1991). Resistance to Puccinia
recondita f. sp. tritici in 50 Mexican bread wheat
cultivars. Crop Science, 31(6), 1472-1479.
Singh, R. P., & Rajaram, S. (1993). Genetics of adult plant resistance to stripe rust in ten spring bread wheats.
Euphytica, 72(1), 1-7.
Suenaga, K., Singh, R. P., Haurta-Espino, J., & William, H. M. (2003). Microsatellite markers for genes
Lr34/Yr18 and other quantitative trait loci for leaf rust and stripe rust resistance in bread wheat.
Phytopathology, 93(7), 881-890.
Ullah, K., Khan, N. U., Khan, S. J., Khan, I. U., Khan, M. I., Khan, R. U., & Gul, S. (2014a). Genetic analysis for grain filling duration in wheat using joint segregation
analysis. Turkish Journal of Agriculture and Forestry, 38(6),
807-819.
Ullah, K., Khan, N. U., Khan, S. J., Khan, M. I., Khan, I. U., Gul, S., ... Khan, R. U. (2014b). Cell membrane thermo-stability studies through joint segregation
analysis in various wheat populations. Pakistan Journal
of Botany, 46(6), 1243-1252.
Wang, J., & Gai, J. (1997). Identification of major gene and polygene mixed inheritance model and estimation of
genetic parameters of a quantitative trait from F2
progeny. Acta Genetica Sinica, 24(5), 432-440.
Wang, J., & Gai, J. (2001). Mixed inheritance model for
resistance to agromyzid beanfly (Melanagromyza sojae
Zehntner) in soybean. Euphytica, 122(1), 9-18.
Wang, J., Podlich, D. W., Cooper, M., & Delacy, I. H. (2001). Power of the joint segregation analysis method for testing mixed major-gene and polygene inheritance
models of quantitative traits. Theoretical and Applied
Genetics, 103(5), 804-816.
William, M., Singh, R. P., Huerta-Espino, J., & Ortiz, I. S., Hoisington, D. (2003). Molecular marker mapping of leaf rust resistance gene Lr46 and its association
with stripe rust resistance gene Yr29 in wheat.
Phytopathology, 93(2), 153-159.
Puccinia striiformis on wheat in Syria and Lebanon. .
Plant Disease, 86(5), 499-504.
Zadoks, J. C., Chang, T. T., & Konzak, C. F. (1974). A
decimal code for the growth stages of cereals. Weed
Research, 14(6), 415-421.
Zhang, Y. M., Gai, J. Y., & Yang, Y. H. (2003). The EIM algorithm in the joint segregation analysis of
quantitative traits. Genetics Research, 81(2), 157-163.
Zhang, Z. J., Yang, G. H., Li, G. H., Jin, S. L., & Yang, X. B. (2001). Transgressive segregation, heritability, and
number of genes controlling durable resistance to stripe rust in one Chinese and two Italian wheat
cultivars. Phytopathology, 91(7), 680-686.
Received on June 30, 2015. Accepted on September 8, 2015.