Molecular characterization of ‘sweet’ cassavas (
Manihot esculenta
)
from a germplasm bank in Brazilian Eastern Amazonia
Elisa Ferreira Moura Cunha1, Carlos Rogério de Sousa Silva2, Paulo Sérgio Bevilaqua de Albuquerque2, Girena Fernandes Ramalho3, Lígia Cristine Gonçalves Pontes3 and João Tomé de Farias Neto1
Received 12 February 2015 Accepted 28 September 2015
Abstract – Genetic variability of a set of 81 accessions of ‘sweet’ cassavas (Manihot esculenta) collected mostly in the North region of Brazil was investigated with nine microsatellite loci. All loci were polymorphic, with mean of 6.33 alleles per locus. Analyses
indicated that 35 multiloci profiles were represented by a single accession, and 46 showed non-unique profiles, represented by eleven genotypes. Forty-six different multiloci profiles were detected. Most of the putative duplicated accessions were collected in different locations. After the removal of putative duplicated genotypes, genetic parameters were estimated and expected heterozygosity was
high (HE=0.73), indicating genetic variability. Structure analysis of this set of ‘sweet’ cassavas divided the 46 genotypes into two
clusters (K=2), and a few genotypes had mixed ancestry. Results indicated the habit of exchange of materials among farmers of the North region of Brazil, and the genetic variability to be exploited in genetic breeding efforts.
Key words: Genetic resources, microsatellite markers, Euphorbiaceae, duplicates.
Crop Breeding and Applied Biotechnology 16: 28-34, 2016 Brazilian Society of Plant Breeding. Printed in Brazil
ARTICLE
http://dx.doi.org/10.1590/1984-70332016v16n1a5
1 Embrapa Amazônia Oriental, Trav. Dr. Enéas Pinheiro, s/n, 66.095-903, Belém, PA, Brazil
2 Comissão Executiva do Plano da Lavoura Cacaueira, ERJOH , BR-316, km 17, 67.200-000, Marituba, PA, Brazil
3 Universidade Federal do Pará, Instituto de Ciências Biológicas, Rua Augusto Corrêa, 01, Guamá, 66.075-110, Belém, PA, Brazil
INTRODUCTION
Cassava (Manihot esculenta Crantz) is usually classified into two categories: ‘sweet’ and ‘bitter’. This division is based on cyanogenic glycosides content on the roots. ‘Sweet’ cassava has low cyanogenic glycoside content (below 100 ppm fresh weight), while ‘bitter’ cassava has higher amounts (above 100 ppm fresh weight) (McKey et al. 2010). Roots of bitter cassava must be properly cooked or efficiently processed to detoxify it before consumption. It is normally used to generate starch and to produce flour. ‘Sweet’ cassavas, known as ‘macaxeiras’ in the Amazon, are commonly eaten after simple processes, such as boiling and cooking. ‘Sweet’ cassavas are consumed in many ways: in cakes, soups, fried, boiled, or as substitutes for potatoes. Since ‘sweet’ cassavas are used to obtain different products in comparison to ‘bitter’ type cassavas, farmers tend to select and maintain genotypes according to specific parameters, such as taste and fast cooking. They also harvest ‘sweet’ cassavas earlier than ‘bitter’ types, in order to avoid formation of fibers, due to root lignification. Maybe this different type of selection, and the separation that farmers
promote in their farms have contributed to generate a slight genetic differentiation detected by molecular markers in South America (Mühlen et al. 2000, Elias et al. 2004, Peroni et al. 2007, Alves-Pereira et al. 2011, Bradbury et al. 2013), which did not occur in Africa (Bradbury et al. 2013). Due to these differences in usage, ‘sweet’ and ‘bitter’ cassava genetic breeding programs are specific for each type (Fukuda et al. 2002, Ceballos et al. 2004).
to reduce the bank size, which improves its management and reduces costs.
Although there is much information regarding the genetic diversity of cassava, most of them are about samples from Africa (Mkumbira et al. 2003, Moyib et al. 2007), from the Southeast of Brazil (Siqueira et al. 2010, Ribeiro et al. 2011, Costa et al. 2013), or from West of Amazonia (Mühlen et al. 2000, Elias et al. 2004, Siqueira et al. 2009, Alves-Pereira et al. 2011). Pará is the main producer of cassava in Brazil, and its population maintains old habits of cassava use inherited from the indigenous people, such as the use of cassava leaves and starch to produce regional foods. However, there are no studies regarding genetic diversity of cassava sampled in this state. Thus, the aim of this study was to evaluate the genetic diversity of sweet cassavas kept in a germplasm bank of the state of Pará, using microsatellite markers.
MATERIAL AND METHODS
A total of 81 accessions identified as ‘sweet’ cassava that belong to the cassava germplasm bank of Embrapa Eastern Amazon, in Belém-Pará, Brazil, were used in this study (Table 1). Each accession represents a clonal landrace, and the germplasm bank is maintained by vegetative propagation. The names given by local farmers remained for each landrace. Collections were carried out mostly in the state of Pará (Table 1). Analyses carried out in the institution confirmed the low content of HCN for accessions identified as ‘sweet’ cassavas. Total genomic DNA was extracted according to procedure similar to the Doyle and Doyle protocol (1990). Leaves were macerated with liquid nitrogen and polyvinylpyrrolidone, and 3 ml CTAB extraction buffer (CTAB 2%, 5 M NaCl, 0.5 M EDTA, PVP, 1 M Tris-HCl and sterilized water) was added to the macerate. Then, it was homogenized and incubated in water bath at 65 oC for
one hour. Chlorophorm:isoamylic alcohol (24:1) was added, and then, the extract was homogenized, and samples were centrifuged for 10 minutes at 10,000 rpm. Three ml of 95% ethylic alcohol was added to the supernatant to precipitate the DNA, and samples were centrifuged for 10 minutes at 10,000 rpm. After that phase, the precipitate was washed with 70% ethylic alcohol, for 10 minutes, at 5,000 rpm. DNA samples were resuspended with 300 mL TE buffer (10 mM Tris-HCl, 1 mM EDTA, pH 8.0) and RNAse. DNA was quantified on 1% agarose gel, using lambda phage DNA at different concentrations (50, 100 and 200 ng mL-1) as
standard. Then, DNA was diluted to 10 ng µL-1.
Accessions were genotyped with nine microsatellite loci (Table 2): SSRY 04, SSRY09, SSRY164, SSRY19, SSRY
20, SSRY21, developed by Mba et al. (2001); and GA126, GA131 and GA136, developed by Chavarriaga-Aguirre et al. (1998).
The amplification reactions contained 15 ng of DNA, 100 μM of each dNTP, 0.2 μM of each primer and 1 U Taq polymerase (Invitrogen, São Paulo, Brazil) in 1X PCR buffer (50 mM KCl; 10 mM Tris-HCl, pH 8.8, 0.1% Triton X-100; 1.5 mM MgCl2) in a total volume of 13 μL. Amplifications were carried out using a GeneAmp 9600 thermocycler (Applied Biosystems, Foster City, CA, USA), with the following program: an initial cycle of 94 °C for 4 min; followed by 30 cycles of 94 °C for 30 s; 60 s at appropriate annealing temperature for each primer (Table 2), and extension at 72 °C, for 60 s (Lanaud et al. 1999). Primer-tail approach was used (Oetting et al. 1995). Sequences of the human microsatellites D12S1090, D8S1132 and DYS437 forward primers were used as tails according to Missiaggia and Grattapaglia (2006), with modifications. Primer T3 sequencing was labeled with fluorescent dye PET.
PCRs were carried out independently, and the genotyping, when possible, was multiplexed using an aliquot of 1 mL of each reaction from the same genotype. The total PCR volumes were mixed with Hi-Di formamide (Applied Biosystems) and 0.5 ml of the marker of molecular size Liz-500 (Applied Biosystems), at 8 nM. This allowed the genotyping in multiplexed systems in the DNA sequencer ABI PRISM 3130 (Applied Biosystems, Foster City, CA, USA). Data collection and analysis were carried out using GeneMapper v.4.0 software (Applied Biosystems, USA).
Before analysis of genetic diversity, the genotypes with identical multiloci profiles were identified. The probability of identity, which is the probability that two individuals sampled at random share the same genotype, was measured according to Paetkau and Strobeck (1994), based on allelic frequencies obtained for all accessions. Analyses were carried out using the Identity 1.0 software (Wagner and Sefc 1999).
For the construction of the dendrogram, bands were analyzed as presence (1) and absence (0) for the 46 accessions. These data were used to construct a dendrogram based on the Unweighted Pair Group Method with Arithmetic Mean (UPGMA, Sneath and Sokal 1973), using the Jaccard similarity index. A bootstrap resampling method was carried out to determine the robustness of the dendrogram, and 1,000
bootstrap replicates were obtained from the original data of 46 accessions. All calculations were carried out using the Past software (Hammer et al. 2001).
Assignment of genotypes to clusters and relatedness among clusters were assessed with the Structure 2.3.3 software (Pritchard et al. 2000). The non-admixture model and the independent alleles model without prior population
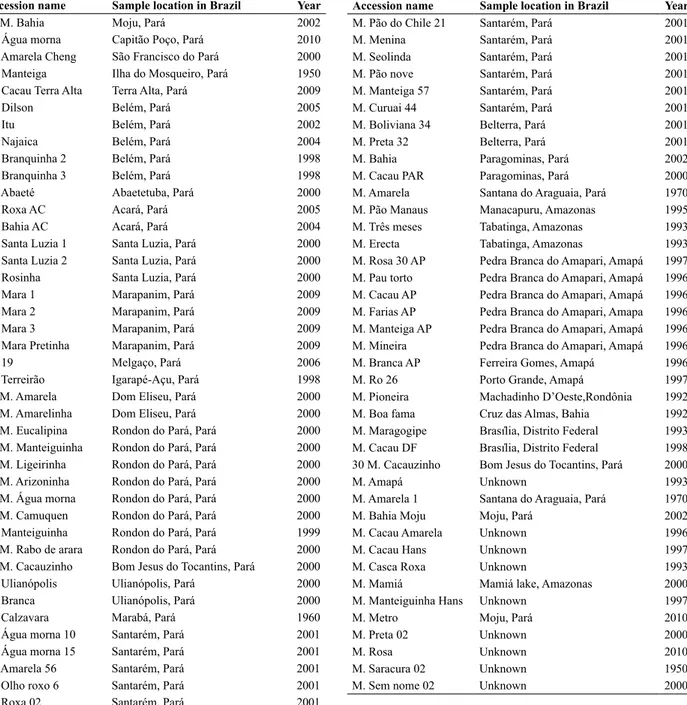
Table 1. Name, code and year of sample of accessions of cassava (Manihot esculenta) in a germplasm bank of Eastern Amazon, Brazil. M. is a codi-fication for sweet cassavas (as for ‘macaxeiras’)
Accession name Sample location in Brazil Year
05 M. Bahia Moju, Pará 2002
M. Água morna Capitão Poço, Pará 2010
M. Amarela Cheng São Francisco do Pará 2000
M. Manteiga Ilha do Mosqueiro, Pará 1950
M. Cacau Terra Alta Terra Alta, Pará 2009
M. Dilson Belém, Pará 2005
M. Itu Belém, Pará 2002
M. Najaica Belém, Pará 2004
M. Branquinha 2 Belém, Pará 1998
M. Branquinha 3 Belém, Pará 1998
M. Abaeté Abaetetuba, Pará 2000
M. Roxa AC Acará, Pará 2005
M. Bahia AC Acará, Pará 2004
M. Santa Luzia 1 Santa Luzia, Pará 2000
M. Santa Luzia 2 Santa Luzia, Pará 2000
M. Rosinha Santa Luzia, Pará 2000
M. Mara 1 Marapanim, Pará 2009
M. Mara 2 Marapanim, Pará 2009
M. Mara 3 Marapanim, Pará 2009
M. Mara Pretinha Marapanim, Pará 2009
M. 19 Melgaço, Pará 2006
M. Terreirão Igarapé-Açu, Pará 1998
14 M. Amarela Dom Eliseu, Pará 2000
20 M. Amarelinha Dom Eliseu, Pará 2000
23 M. Eucalipina Rondon do Pará, Pará 2000 43 M. Manteiguinha Rondon do Pará, Pará 2000 46 M. Ligeirinha Rondon do Pará, Pará 2000 31 M. Arizoninha Rondon do Pará, Pará 2000 33 M. Água morna Rondon do Pará, Pará 2000
47 M. Camuquen Rondon do Pará, Pará 2000
M. Manteiguinha Rondon do Pará, Pará 1999 49 M. Rabo de arara Rondon do Pará, Pará 2000 40 M. Cacauzinho Bom Jesus do Tocantins, Pará 2000
M. Ulianópolis Ulianópolis, Pará 2000
M. Branca Ulianópolis, Pará 2000
M. Calzavara Marabá, Pará 1960
M. Água morna 10 Santarém, Pará 2001
M. Água morna 15 Santarém, Pará 2001
M. Amarela 56 Santarém, Pará 2001
M. Olho roxo 6 Santarém, Pará 2001
M. Roxa 02 Santarém, Pará 2001
Accession name Sample location in Brazil Year
M. Pão do Chile 21 Santarém, Pará 2001
M. Menina Santarém, Pará 2001
M. Seolinda Santarém, Pará 2001
M. Pão nove Santarém, Pará 2001
M. Manteiga 57 Santarém, Pará 2001
M. Curuai 44 Santarém, Pará 2001
M. Boliviana 34 Belterra, Pará 2001
M. Preta 32 Belterra, Pará 2001
M. Bahia Paragominas, Pará 2002
M. Cacau PAR Paragominas, Pará 2000
M. Amarela Santana do Araguaia, Pará 1970
M. Pão Manaus Manacapuru, Amazonas 1995
M. Três meses Tabatinga, Amazonas 1993
M. Erecta Tabatinga, Amazonas 1993
M. Rosa 30 AP Pedra Branca do Amapari, Amapá 1997 M. Pau torto Pedra Branca do Amapari, Amapá 1996 M. Cacau AP Pedra Branca do Amapari, Amapá 1996 M. Farias AP Pedra Branca do Amapari, Amapa 1996 M. Manteiga AP Pedra Branca do Amapari, Amapá 1996 M. Mineira Pedra Branca do Amapari, Amapá 1996
M. Branca AP Ferreira Gomes, Amapá 1996
M. Ro 26 Porto Grande, Amapá 1997
M. Pioneira Machadinho D’Oeste,Rondônia 1992
M. Boa fama Cruz das Almas, Bahia 1992
M. Maragogipe Brasília, Distrito Federal 1993 M. Cacau DF Brasília, Distrito Federal 1998 30 M. Cacauzinho Bom Jesus do Tocantins, Pará 2000
M. Amapá Unknown 1993
M. Amarela 1 Santana do Araguaia, Pará 1970
M. Bahia Moju Moju, Pará 2002
M. Cacau Amarela Unknown 1996
M. Cacau Hans Unknown 1997
M. Casca Roxa Unknown 1993
M. Mamiá Mamiá lake, Amazonas 2000
M. Manteiguinha Hans Unknown 1997
M. Metro Moju, Pará 2010
M. Preta 02 Unknown 2000
M. Rosa Unknown 2010
M. Saracura 02 Unknown 1950
information were used. Following a burn-in period of 250,000, 10 independent runs were carried out for each value of K (from 1 to 10), with 250,000 replications. The true value of K (∆K) was chosen according to Evanno et al. (2005).
RESULTS AND DISCUSSION
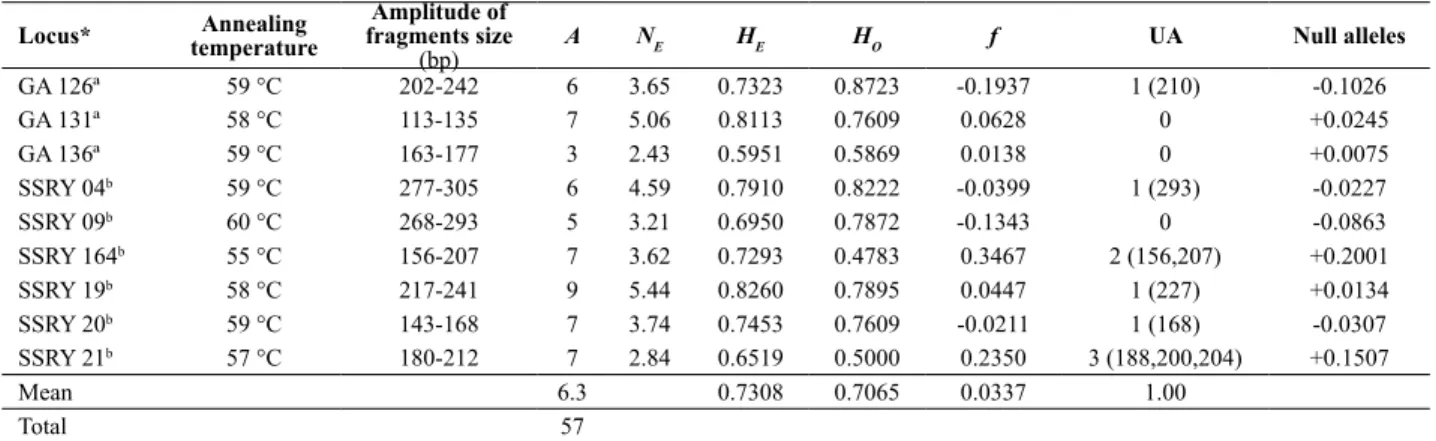
The nine loci amplified 57 alleles for 81 sweet cassava accessions, with a mean of 6.33 alleles per loci (Table 2). All loci were polymorphic. There was variation of three (GA136) to nine alleles (SSRY19). The genotyping revealed that 35 multiloci profiles were represented by a single accession, and 46 showed non-unique profiles distributed in eleven groups of genotypes. Forty-six different multiloci profiles were detected. The most common genotype was detected in nine accessions, while five genotypes were detected in only two accessions (Table 3). Although the number of microsatellite loci did not represent a high portion of cassava genome, the probability of identity, i.e, that these genotypes were identical by chance, was of 9.3 x 10⁻⁹,
which indicates that they were informative. The accessions that presented the same multiloci profile were considered putative duplicates. It is possible that using a larger number of molecular markers, the putative duplicates separate, but they will represent very related genotypes, which can be grouped in the germplasm bank.
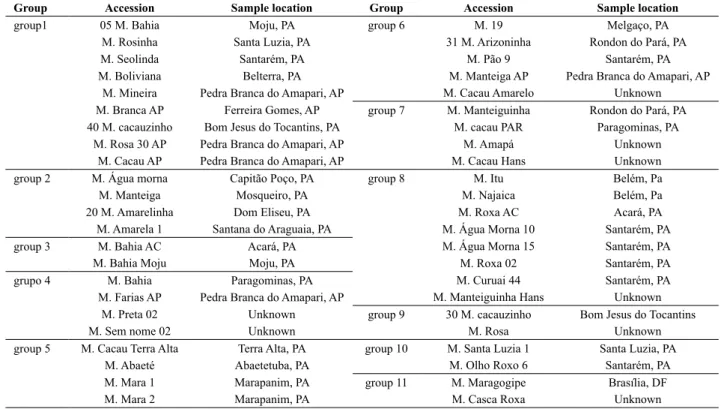
Most of these putative duplicated accessions were collected in the Northern region of Brazil, more specifically in the state of Pará, located in the Eastern Amazonia, and many were sampled in different locations (Table 3). As an example, accessions from group 1 were sampled in Moju, Santa Luzia, Belterra and Santarém, in the state of Pará;
and in Pedra Branca do Amapari, in the state of Amapá. In this last municipality, the same genotype was sampled three times, with three different names. Collections were mainly carried out in farms, where genotypes are cultivated and propagated. The occurrence of closely related genotypes in distant locations may be an indicative that this genotype is very productive or have a distinct characteristic that is appreciated by farmers. The occurrence of duplicates over distinct locations has been described in Amazonia. Identical genotypes for landraces with different names were identified in a small extension of the Madeira River, in the state of Amazonas, Brazil (Alves-Pereira et al. 2011). After extensive agromorphological characterization, it should be decided if duplicated accessions will be discarded or treated as groups. However, this analysis was useful for the selection of genotypes that are being tested for recommendation in several locations in Pará.
After the removal of accessions with the same multiloci profile, the size of sample was reduced to 46 genotypes, and genetic diversity parameters were estimated (Table 2). Total HE was 0.73, and the variation per locus was 0.82 (SSRY19) to 0.59 (GA136). Total HO was 0.71, with variation of 0.87 (GA126) to 0.48 (SSRY164). The inbreeding coefficient was 0.03, and loci SSRY 164 and SSRY 21 showed high levels. These high heterozygote deficits in the two loci may be due to null alleles detection, as shown in Table 3. Nine unique alleles (the ones that appear in only one genotype), were identified (Table 3). Locus SSRY21 showed the highest number of private alleles (three), and genotypes M. Branquinha 2 and M. Boa Fama had two private alleles each. HE value was high, and the occurrence of private alleles is an indicative of genetic divergence. This value
Table 2. Information on nine microsatellite loci used in the analysis of genetic diversity of a set of 46 accessions of ‘sweet’ cassava (Manihot esculenta) from a germplam bank of Eastern Amazon, Brazil. Table indicates annealing temperature and amplitude of fragments size in base pairs, and the esti-mates of genetic parameters, where A is the total number of alleles; NE is the effective number of alleles per locus; HE is the expected heterozygosity;
HO is the observed heterozygosity; f is the inbreeding coefficient, and UA is the number of unique alleles
Locus* temperatureAnnealing
Amplitude of fragments size
(bp)
A NE HE HO f UA Null alleles
GA 126ª 59 °C 202-242 6 3.65 0.7323 0.8723 -0.1937 1 (210) -0.1026
GA 131ª 58 °C 113-135 7 5.06 0.8113 0.7609 0.0628 0 +0.0245
GA 136ª 59 °C 163-177 3 2.43 0.5951 0.5869 0.0138 0 +0.0075
SSRY 04b 59 °C 277-305 6 4.59 0.7910 0.8222 -0.0399 1 (293) -0.0227
SSRY 09b 60 °C 268-293 5 3.21 0.6950 0.7872 -0.1343 0 -0.0863
SSRY 164b 55 °C 156-207 7 3.62 0.7293 0.4783 0.3467 2 (156,207) +0.2001
SSRY 19b 58 °C 217-241 9 5.44 0.8260 0.7895 0.0447 1 (227) +0.0134
SSRY 20b 59 °C 143-168 7 3.74 0.7453 0.7609 -0.0211 1 (168) -0.0307
SSRY 21b 57 °C 180-212 7 2.84 0.6519 0.5000 0.2350 3 (188,200,204) +0.1507
Mean 6.3 0.7308 0.7065 0.0337 1.00
Total 57
(0.73) was higher than HE obtained in other studies with samples of ‘sweet’ cassava, including samples from the state of Amazonas, in the Brazilian Amazon (Elias et al. 2004, Peroni et al. 2007, Alves-Pereira et al. 2011) and other regions of Brazil (Siqueira et al. 2010, Costa et al. 2013). The habit of consumption of ‘sweet’ cassava in the North region of Brazil may have influenced their maintenance by local breeders. Although most of cassava production in Pará is destined for flour, farmers maintain the tradition of cultivating ‘sweet’ cassava for their personal consumption, in the production of several meals (Cardoso et al. 1999, Carvalho et al. 2010) and for commercialization at a lower scale. The commercialization of ‘sweet’ cassava in Pará occurs mainly by selling fresh roots in markets and farmer’s markets. There are few associations in Pará that commercialize minimally processed ‘sweet’ cassava roots, and some of them process roots for chips (Carvalho et al. 2010). In the North region, there is little adoption of advanced methods of culture, such as mechanized planting and use of erect cultivars in dense plantations, more commonly used in the Southeast region of Brazil. Moreover, plantations are composed of a mixture of landraces, and generally, farmers from each micro region use their preferred materials, which may be an effect of the high genotype x environment interaction detected for cassava
(Farias-Neto et al. 2013). This may have contributed for the high genetic variability detected in the germplasm bank. The hypothesis of high genetic variability maintained in places that adopt few agricultural traits has been mentioned (Emperaire and Peroni 2007). A study on ‘sweet’ cassava sampled in the State of Paraná, Brazil, where advanced methods of culture are well adopted, showed lower genetic variability (Costa et al. 2013).
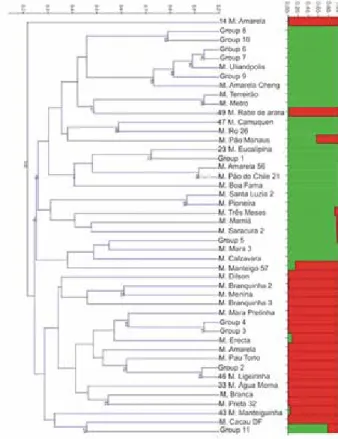
Strong genetic relationships could be detected among genotypes based on bootstrap (Figure 1). The number of genetic clusters (K) was calculated as two by the method proposed by Evanno et al. (2005), based on calculations generated by the Structure 2.3.3 software. In general, the dendrogram separated the genotypes into two clusters, as revealed by Structure. Accessions were sampled in farms, and have been kept by farmers, which may have influenced the non-structuring according to geographic region. The high incidence of duplicates is an indicative of exchanges among farmers from different locations, which may have contributed to the lack of structuring of genetic variability according to geographic areas of samples. There was no clustering among genotypes from the same city, or even from the same state. The same was observed by Vieira et al. (2010) and Vieira et al. (2011), who analyzed ‘sweet’
Table 3. Groups of accessions of ‘sweet’ cassavas (Manihot esculenta) from a germplam bank of Eastern Amazon, Brazil, with the same microsatellite multiloci profile, measured with nine loci
Group Accession Sample location Group Accession Sample location
group1 05 M. Bahia Moju, PA group 6 M. 19 Melgaço, PA
M. Rosinha Santa Luzia, PA 31 M. Arizoninha Rondon do Pará, PA
M. Seolinda Santarém, PA M. Pão 9 Santarém, PA
M. Boliviana Belterra, PA M. Manteiga AP Pedra Branca do Amapari, AP
M. Mineira Pedra Branca do Amapari, AP M. Cacau Amarelo Unknown
M. Branca AP Ferreira Gomes, AP group 7 M. Manteiguinha Rondon do Pará, PA
40 M. cacauzinho Bom Jesus do Tocantins, PA M. cacau PAR Paragominas, PA
M. Rosa 30 AP Pedra Branca do Amapari, AP M. Amapá Unknown
M. Cacau AP Pedra Branca do Amapari, AP M. Cacau Hans Unknown
group 2 M. Água morna Capitão Poço, PA group 8 M. Itu Belém, Pa
M. Manteiga Mosqueiro, PA M. Najaica Belém, Pa
20 M. Amarelinha Dom Eliseu, PA M. Roxa AC Acará, PA
M. Amarela 1 Santana do Araguaia, PA M. Água Morna 10 Santarém, PA
group 3 M. Bahia AC Acará, PA M. Água Morna 15 Santarém, PA
M. Bahia Moju Moju, PA M. Roxa 02 Santarém, PA
grupo 4 M. Bahia Paragominas, PA M. Curuai 44 Santarém, PA
M. Farias AP Pedra Branca do Amapari, AP M. Manteiguinha Hans Unknown
M. Preta 02 Unknown group 9 30 M. cacauzinho Bom Jesus do Tocantins
M. Sem nome 02 Unknown M. Rosa Unknown
group 5 M. Cacau Terra Alta Terra Alta, PA group 10 M. Santa Luzia 1 Santa Luzia, PA
M. Abaeté Abaetetuba, PA M. Olho Roxo 6 Santarém, PA
M. Mara 1 Marapanim, PA group 11 M. Maragogipe Brasília, DF
cassava samples from Brazilian Cerrado with RAPD markers. Cassava samples from Brazilian Cerrado and from the South of Brazil are also divided into two clusters by the Bayesian method (Siqueira et al. 2010, Siqueira et
al. 2011, Costa et al. 2013).
For all the genotypes, except for 2 of them, the overall membership proportion (Q) was at least 80%, indicating a clear destination of genotypes into two clusters that did not separate according to geographic area (Figure 1). Accessions M. Pão Manaus and group 11 of accessions (Table 3) had Q higher than 20%. Most of the putative duplicated accessions were sampled in different places of Northern Brazil. Thus, clusters generated by Structure could not be associated to geographical area. Further studies are needed to try to correlate clusters with agromorphological characters, and verify if they represent heterotic groups, since the assignment of genotypes to heterotic groups is one of the goals of the use of molecular markers in cassava breeding (Ferguson et al. 2012). However, bootstrap values of some clusters in the dendrogram revealed the most related accessions from the germplasm bank (Figure 1), and crossings among accessions from these clusters must be avoided.
The obtained results showed the existence of genetic variability of a sample of ‘sweet’ cassavas from the North region of Brazil. Samples were carried out mostly in the Eastern portion of Brazilian Amazonia, and genetic variability of cassavas from this region has not been extensively evaluated. Knowledge about the genetic composition of samples of cassava near its center of domestication is very important, since this knowledge may interest genetic breeders from several parts of the world. The study also showed a high occurrence of putative duplicated accessions in the germplasm bank, as the result of genotypes spread in an extensive area.
ACKNOWLEDGMENTS
The authors thank FAPESPA, CNPq and Embrapa for financial support and scholarship grants, and CEPLAC, for the use of the genetic analyzer.
Figure 1. Clustering analysis of 46 genotypes identified for sweet cassava accessions sampled in the North region of Brazil, based on nine microsatel-lite loci. The dendrogram was generated using UPGMA method based on Jaccard genetic similarities. Numbers in cluster represent bootstrap values based on 1000 permutations. The structuring in columns was generated by Structure software and the method of Evanno et al. (2005) determined
K = 2. The proportions of colors in the columns represent ancestry of each genotype.
REFERENCES
Alves-Pereira A, Peroni N, Abreu AG, Gribel R and Clement CR (2011) Genetic structure of traditional varieties of bitter manioc in three soils in Central Amazonia. Genetica 139: 1259-1271.
Bradbury EJ, Duputié A, Delêtre M, Roullier C, Narváez-Trujillo A, Manu-Aduening JA, Emshwiller E and McKey D (2013) Geographic differences in patterns of genetic differentiation among bitter and sweet manioc (Manihot esculenta subesp. esculenta; Euphorbiaceae). American Journal of Botany 100: 1-10.
Cardoso EMR, Hühn S and Nascimento Júnior JDB (1999) Processo industrial para beneficiamento da macaxeira. Novos Cadernos NAEA 2: 177-184.
Carvalho AV, Seccadio LL and Ferreira TF (2010) Obtenção e avaliação
físico-química e sensorial de “chips” de mandioca submetidos a pré-tratamentos. Amazonian Journal of Agricultural and Environmental Sciences 53: 182-187.
Ceballos H, Iglesias CA, Pérez JC and Dixon AGO (2004) Cassava breeding: opportunities and challenges. Plant Molecular Biology 56: 503-516.
Chavarriaga-Aguirre PP, Maya MM, Bonierbale MW, Kresovich S, Fregene MA, Tohme J and Kochert G (1998) Microsatellites in cassava (Manihot esculenta Crantz): discovery, inheritance and variability. Theoretical and Applied Genetics 97: 493-501.
12: 1040-1048.
Doyle JJ and Doyle JL (1990) Isolation of plant DNA from fresh tissue. Focus 12: 13-15.
Elias M, Muhlen GS, McKey D, Roa AC and Tohme J (2004) Genetic diversity of traditional South American landraces of cassava (Manihot
esculenta Crantz): an analysis using microsatellites. Economic Botany 58: 242-256.
Emperaire L and Peroni N (2007) Traditional management of agrobiodiversity in Brazil: a case study of manioc. Human Ecology 35: 761-768.
Evanno G, Regnaut S and Goudet J (2005) Detecting the number of clusters of individuals using the software STRUCTURE: A simulation study. Molecular Ecology 14: 2611-2620.
Farias-Neto JT, Moura EF, Resende MDV, Celestino Filho P and Augusto SG (2013) Genetic parameters and simultaneous selection for root yield, adaptability and stability of cassava genotypes. Pesquisa Agropecuária Brasileira 48: 1561-1567.
Ferguson M, Rabbi I, Kim D-J, Gedil M, Lopez-Lavalle LAB and Okogbenin E (2012) Molecular markers and their application to cassava breeding: past, present and future. Tropical Plant Biology 5: 95-109.
Fukuda WMG, Silva SO and Iglesias I (2002) Cassava breeding. Crop Breeding and Applied Biotechnology 2: 617-638.
Hammer Ø, Harper DAT and Ryan PD (2001) PAST: Paleontological statistics software package for education and data analysis. Palaeontologia Electronica 4: 9.
Kalinowski ST, Taper ML and Marshall TC (2007) Revising how computer program Cervus accommodates genotyping error increase success in paternity assignment. Molecular Ecology 16: 1099-1106.
Lanaud C, Risterucci AM, Pieretti I, Falque M, Bouet A and Lagoda PJL (1999) Isolation and characterization of microsatellites in Theobroma cacao L. Molecular Ecology 8: 2141-2143.
Mba REC, Stephenson P, Edwards K, Melzer S, Nkumbira J, Gullberg U, Ape K, Gale M, Tohme J and Fregene M (2001) Simple sequence repeats (SSR) markers survey of the cassava (Manihot esculenta Crantz) genome: towards an SSR-based molecular genetic map. Theoretical and Applied Genetics 102: 21-31.
McKey D, Cavagnaro TR, Cliff J and Gleadow R (2010) Chemical ecology in coupled human and natural systems: people, manioc, multitrophic interactions and global change. Chemoecology 20: 109-133.
Missiaggia A and Grattapaglia D (2006) Plant microsatellite genotyping with 4-color fluorescent detection using multiple-tailed primers. Genetics and Molecular Research 5: 72-78.
Mkumbira J, Chiwona-Karltun L, Lagercrantz U, Mahungu NM, Saka J, Mhone A, Bokanga M, Brimer L, Gullberg U and Roling H (2003) Classification of cassava into ‘bitter’ and ‘cool’ in Malawi: from farmers perception to characterization by molecular markers. Euphytica 132: 7-22.
Moyib OK, Odunola OA and Dixon AGO (2007) SSR markers reveal genetic variation between improved cassava cultivars and landraces within a collection of Nigerian cassava germplasm. African Journal of Biotechnology 6: 2666-2674.
Mühlen GS, Martins PS and Ando A (2000) Variabilidade genética de etnovariedades de mandioca, avaliada por marcadores de DNA. Scientia Agricola 57: 319-328.
Oetting WS, Lee HK, Flanders DJ, Wiesner GL, Sellers TA and King RA (1995) Linkage analysis with multiplexed short tandem repeat polymorphisms using infrared fluorescence and M13 tailed primers. Genomics 30: 450-458.
Paetkau D and Strobeck C (1994) Microsatellite analysis of genetic variation in black bear populations. Molecular Ecology 3: 489-495.
Peakall R and Smouse PE (2012) GenAlEx 6.5: genetic analysis in Excel. Population genetic software for teaching and research-an update. Bioinformatics 28: 2537-2539.
Peroni N, Kageyama PY and Begossi A (2007) Molecular differentiation, diversity, and folk classification of ‘‘sweet’’ and ‘‘bitter’’ cassava (Manihot esculenta) in Caiçara and Caboclo management systems (Brazil). Genetic Resources and Crop Evolution 54: 1333-1349.
Pritchard JK, Stephens P and Donnelly P (2000) Inference of population structure using multilocus genotype data. Genetics 155: 945-959.
Ribeiro MNO, Carvalho SP, Santos JB and Antonio RP (2011) Genetic variability among cassava accessions based on SSR markers. Crop Breeding and Applied Biotechnology 11: 6263-6269.
Siqueira MVBM, Queiroz-Silva JR, Bressan EA, Borges A, Pereira KJC, Pinto JG and Veasey EA (2009) Genetic characterization of cassava (Manihot esculenta) landraces in Brazil assessed with simple sequence repeats. Genetics and Molecular Biology 32: 104-110.
Siqueira MVBM, Pinheiro TT, Borges A, Valle TL, Zatarim M and Veasey EA (2010) Microsatellite polymorphisms in cassava landraces from the Cerrado biome, Mato Grosso do Sul, Brazil. Biochemical Genetics 48: 879-895.
Sneath PH and Sokal RR (1973) Numerical taxonomy: The principles and practice of numerical classification. W.H. Freeman, San Francisco, 573p.
Vieira EA, Fialho JF, Faleiro FG, Bellon G, Fonseca KG and Silva M (2010) Caracterização molecular de acessos de mandioca de mesa adaptados ao Cerrado do Brasil Central. Revista Brasileira de Ciências Agrárias 5: 219-224.
Vieira EA, Fialho JF, Faleiro FG, Bellon G, Fonseca KG, Carvalho LJCB, Silva MS and Paula-Moraes SV (2011) Characterization of sweet cassava accessions based on molecular, quantitative and qualitative data. Crop Breeding and Applied Biotechnology 11: 232-240.
Wagner HW and Sefc KM (1999) Identity 1.0. Centre for Applied Genetics, University of Agricultural Sciences, Vienna, 5p.