CTLA-4
gene polymorphisms are associated with obesity in Turner Syndrome
Luana Oliveira dos Santos
1*Adriana Valéria Sales Bispo
2*, Juliana Vieira de Barros
1, Raysa Samanta
Moraes Laranjeira
1, Rafaella do Nascimento Pinto
1, Jaqueline de Azevêdo Silva
1, Andréa de Rezende
Duarte
3, Jacqueline Araújo
4, Paula Sandrin-Garcia
1, Sergio Crovella
1, Marcos André Cavalcanti Bezerra
5,
Taciana Furtado de Mendonça Belmont
6, Maria do Socorro Cavalcanti
6and Neide Santos
11
Departmento de Genética, Universidade Federal de Pernambuco, Recife, PE, Brazil.
2Instituto Federal de Educação, Ciência e Tecnologia do Sertão Pernambucano, Campus Serra Talhada,
Serra Talhada, PE, Brazil.
3
Serviço de Genética Medica, Instituto de Medicina Integral Professor Fernando Figueira, Recife, PE,
Brazil.
4Serviço de Endocrinlogia Pediátrica do Hospital das Clínicas, Universidade Federal de Pernambuco,
Recife, PE, Brazil.
5
Departmento de Biofísica e Radiobiologia, Universidade Federal de Pernambuco, Recife, PE, Brazil.
6Instituto de Biociências, Universidade de Pernambuco, Recife, PE, Brazil.
Abstract
Turner syndrome (TS) is characterized by a set of clinical conditions, including autoimmune/inflammatory diseases and infectious conditions, that can compromise a patient’s quality of life. Here we assessed polymorphisms in CTLA-4 +49A/G (rs231775), PTPN22 +1858G/A (rs2476601), and MBL2 -550 (H/L) (rs11003125), -221(X/Y) (rs7096206) and exon 1 (A/O) in women from northeastern Brazil to determine whether polymorphisms within these key immune response genes confer differential susceptibility to clinical conditions in TS. A case-control genetic asso-ciation study was performed, including 86 female TS patients and 179 healthy women. An assoasso-ciation was observed for the A/G genotype ofCTLA-4 +49A/G in TS patients (p=0.043, odds ratio [OR]=0.54). In addition, an association
between theCTLA-4 G/G genotype and obesity was detected in TS patients (p=0.02, OR=6.04). Regarding, the
-550(H/L) polymorphism in the MBL2 promoter, the frequency of the H/L genotype was significantly higher in the TS group than healthy controls (p=0.01, OR=1.96). The H/H genotype indicated a protective effect in TS patients (p=0.01, OR=0.23). No differences were observed in the distribution of -221(X/Y), MBL2 exon 1 variants, and PTPN22 +1858G/A in any assessed groups. CTLA-4 variants are potentially involved in obesity in this cohort of TS patients from northeastern Brazil.
Keywords:CTLA-4gene, immune genes, obesity, polymorphism, Turner syndrome.
Received: October 10, 2017; Accepted: February 27, 2018.
Introduction
Turner syndrome (TS) is one of the most common chromosomal abnormalities in humans and is characterized by the presence of one X chromosome and total or partial loss of the second sex chromosome. TS is estimated to af-fect 1 in every 2500 live female births (Stochholmet al., 2006). Individuals with TS exhibit a set of phenotypic fea-tures, including short stature and gonadal dysgenesis. Other clinical conditions, such as osteoporosis, dyslipidemia, obesity and congenital malformations are also observed
(Ostberget al., 2005; Carvalhoet al., 2010; Bispoet al., 2013; Ríos Orbañanoset al., 2015).
Some studies have reported increased levels of auto-antibodies (anti-thyroid peroxidase and anti-glutamic-acid-decarboxylase) in TS patients and an increased risk of developing a range of autoimmune diseases, such as Hashi-moto’s thyroiditis, type I diabetes mellitus, celiac disease, Crohn’s disease, ulcerative colitis, juvenile rheumatoid ar-thritis, Addison’s disease, autoimmune hepatitis, psoriasis, vitiligo, and alopecia (Mortensenet al., 2009; Biancoet al., 2010; Jørgensenet al., 2010; Bakalovet al., 2012). In addi-tion, ovarian insufficiency and absence of a second normal X chromosome are linked to an increased risk of autoim-mune disorders in these patients. However, the underlying pathophysiological mechanisms related to the immune un-DOI: http://dx.doi.org/10.1590/1678-4685-GMB-2017-0312
Send correspondence to Neide Santos. Departamento de Gené-tica, Universidade Federal de Pernambuco. Av. da Engenharia, s/n, Cidade Universitária, 50740-600, Recife, PE, Brazil. E-mail: [email protected]
balance remain to be fully elucidated (Mortensenet al., 2009; Bakalovet al., 2012).
A wide variety of autoimmune/inflammatory dis-eases and infectious conditions have been associated with a set of genes related to immune regulation, including the ty-rosine-protein phosphatase non-receptor type 22 gene (PTPN22), cytotoxic T-lymphocyte-associated protein 4 gene (CTLA4),and mannose-binding lectin(MBL2) (Bot-tiniet al., 2004; Bevilacqua Filhoet al., 2012; Katkamet al., 2015). Polymorphisms within these three genes have been analyzed due to their importance in immune balance and homeostasis within the body. Even though a body of evidence indicates immune deregulation processes in TS, onlyPTPN22rs2476601 has been assessed in Brazilian TS patients from São Paulo (Southeast region) (Biancoet al., 2010). Furthermore, studies evaluating the role ofMBL2 andCTLA-4polymorphisms in TS and its association with clinical features are lacking.
To understand the role of these key genes in immune misbalance and its consequences, we assessed whether PTPN22,CTLA-4,andMBL2polymorphisms confer sus-ceptibility to autoimmune conditions or other inflamma-tion-related features in TS patients from Northeast Brazil.
Materials and Methods
Patients and controls
This study included 86 patients with cytogenetic di-agnosis of TS, who attended at Medical Genetics Service of Institute of Integral Medicine Professor Fernando Figueira and at Pediatric Endocrinology Service of Clinical Hospital of Federal University of Pernambuco. It was proposed as a pilot study. At time of TS diagnosis, patients mean age was 11.48 years old (SD±7.52 years old), ranging from 0.1 to 33 years. Clinical data shown in the Table 1 were obtained from medical records of each patient. The control group in-cluded 179 healthy women from the same geographical re-gion. Their mean age was 34.62 years old (SD±13.4 years old), ranging from 8 to 72 years. Exclusion criteria for the control group included an individuals’ history of autoim-mune and inflammatory chronic disease, also in close rela-tives such as parents. All individuals (or their legal responsible) included in this research signed an informed consent term, which followed the Declaration of Helsinki guidelines and presented the approval number from local Ethics Committee (Record: CEP/IMIP N° 802/06; CEP/CCS/UFPE N° 493/11).
Karyotyping
Clinical diagnosis of 86 TS patients was confirmed by chromosome analysis in peripheral blood leucocyte. Karyotypes found were as follows: 45,X (n=47, 54.65%); 45,X/46,X,i(Xq) (n=15, 17.44%); 46,X,i(Xq) (n=4, 4.65%); 45,X/46,XY (n=4, 4.65%); 45,X/46,X,r(X) (n=3,
3.49); other chromosomal constitutions summed 13 indi-viduals (15.12%).
DNA extraction and genotyping
Genomic DNA was extracted from whole blood using IllustraTM Blood GenomicPrep Mini Spin Kit (GE Healthcare) according to manufacturer’s instructions. SNPs selection was based on minimum allele frequency (MAF) of 10% and/or SNP consequence/function upon gene action. A total of five SNPs were selected distributed as followsPTPN22 +1858G/A (rs2476601) at codon 620, CTLA-4+49A/G (rs231775) within codon 17 in the first exon andMBL2promoter region-550(H/L) (rs11003125), -221(X/Y) (rs7096206). Genotyping was performed using TaqMan SNP genotyping assays and Taqman Universal Master Mix (Applied Biosystems®, CA) according to
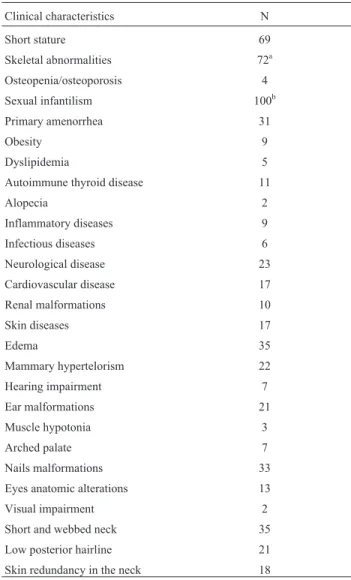
Table 1- Clinical characterization of all Turner syndrome patients en-rolled in our study.
Clinical characteristics N
Short stature 69
Skeletal abnormalities 72a
Osteopenia/osteoporosis 4
Sexual infantilism 100b
Primary amenorrhea 31
Obesity 9
Dyslipidemia 5
Autoimmune thyroid disease 11
Alopecia 2
Inflammatory diseases 9
Infectious diseases 6
Neurological disease 23
Cardiovascular disease 17
Renal malformations 10
Skin diseases 17
Edema 35
Mammary hypertelorism 22
Hearing impairment 7
Ear malformations 21
Muscle hypotonia 3
Arched palate 7
Nails malformations 33
Eyes anatomic alterations 13
Visual impairment 2
Short and webbed neck 35
Low posterior hairline 21
Skin redundancy in the neck 18
aMain clinical conditions arecubitus valgus,pectus scavatumandgenu
valgus;
manufacturer instructions. SNP assessment withinMBL2 exon 1 (A/O) was performed using SYBR Green (Qiagen, Hilden, Germany) as previously described (Hladniket al., 2002). All Sybr Green endpoint PCRs were performed, in-cluding all three possible genotypes as positive controls, in a Rotor-Gene 6000 TM apparatus (Corbett Research Mort-lake, Sydney, Australia). Ten randomly chosen MBL2 genotyped samples were sequenced in order to dou-ble-check the Melting Temperature assay (MTA) results. We found 100% concordance between sequenced samples and the MTA results.
Statistical analysis
Statistical analyses were carried out using SNPStats available at http://bioinfo.iconcologia.net/SNPstats_web and R software (https://www.r-project.org/). Hardy–Wein-berg equilibrium was tested for each polymorphism by comparing observed with expected frequencies using chi-square (c2) tests. Differences in allele and genotype frequencies from each studied polymorphism in patients and controls were assessed usingc2or Fisher’s exact test. Odds Ratio (OR) and 95% Confidence Intervals (CI) were also calculated and ap-value < 0.05 was considered statisti-cally significant. Combined alleles for the PTPN22 and CTLA-4genes, haplotypes for theMBL2gene and a possi-ble association of these combined alleles and haplotype with clinical conditions in TS patients were also assessed. Combined genotypes for theMBL2gene were assessed by Arlequin version 3.1 software (Excoffier et al., 2005). Fisher’s exact test was performed to evaluate difference
be-tween combined genotypes in case-control and associations with clinical data in TS group. We compared genotype and allele distribution for all SNPs assessed in this study in TS patients and control group. Posteriorly, we evaluated a pos-sible association of all polymorphic variants with differen-tial presence of autoimmune diseases such as autoimmune thyroid disease and alopecia and other clinical features as follows: obesity, dyslipidemia, inflammatory and infec-tious conditions in TS patients. Post-hoc (goodness of fitc2
tests) power analysis was performed with the G* Power software (version 3.1.9.2, available at http://www.gpower.hhu.de/), with a error probability of 0.05
Results
PTPN22andCTLA-4gene polymorphisms
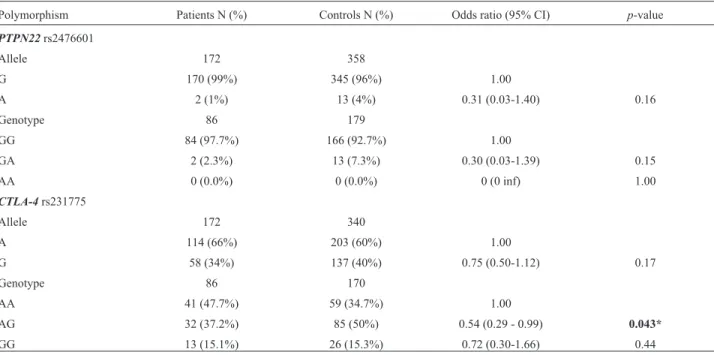
The allele and genotype distributions of PTPN22 rs2476601 (G > A) andCTLA-4rs231775 (A > G) among TS patients and healthy controls are summarized in Table 2. Conformity to Hardy-Weinberg equilibrium (HWE; p > 0.05) was observed in both SNP distributions, and no sig-nificant differences were found in the allele and genotype frequencies of these variants in both groups (Table 2).
We did not detect the homozygous A/A genotype of PTPN22rs2476601 (G > A) in any of the studied groups. A lower frequency of the A allele and G/A genotype was ob-served in both TS patients and controls (Table 2). No signif-icant association was identified between the assessed SNPs and the presence of any clinical conditions in women with
Table 2- Genotype and allele distribution ofPTPN22andCTLA-4gene polymorphisms in TS and controls group.
Polymorphism Patients N (%) Controls N (%) Odds ratio (95% CI) p-value
PTPN22rs2476601
Allele 172 358
G 170 (99%) 345 (96%) 1.00
A 2 (1%) 13 (4%) 0.31 (0.03-1.40) 0.16
Genotype 86 179
GG 84 (97.7%) 166 (92.7%) 1.00
GA 2 (2.3%) 13 (7.3%) 0.30 (0.03-1.39) 0.15
AA 0 (0.0%) 0 (0.0%) 0 (0 inf) 1.00
CTLA-4rs231775
Allele 172 340
A 114 (66%) 203 (60%) 1.00
G 58 (34%) 137 (40%) 0.75 (0.50-1.12) 0.17
Genotype 86 170
AA 41 (47.7%) 59 (34.7%) 1.00
AG 32 (37.2%) 85 (50%) 0.54 (0.29 - 0.99) 0.043*
GG 13 (15.1%) 26 (15.3%) 0.72 (0.30-1.66) 0.44
TS (p > 0.05; Fisher’s exact test) (Table S1). The power was 80.7% (a-error = 5% confidence) to detect a medium effect size (w=0.3) forPTPN22genotypes in both patients and controls.
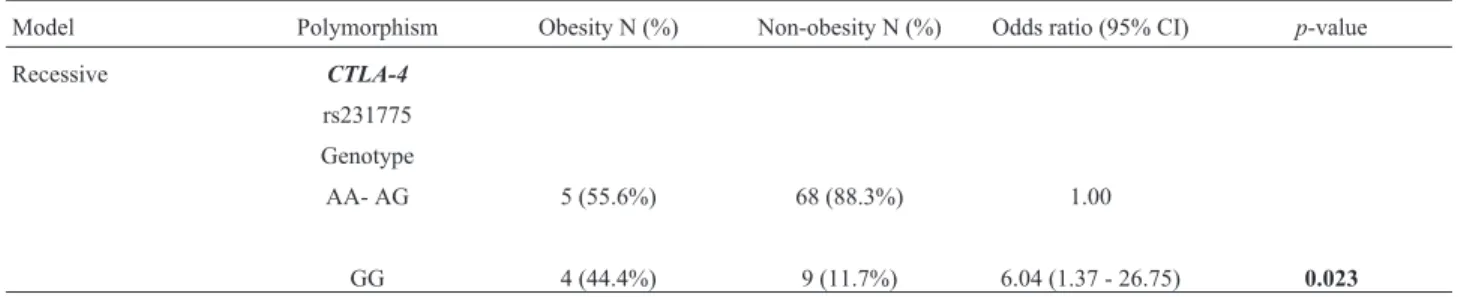
ConcerningCTLA-4rs231775, significantly different distributions of genotype frequencies were observed in TS patients compared to the control group. An association was detected for the A/G genotype (p=0.043, OR=0.54), indi-cating a differential distribution for this SNP in TS patients. The power was 99% (a-error = 5% confidence) to detect a medium effect size (w=0.3) forCTLA4genotypes compar-ing patients and controls. Furthermore, when assesscompar-ing the clinical features of TS and the allele and genotype distribu-tion, we detected an association between theCTLA-4allele (recessive model: A/A—A/G vs.G/G) and obesity in TS patients (p=0.02, 95% CI 1.37-26.75, OR=6.04) (Table 3, Table S2).
Combined alleles forPTPN22andCTLA-4genes
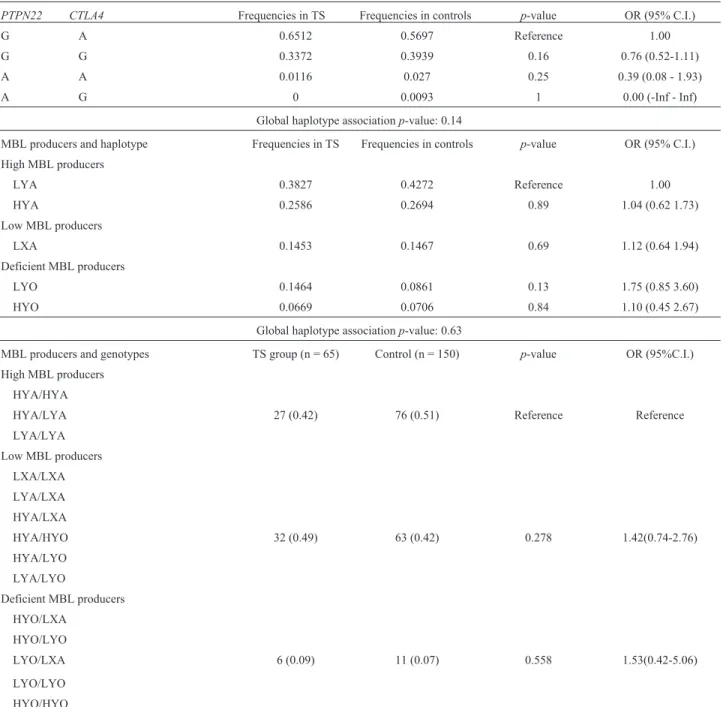
The combined alleles ofPTPN22and CTLA-4 and frequencies for both groups are given in Table 5. No cant differences were observed. Furthermore, no signifi-cant association was established between the combined alleles and clinical status of TS patients (Table S3).
MBL2gene polymorphisms
TheMBL2genotype and allele distributions in TS pa-tients and controls are given in Table 4. All allelic and genotypic frequencies of MBL2 polymorphisms were in HWE in the TS and control groups, except for rs11003125 (-550 H/L) in the TS group (p< 0.05). The H/L genotype frequency was significantly higher in TS patients than con-trols (overdominant model: H/L vs. L/L—H/H: p=0.01, OR=1.96, 95% CI 1.11-3.50). Furthermore, the H/H geno-type indicated a protective effect in TS patients compared to healthy controls (recessive model: H/H vs. L/L—H/L: p=0.01, OR=0.23, 95% CI 0.04-0.83). Again, this result cannot be fully explained due to an absence of HWE in this specific group. The power was 99.9% (5% confidence) to detect a medium effect size (w=0.3) for -550MBL2 geno-types in both groups.
Regarding MBL2 rs7096206 (-221 X/Y), no differ-ences in allele or genotype frequencies were observed be-tween TS patients and controls. The power was 30.5% (5% confidence) to detect a medium effect size (w=0.3) for -221 MBL2 genotypes when comparing patients and controls. Furthermore, no significant differences were observed in the genotype and allele frequencies of exon 1 variants be-tween TS patients and controls. The power was 91.2% (5% confidence) to detect a medium effect size (w=0.3) for exon 1MBL2genotypes when comparing TS patients and con-trols. In patients with TS, no SNP in the MBL2 gene or promotor region was associated with clinical characteris-tics (Table S4).
Haplotypes and combined genotypes ofMBL2gene
-550, -221,and exon 1 variants
The frequencies of haplotypes and combined geno-types originating from linkage disequilibrium between the MBL2 -550 and -221 promoter region and exon 1 poly-morphisms are given in Table 5. Haplotypes were com-bined in different groups; haplotypes associated with high expression of MBL (LYA, HYA), low production of MBL (LXA), and deficient expression of MBL (LYO, HYO). No significant differences were found in haplotype frequencies between the analyzed groups. Furthermore, no significant association was established among haplotypes and the clin-ical data of TS patients (Table S5).
Genotypes were classified as high (HYA/HYA, HYA/LYA, and LYA/LYA); low (LXA/LXA, LYA/LXA, HYA/LXA, HYA/HYO, HYA/LYO, and LYA/LYO); and deficient producers of MBL (HYO/HYO, HYO/LXA, HYO/LYO, LYO/LXA, and LYO/LYO). Significant dif-ferences were not found between the evaluated groups. Moreover, no significant difference was observed among combined genotypes and the clinical data of TS patients (Table S6).
Discussion
To date, only a few assays have been performed in-volving genes linked to innate and adaptive immunity in patients with TS, even though the immune response seems impaired in these patients (Biancoet al., 2010, 2012).
Table 3- Genotype distribution ofCTLA-4gene polymorphisms in TS group.
Model Polymorphism Obesity N (%) Non-obesity N (%) Odds ratio (95% CI) p-value
Recessive CTLA-4
rs231775
Genotype
AA- AG 5 (55.6%) 68 (88.3%) 1.00
GG 4 (44.4%) 9 (11.7%) 6.04 (1.37 - 26.75) 0.023
We includedPTPN22in our analyses due to its im-portance in the host immune system; this gene encodes LYP, an important negative regulator of T cell activation (Bottiniet al., 2004). Our results indicate an absence of an association between the selectedPTPN22SNP and auto-immunity, inflammatory, and infectious conditions in TS women.
Our results differ from Bianco et al. (2010), who found an association between the same SNP (PTPN22 rs2476601) and the development of autoimmune diseases in TS in another cohort from Southeast Brazil. The fre-quency of the A allele in women with TS (1.1%) and healthy controls (3.6%), as well as the heterozygote geno-type in both groups (2.3% and 7.3%, respectively), was lower in our study than that of Biancoet al.(2010). In their study, the frequency of the A allele and heterozygote geno-type were 18.3% and 28.2% in the TS group, and 9.2% and 16.1% in controls, respectively. A disease-associated homozygote genotype was present in 4.2% of patients and 1.1% of controls.
This difference between studies could be due to varia-tion in allele frequencies of some disease-associated SNPs
in different ethnic groups (Moriet al., 2005), because the Brazilian population exhibits variety in allele distribution. Geographic distributions in Brazil exhibit ethnic dispari-ties, mainly due to the genetic burden of heterogeneous col-onization sources (Penaet al., 2009; Coelhoet al., 2015).
We also evaluatedPTPN22rs2476601 (G > A) and other clinical features in TS patients, such as obesity, as well as dyslipidemia, given its role in modulating inflam-matory conditions. As obesity is a disease characterized by chronic mild inflammation, the concentration of acute phase proteins and cytokines associated with inflammation are higher in obese individuals compared to normal weight individuals (Trayhurn, 2007). However, our analysis did not indicate an association between these clinical manifes-tations in the TS group, which is similar to a previous study by Salinas-Santander et al. (2016), in which PTPN22 +1858G/A was not associated with differential susceptibil-ity to overweight and the development of obessusceptibil-ity in adoles-cents.
TheCTLA-4+49A/G polymorphism at exon 1 is in-volved in the negative regulation of T cells. Our assay
Table 4- Genotype and allele distribution ofMBL2gene polymorphisms in TS and controls group.
Inheritance Model Polymorphism Patients N (%) Controls N (%) Odds ratio (95% CI) p-value
MBL2rs11003125
Allele 172 300
L 116 (67.0%) 198 (66.0%) 1.00
H 56 (33.0%) 102 (34.0%) 0.93 (0.61- 1.42) 0.76
Recessive Genotype 86 150
L/L—H/L 83 (96.5%) 130 (86.7%) 1.00
H/H 3 (3.5%) 20 (13.3%) 0.23 (0.04-0.83) 0.01*
Overdominant Genotype 86 150
L/L—H/H 36 (41.9%) 88 (58.7%) 1.00
H/L 50 (58.1%) 62 (41.3%) 1.96 (1.11-3.50) 0.01*
MBL2rs7096206
Allele 172 300
Y 147 (85%) 256 (85%) 1.00
X 25 (15%) 44 (15%) 0.98(0.55-1.73) 1.0
Recessive Genotype 86 150
Y/Y—X/Y 84 (97.7%) 144 (96.0%) 1.00
X/X 2 (2.3%) 6 (4.0%) 0.57(0.05-3.29) 0.7
MBL2Exon 1
Allele 126 300
A 98 (78%) 253 (84%) 1.00
O 28 (22%) 47 (16%) 1.53(0.87-2.66) 0.12
Dominant Genotype 63 150
A/A 39 (61.9%) 108 (72%) 1.00
A/O - O/O 24 (38.1%) 42 (28%) 1.57(0.80-3.06) 0.14
showed an association between the rs231775 G/G genotype and obesity in the TS group (p=0.02).
The presence of theCTLA-4+49A/G variant has been associated with different diseases, and G/G individuals may possess CTLA-4 protein with a weak suppression function compared to individuals with the A/A genotype (Chistiakov and Turakulov, 2003). Therefore, increased T-cell activation due to this reduced inhibitory signal to T cells would be associated with the pathogenesis of several autoimmune/inflammatory diseases, including obesity, as observed with TS patients in the present study. The adipo-cytes of obese individuals with TS express fewer
anti-inflammatory elements and high amounts of pro-inflammatory factors, leading to a misplaced response in immune cells (Ostberget al., 2005; Bakalovet al., 2012).
MBL2polymorphisms and their influence on serum protein levels have been evaluated extensively and found to be associated with recurrent and severe infections (Sumiya et al., 1991; Summerfieldet al., 1995), such as tuberculosis (da Cruzet al., 2013) and autoimmune diseases, including celiac disease (Boniotto et al., 2005), systemic lupus erythematosus (Lee et al., 2005), Sjögren’s syndrome (Tsutsumiet al., 2001), and autoimmune thyroid disease (AITD) (Bevilacqua Filhoet al., 2012).
Table 5- Analyses of combined alleles ofPTPN22andCTLA4genes, haplotypes and genotypes of -550 and -221 promoter region and exon 1 ofMBL2
gene in TS patients and controls.
PTPN22 CTLA4 Frequencies in TS Frequencies in controls p-value OR (95% C.I.)
G A 0.6512 0.5697 Reference 1.00
G G 0.3372 0.3939 0.16 0.76 (0.52-1.11)
A A 0.0116 0.027 0.25 0.39 (0.08 - 1.93)
A G 0 0.0093 1 0.00 (-Inf - Inf)
Global haplotype associationp-value: 0.14
MBL producers and haplotype Frequencies in TS Frequencies in controls p-value OR (95% C.I.)
High MBL producers
LYA 0.3827 0.4272 Reference 1.00
HYA 0.2586 0.2694 0.89 1.04 (0.62 1.73)
Low MBL producers
LXA 0.1453 0.1467 0.69 1.12 (0.64 1.94)
Deficient MBL producers
LYO 0.1464 0.0861 0.13 1.75 (0.85 3.60)
HYO 0.0669 0.0706 0.84 1.10 (0.45 2.67)
Global haplotype associationp-value: 0.63
MBL producers and genotypes TS group (n = 65) Control (n = 150) p-value OR (95%C.I.)
High MBL producers
HYA/HYA
HYA/LYA 27 (0.42) 76 (0.51) Reference Reference
LYA/LYA
Low MBL producers
LXA/LXA
LYA/LXA
HYA/LXA
HYA/HYO 32 (0.49) 63 (0.42) 0.278 1.42(0.74-2.76)
HYA/LYO
LYA/LYO
Deficient MBL producers
HYO/LXA
HYO/LYO
LYO/LXA 6 (0.09) 11 (0.07) 0.558 1.53(0.42-5.06)
LYO/LYO
Polymorphisms at exon 1 and the promotor region of MBL2were evaluated in our study due to their role in innate immunity and modulation of the inflammatory response. A relationship between clinical parameters and this genetic variant has not been assessed previously in TS, making our study the first to be performed in women with TS.
No association was found between the MBL2 -221 (X/Yallele) polymorphism and different clinical conditions in TS patients. ThisMBL2promoter variation has a signifi-cant down-regulating effect on the serum MBL concentra-tion, leading to ineffective clearance of apoptotic cells and the spread of self-antigens, permitting an immune response toward autoimmunity and tissue damage (Bouwmanet al., 2006; Araujoet al., 2009). TheYvariant is associated with high serum MBL expression (Madsenet al., 1995) and has been involved in susceptibility to the development of dif-ferent diseases (Leeet al., 2005; da Cruzet al., 2013).
On the other hand, our results revealed significant dif-ferences regarding the -550 (H/L allele) promoter polymor-phism between TS patients and controls (p < 0.05), revealing a different distribution in both groups.
Notably, in our study population, the -550 H/LMBL2 variant was not in HWE, though the power analysis ex-cluded type I and II statistical error. Therefore, we suggest that the TS condition acts upon the allelic distribution, causing deviation from HWE. Although differences in the MBL2polymorphism distribution have been detected, no significant association was found regarding theMBL2-550 (H/L allele) variant and clinical data of the TS group.
In summary, even though our study is a pilot study, due to limited number of TS patients and controls included, our results indicate a differential distribution for some polymorphisms within key inflammation-regulating genes in TS patients. The understanding of how key immune genes and its variants are related in TS might help in future therapy strategies. These findings may open up a new po-tential line of research to improve life’s quality in these in-dividuals.
Acknowledgments
The authors wish to thank the patients, parents, and clinicians for the data. The study was financially supported by the Fundação de Amparo a Ciência e Tecnologia do Estado de Pernambuco (FACEPE – APQ-0638-2.02/12) and by Universidade Federal de Pernambuco (UFPE).
References
Araujo J, Segat L, Guimarães RL, Brandão LAC, Souza PER, Santos S, Soares TS, Falcão EA, Rodrigues F, Carvalho Jr R
et al.(2009) Mannose binding lectin gene polymorphisms and associated auto-immune diseases in type 1 diabetes Bra-zilian patients. Clin Immunol 131:254-259.
Bakalov VK, Gutin L, Cheng CM, Zhou J, Sheth P, Shah K, Arepalli S, Vanderhoof V, Nelson LM and Bondy CA (2012) Autoimmune disorders in women with turner
syn-drome and women with karyotypically normal primary ovarian insufficiency. J Autoimmun 38:315–321.
Bevilacqua Filho CT, Rodrigues FF, Segat L, Fonseca AM, Arau-jo J, Arahata C, Pontes L, Vilar L, Lima Filho JL and Crovella S (2012) Association of MBL2 gene exon 1 vari-ants with autoimmune thyroid disease in Brazilian patients. Int J Immunogenet 39:357-361.
Bianco B, Verreschi ITN, Oliveira KC, Guedes AD, Galera BB, Galera MF, Barbosa CP and Lipay MVN (2010) PTPN22 polymorphism is related to autoimmune disease risk in pa-tients with Turner syndrome. Scand J Immunol 72:256-259. Bianco B, Verreschi IT, Oliveira KC, Guedes AD, Barbosa CP
and Lipay MV (2012) Analysis of vitamin D receptor gene (VDR) polymorphisms in Turner syndrome patients. Gy-necol Endocrinol 28:326-329.
Bispo AVS, Santos LO, Burégio-Frota P, Galdino MB, Duarte AR, Leal GF, Araújo J, Gomes B, Soares-Ventura EM, Muniz MTCet al.(2013) Effect of chromosome constitution variations on the expression of Turner phenotype. Genet Mol Res 12:4243-4250.
Boniotto M, Braida L, Baldas V, Not T, Ventura A, Vatta S, Radillo O, Tedesco F, Percopo S, Montico Met al.(2005) Evidence of a correlation between mannose-binding lectin and celiac disease: a model for other autoimmune diseases. J Mol Med 83:308-315.
Bottini N, Musumeci L, Alonso A, Rahmouni S, Nika K, Rostam-khani M, MacMurray J, Meloni GF, Lucarelli P, Pellecchia Met al.(2004) A functional variant of lymphoid tyrosine phosphatase is associated with type I diabetes. Nat Genet 36:337-338.
Bouwman LH, Roep BO and Roos A (2006) Mannose-binding lectin: Clinical implications for infection, transplantation, and autoimmunity. Hum Immunol 67:247-256.
Carvalho AB, Guerra Júnior G, Baptista MT, Faria AP, Marini SH and Guerra AT (2010) Cardiovascular and renal anomalies in Turner syndrome. Rev Assoc Med Bras 56:655-659. Chistiakov DA and Turakulov RI (2003) CTLA-4 and its role in
autoimmune thyroid disease. J Mol Endocrinol 31:21-36. Coelho AVC, Moura RR, Cavalcanti CAJ, Guimarães RL,
San-drin-Garcia P, Crovella S and Brandão LAC (2015) A rapid screening of ancestry for genetic association studies in an admixed population from Pernambuco, Brazil. Genet Mol Res 14:2876-2884.
Da Cruz HLA, Silva RC, Segat L, Carvalho MSZMG, Brandao LAC, Guimaraes RL, Santos FCF, Lira LAS, Montenegro LML, Schindler HC et al. (2013) MBL2 gene polymorphisms and susceptibility to tuberculosis in a north-eastern Brazilian population. Infect Genet Evol 19:323-329. Excoffier L, Laval G and Schneider S (2005) Arlequin (version
3.0): An integrated software package for population genetics data analysis. Evol Bioinform Online 1:47–50.
Hladnik U, Braida L, Boniotto M, Pirulli D, Gerin F, Amoroso A and Crovella S (2002) Single-tube genotyping of MBL-2 polymorphisms using melting temperature analysis. Clin Exp Med 2:105-108.
Jørgensen KT, Rostgaard K, Bache I, Biggar RJ, Nielsen NM, Tommerup N and Frisch M (2010) Autoimmune diseases in women with Turner’s syndrome. Arthritis Rheum 62:658–666.
exon-1 polymorphism with the tumor necrosis factor-ain the risk of systemic lupus erythematosus among South Indi-ans. Hum Immunol 77:158-164.
Lee YH, Witte T, Momot T, Schmidt RE, Kaufman KM, Harley JB and Sestak AL (2005) The mannose-binding lectin gene polymorphisms and systemic lupus erythematosus: Two case-control studies and a meta-analysis. Arthritis Rheum 52:3966-3974.
Madsen HO, Garred P, Thiel S, Kurtzhals JAL, Lamm LU, Ryder LP and Svejgaard A (1995) Interplay between promoter and structural gene variants control basal serum level of mannan-binding protein. J Immunol 155:3013-3020. Mori M, Yamada R, Kobayashi K, Kawaida R and Yamamoto K
(2005) Ethnic differences in allele frequency of autoim-mune-disease-associated SNPs. J Hum Genet 50:264-266. Mortensen KH, Cleemann L, Hjerrild BE, Nexo E, Locht H,
Jeppesen EM and Gravholt CH (2009) Increased prevalence of autoimmunity in Turner syndrome –influence of age. Clin Exp Immunol 156:205–210.
Ostberg JE, Attar MJ, Mohamed-Ali V and Conway GS (2005) Adipokine dysregulation in turner syndrome: Comparison of circulating interleukin-6 and leptin concentrations with measures of adiposity and C-reactive protein. J Clin Endo-crinol Metab 90: 2948-2953.
Pena SD, Bastos-Rodrigues L, Pimenta JR and Bydlowski SP (2009) DNA tests probe the genomic ancestry of Brazilians. Braz J Med Biol Res 42:870-876.
Ríos Orbañanos I, Vela Desojo A, Martinez-Indart L, Grau Bola-do G, Rodriguez Estevez A and Rica Echevarria I (2015) Turner syndrome: From birth to adulthood. Endocrinol Nutr 62:499-506.
Salinas-Santander MA, León-Cachón RB, Cepeda-Nieto AC, Sánchez-Domínguez CN, González-Zavala MA, Gallardo-Blanco HL, Esparza-González SC and González-Madrazo MA (2016) Assessment of biochemical parameters and characterization of TNFa-308G/A and PTPN22 +1858C/T
gene polymorphisms in the risk of obesity in adolescents. Biomed Rep 4:107-111.
Stochholm K, Juul S, Juel K, Naeraa RW and Gravholt CH (2006) Prevalence, incidence, diagnostic delay, and mortality in Turner syndrome. J Clin Endocrinol Metab 91: 3897-3902. Sumiya M, Super M, Tabona P, Levinsky RJ, Arai T, Turner MW
and Summerfield JA (1991) Molecular basis of opsonic de-fect in immunodeficient children. Lancet 337:1569-1570. Summerfield JA, Ryder S, Sumiya M, Thursz M, Gorchein A,
Monteil MA and Turner MW (1995) Mannose binding pro-tein gene mutations associated with unusual and severe in-fections in adults. Lancet 345:886-889.
Trayhurn P (2007) Adipocyte biology. Obesity Rev 8:41–44. Tsutsumi A, Sasaki K, Wakamiya N, Ichikawa K, Atsumi T,
Ohtani K, Suzuki Y, Koik T and Sumida T (2001) Mannose-binding lectin gene: Polymorphisms in Japanese patients with systemic lupus erythematosus, rheumatoid ar-thritis and Sjögren’s syndrome. Genes Immun 2:99-104.
Supplementary material
The following online material is available for this article: Table S1 – Detailed statistics results for PTPN22 rs2476601
(G/A)
Table S2 – Detailed statistics results forCTLA-4rs231775 (A/G). Table S3 – Detailed statistics results for Combined Alleles.
Table S4 – Detailed statistics results for the MBL2gene and promotor region
Table S5 – Detailed statistics results for the haplotypes (LYA, HYA, LXA, LYO, HYO) of theMBL2gene.
Table S6 – Detailed statistics results for the genotypes (High MBL expression, Intermediate MBL expression and Low MBL expression) of theMBL2gene.
Associate Editor: Emmanuel Dias Neto