Revista Portuguesa de Estudos Regionais, n.º 33, 2013, 2.º Quadrimestre The Social Accounting Matrix (SAM) is presented as a
tool for measuring and modelling the activity of countries and regions. A SAM-based approach to the study of such activity enables it to be described both empirically and theoretically through numerical and algebraic versions of that same matrix. This approach is presented using the words of those responsible for its foundation: Richard Stone and Graham Pyatt.
Applications of the SAM to Portugal and the Azores serve to underline the importance of ensuring consistency with the national and regional accounts when measuring and modelling the activity of countries and regions with SAMs. These applications are based, on the one hand, on SAMs for the Azores and Portugal, which have the same structure and identical characteristics and were construct-ed to serve as a database for a computable general equi-librium (CGE) model and, on the other hand, on a SAM for Portugal, the author’s area of research, which was con-structed using the above-mentioned SAM-based approach. It is also underlined that such a task can be performed better if all of the part that is measured by the national and regional accounts is included in the study. These same ac-counts should be considered as the basic sources of in-formation.
The comparison of such applications underlines the im-portance of working with the institutional sectors together with the sectors of activity, as well as with the part relating to the secondary distribution of income together with the
A Matriz de Contabilidade Social (SAM) é apresentada como uma ferramenta para medir e modelizar a atividade de países e regiões. A abordagem baseada na SAM para o estudo de tal atividade possibilita a sua descrição tanto em-pírica como teórica através de versões numéricas e algé-bricas dessa mesma matriz. Esta abordagem é apresentada usando a terminologia dos seus mentores – Richard Stone e Graham Pyatt.
Com base em aplicações a Portugal e aos Açores, é enfatizada a importância da consistência com as contas nacionais e regionais na tarefa de medição e modelização da atividade de países e regiões com SAM. Tais aplicações baseiam-se, por um lado, em SAM para os Açores e para Portugal, com a mesma estrutura e características idênticas, construídas para servir de base a um modelo de equilíbrio geral calculável (CgE) e, por outro, numa SAM para Portu-gal, objeto de investigação da autora, construída a partir da abordagem baseada na SAM acima referida.
É também defendida a posição de que tal tarefa poderá ser melhor sucedida se abarcar toda a parte medida pelas contas nacionais e regionais, as quais deverão ser conside-radas fontes de informação de base.
A comparação de tais aplicações permite sublinhar a importância do trabalho com setores institucionais, a par dos setores de atividade, bem como a parte relativa à dis-tribuição secundária do rendimento, a par da disdis-tribuição primária do rendimento. Nesse contexto, são identificados os riscos da não-consideração de interações importantes
MeASURinG And MOdeLLinG THe AcTiViTY
OF cOUnTRieS And ReGiOnS WiTH SOciAL
AccOUnTinG MATRiceS*
MediçãO e MOdeLiZAçãO dA ATiVidAde de PAÍSeS e ReGiÕeS
cOM MATRiZeS de cOnTABiLidAde SOciAL
Susana Santos
ISEG (School of Economics and Management)/UTL (Technical University of Lisbon); UECE – Research Unit on Complexity and Economics and DE – Department of Economics
ABSTRAcT/ReSUMO
44 Susana Santos
Revista Portuguesa de Estudos Regionais, n.º 33, 2013, 2.º Quadrimestre 1. inTROdUcTiOn
This article is part of the work relating to two research projects that was carried out between January 2009 and July 2011 at two separate research units: the project enti-tled “CGE (Computable General Equilibrium) Model for the analysis of economic, social and environmental policies”, which was conducted at the Research Centre for Applied Economics in the Atlantic (CEEAplA) of the Universities of the Azores and Madeira, and the project entitled “Measur-ing and modell“Measur-ing the activity of society” at the Research Unit on Complexity and Economics (UECE) of ISEG ( Insti-tuto Superior de Economia e gestão), at the Technical Uni-versity of Lisbon.
The main purpose of this work was to update for 2005 a Social Accounting Matrix (SAM) which had been con-structed for 2001, in order to serve as a database for a CGE model for the Azores and, at the same time, to construct a similar one to support an application of the same model to Portugal in 2005.
A synthesis will be provided of this study and some con-cluding remarks will be made, based on some of the work previously carried out: the working paper “The Underlying Database of an Instrument for Economic and Social Policy Analysis for the Azores. Application and Extension to 2005” (Santos, 2011), which documents and justifies all the work that has been undertaken so far. Also contributing to that research work are the papers prepared for the presenta-tions made to the International Conference on Economic Modelling, promoted by EcoMod (Global Economic Mod-eling Network), held in Ponta Delgada – Azores (Portugal), from 29/6 to 1/7/2011, and to the 12th Workshop APDR (Associação Portuguesa para o Desenvolvimento Regional), held in Leiria – Portugal, on 15/2/2012.
The purpose of this article will be, on the one hand, to identify the main ideas underlying the SAM-based ap-proach and the corresponding conceptual framework and, on the other hand, to underline the importance of ensuring consistency with the national and regional accounts when measuring and modelling the activity of countries and re-gions with SAMs. The latter will be supported by applica-tions to the Azores and Portugal in 2005, using the results of the above-mentioned work and of another author’s work. At the same time, it will be stressed that such a task can be
performed better if all of the part that is measured by the national and regional accounts is included in the study.
Thus, Section 2 presents the SAM-based approach, mainly through the words of the authors responsible for its foundation: Richard Stone and Graham Pyatt.
Section 3 begins with the identification of the duality whose recognition is considered to be of fundamental im-portance for quantitative analysis. As explained in Subsec-tion 3.1, according to that duality, SAMs can be seen as a framework both for models of how the economy works and for providing data that monitor its workings. The idea of completeness, the importance of ensuring consistency with the national and regional accounts, and their adoption as a basic source of information, are aspects that will also be in-troduced in that subsection. Applications to the Azores and Portugal in 2005 are presented in Subsection 3.2, together with a description of the underlying basic forms. On the one hand, the above-mentioned SAM will be presented (con-structed in order to serve as a database for a CGE model), which will be referred to as the CGE model database. On the other hand, a SAM will be presented that has been re-searched by the author. The differences between the CGE model database and the SAM for Portugal will also be identi-fied. Due to their size, the tables that complement and support this part of the article will be included in the Appendix.
As part of the work of recognising the above-mentioned duality, in Section 4, the concluding remarks will emphasise the idea that when the national and regional accounts (repre-senting the whole measured part of the activity of countries and regions) are adopted as the basic source of information, SAMs are able to offer a more representative framework for models of how the economy works and for providing the data that monitor its workings. On the other hand, an incom-plete adoption (at least at an aggregated level) of the infor-mation provided by the national and regional accounts will mean that important interactions, representative of the activ-ity of countries or regions, will not be considered.
2. THe SAM-BASed APPROAcH
Richard Stone and Graham Pyatt played a key role in implementing the SAM-based approach. Both worked on the conceptual details of that approach: the former worked primary distribution of income. Also identified within this
context are the risks of failing to consider important inter-actions in the activity of countries and regions, as well as the biases to be found in the analysis of the results.
Keywords: Databases for Models; National Accounts; Re-gional Accounts; Social Accounting Matrix
JEL Codes: C82, E01, R13
na atividade dos países e regiões, bem como de enviesa-mentos na análise de resultados.
Palavras-chave: Bases de Dados para Modelos; Contas Na-cionais; Contas Regionais; Matriz de Contabilidade Social
45
Measuring and Modelling the Activity of Countries and Regions with Social Accounting Matrices
Revista Portuguesa de Estudos Regionais, n.º 33, 2013, 2.º Quadrimestre more on the numerical versions of the SAM, within the
framework of a system of national accounts, while the latter worked more in algebraic terms, mainly within the scope of input-output analysis. Their work proved decisive for understanding the importance of the SAM as a meas-urement tool.
In the foreword to the book that can now be regarded as a pioneering work in terms of the SAM-based approach, “Social Accounting for Development Planning with spe-cial reference to Sri Lanka”, Richard Stone stated that the framework of the system of national accounts can be re-arranged and “the entries in a set of accounts can be pre-sented in a matrix in which, by convention (…), incomings are shown in the rows and outgoings are shown in the col-umns; and in which, reflecting the fact that accounts bal-ance, each row sum is equal to the corresponding column sum.” That matrix (with an equal number of rows and col-umns) is the SAM, in the construction of which “it may be possible to adopt a hierarchical approach, first adjusting the entries in a summary set of national accounts and then adjusting subsets of estimates to these controlling totals.” (Pyatt and Roe, 1977: xix, xxiii).
In turn, in the abstract to his article, “A SAM approach to Modeling”, Graham Pyatt says: “Given that there is an accounting system corresponding to every economic mod-el, it is useful to make the accounts explicit in the form of a SAM. Such a matrix can be used as the framework for a consistent dataset and for the representation of theory in what is called its transaction form.” In that transaction form (or TV (transaction value) form), the SAM can be seen… “as a framework for theory” and its cells…“can be filled instead with algebraic expressions, which describe in con-ceptual terms how the corresponding transaction values might be determined”. Thus, the SAM is used as “the basic framework for model presentation.” (Pyatt, 1988: 327; 337).
Looking at the question from the perspectives outlined above, it can be said that a SAM can have two versions: a numerical version, which describes the activity of a coun-try or a region, for instance, empirically; and an algebraic version, which describes that same activity theoretically. In the former version, each cell has a specific numerical value, with the sums of the rows being equal to the sums of the columns. In the latter version, each cell is filled with algebraic expressions that, together with those of all the other cells, form a SAM-based model, the calibration of which involves a replication of the numerical version.
In the words of Graham Pyatt, “the essence of (…) the SAM approach to modelling is to use the same SAM frame-work for both the empirical and the theoretical description of an economy.” (Pyatt, 1988: 337).
Therefore, supported by the above-quoted ideas, the national accounts and their underlying system will be adopted, consequently determining the SAM design and guaranteeing the (possible) credibility of the available data.
In 1953, with the first and most fundamental contri-bution written by Richard Stone, the United Nations im-plemented the System of National Accounts (SNA), which
continued to be published in successive versions until 2008 (ISWGA, 2008). This system establishes the rules for measuring the activity of countries or groups of countries, which, in turn, have been adopted and adapted to specific realities by the corresponding statistical offices.
The construction of algebraic versions – which may or may not adopt the theoretical framework underlying the SNA – can be seen, among others, in Pyatt (2001; 1988), Pyatt and Roe, (1977), Pyatt and Round (1985), Santos (2010; 2009).
This article will examine the construction of numerical versions of SAMs that either do or do not adopt the nation-al and regionnation-al accounts as basic sources of information, underlying which is the SNA.
3. cOnSTRUcTinG SAMS AS dATABASeS FOR MOdeLS
3.1. thE nAtIonAL AnD REgIonAL ACCountS AS BASIC SouRCES oF InFoRMAtIon
“A SAM is a framework both for models of how the economy works as well as for data which monitor its work-ings. Recognition of this duality is of basic importance for quantitative analysis. It implies, inter alia, that the account-ing identities which are captured by a SAM are not to be regarded simply as consistency requirements which must be imposed on a model, but rather they should be seen as a logical consequence of the paradigms which economists have adopted for analyzing society.” (Pyatt, 1991: 316). On the other hand, “the relationship between SAMs and mod-els has several aspects […] for each model there is a corre-sponding SAM. The converse does not hold, however. For any given SAM, there is a variety of possible models. The choice of the SAM restricts the choice of the models, but it does not determine it uniquely” (Pyatt, 1988: 345).
Nowadays, in the case of both developed and develop-ing market economies, the models that are conceived for studying regions and countries generally enjoy the support of consistent and credible databases. The adoption, adapta-tion and consequent improvement of the SNA have been of crucial importance in guaranteeing these conditions. This is the case with the European System of Accounts (ESA), which is the adaptation of the SNA to the European Union (see Eurostat, 1996), of which Portugal is a member. There-fore, the measured part of the economic activity of a country and its regions is periodically quantified, and the informa-tion collected is then published, providing further data for those databases. At the regional level, there are the regional accounts, which are consonant with the national accounts, although they do not yet have the same level of detail.
46 Susana Santos
Revista Portuguesa de Estudos Regionais, n.º 33, 2013, 2.º Quadrimestre the best way of guaranteeing this result. Consistent and
balanced aggregated SAMs can thus be constructed and, from them, by adopting a top-down method and using the same and/or other sources of information, it is possible to break down the accounts, represented in their rows and columns, without losing their consistency and still main-taining a certain level of completeness.
In those SAMs, constructed at either the regional or the national level, in addition to the part representing the lationship between the economy and the exterior, the re-lationships within the economy can also be represented. Two parts should be identified in the relationships with-in the economy: one representwith-ing the production process and trade (of the corresponding output, as well as of the imports); the other representing the distribution, redistri-bution and use of income. This income is the one that is domestically generated by the production process, to which is added the income that comes from the exterior. The activity sectors or industries which use the factors of production to produce goods and services or products are the direct participants in the production process and trade. In turn, the institutional sectors or institutions intervene in the distribution, redistribution and use of income through their current, capital and financial accounts.
According to the SNA and ESA, supply and use tables support the first part (production and trade of goods and services), whereas the institutional accounts support the sec-ond part (distribution, redistribution and use of income). Both support, at least in part, the quantification of the re-lationships within the domestic economy and between the domestic economy and the exterior, which in turn is sum-marised through the integrated economic accounts, in the case of countries. These are an important source of infor-mation, not only for working at a highly aggregated level, but also for confirming the consistency of the whole system.
Therefore, regardless of the purpose of each model (and the corresponding database) and the particular em-phasis that one may wish to give to one part of the econ-omy or another, it is important that those relationships and their corresponding participants are represented, at least at an aggregated level, in order to avoid the exclusion of important interactions and to prevent any bias occurring in the corresponding analysis that may be made.
For specific aspects or situations, involving certain dis-aggregations, other sources of information are needed. This is the case with those regions of the country for which supply and use tables and institutional accounts do not usually exist. In such cases, input-output matrices may be a valuable alternative source, as well as all the information that can be obtained from the local/regional governments and financial and non-financial corporations (enterprises). The following applications to the Azores and Portugal in 2005 will serve to illustrate what has been described above. Thus, square matrices will be worked upon, in which the sum of the rows is equal to the corresponding sum of the columns. In keeping with what is convention-ally accepted, and after some adjustments have been made
to adapt this to the system of national accounts, resources, incomes, receipts and changes in liabilities and net worth will be represented in the entries made in the rows, while uses, outlays, expenditures or changes in assets will be represented in the entries made in the columns.
3.2. APPLICAtIonS to thE AZoRES AnD PoRtugAL In 2005
3.2.1. The basic cGe model databases for the Azores and Portugal in 2005
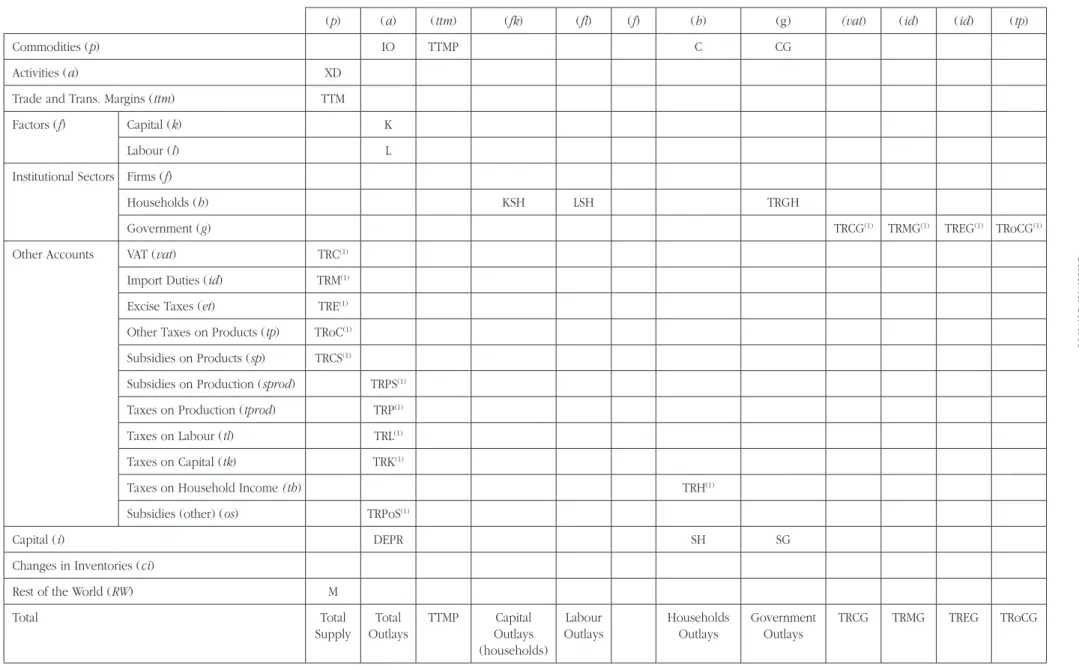
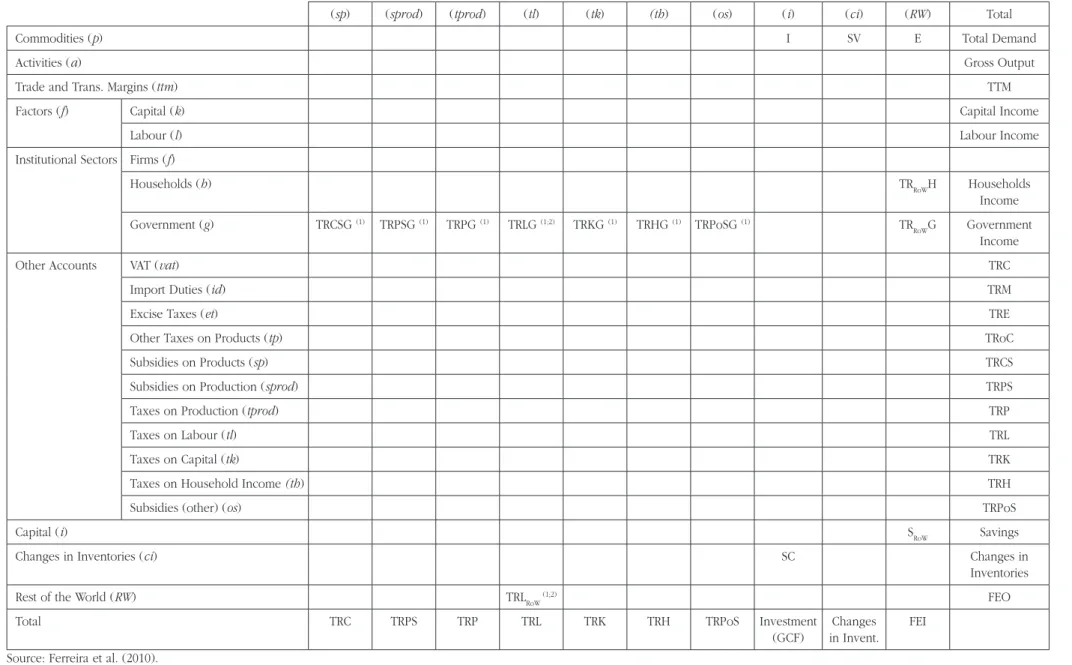
The basic structure of the CGE model databases for the Azores and Portugal in 2005, presented in Table 1, is the same as that used for the Azores in 2001, which was constructed in order to calibrate a CGE model developed under the scope of a project whose main objective was “to develop a multi-sectoral, multi-regional dynamic modelling platform of the Azores economy integrated within the Eu-ropean and global context” (Bayar et al., 2006: 3). Devel-opments of that model and its applications were published – see, for instance, CEEPplA Working Papers 2-6/ 2009 or Bayar et al. (2010a-d).
When the above-mentioned work with the basic CGE model databases for the Azores and Portugal in 2005 was begun, the only information that was made available for the author was a preliminary version entitled “Construction of the Social Accounting Matrix for the Azores”, whose au-thor is not named, and which is dated August 2007. That version was later to form part of Ferreira et al. (2010), re-leased after the conclusion of that work. It was that infor-mation and some available Excel files, identified as the basis for the work undertaken for 2001, which also formed the basis for all the work undertaken for 2005.
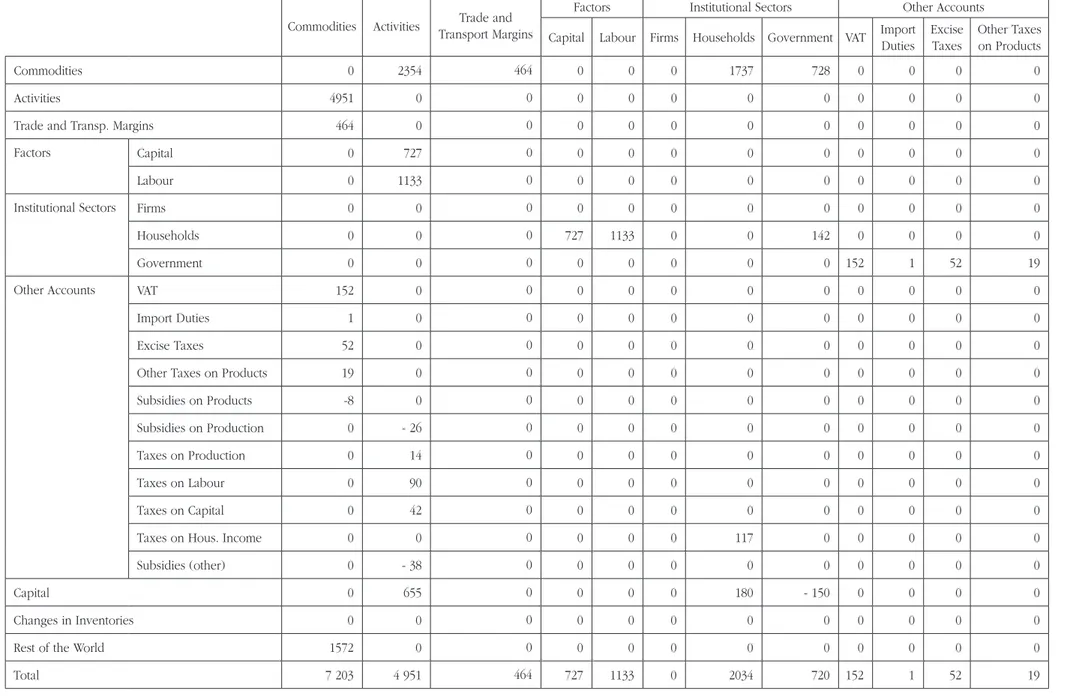
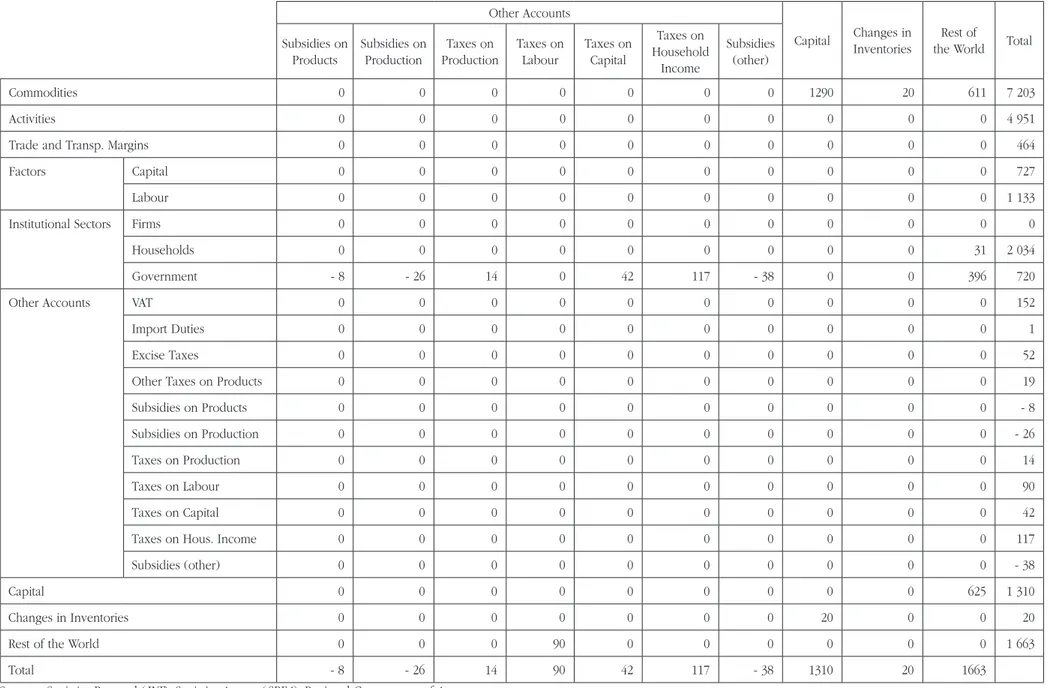
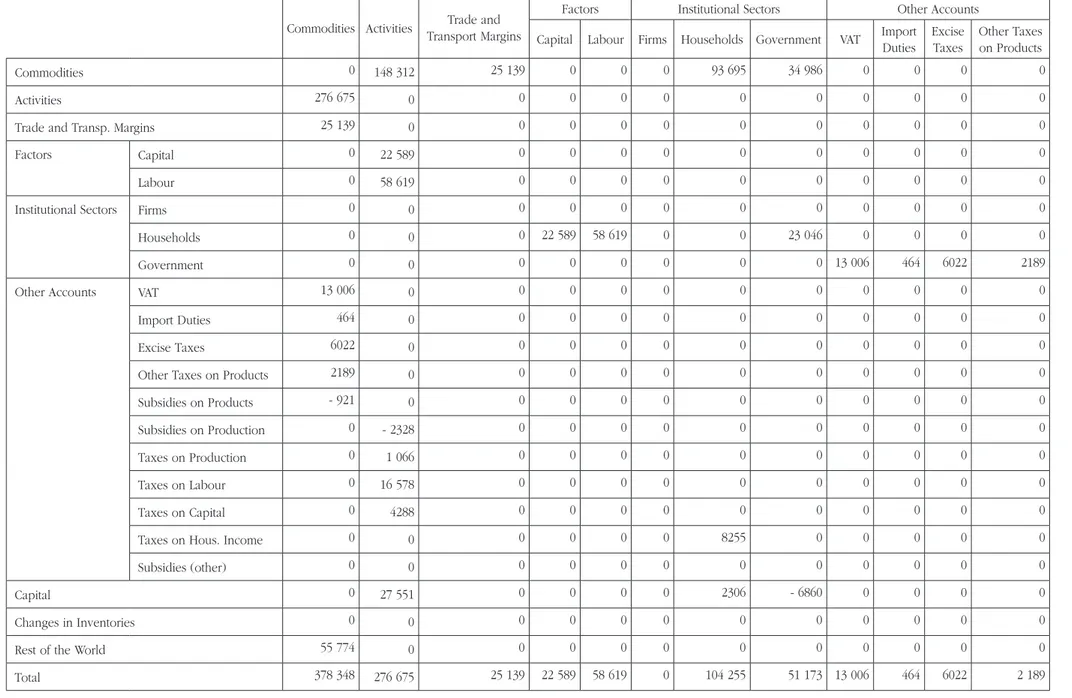
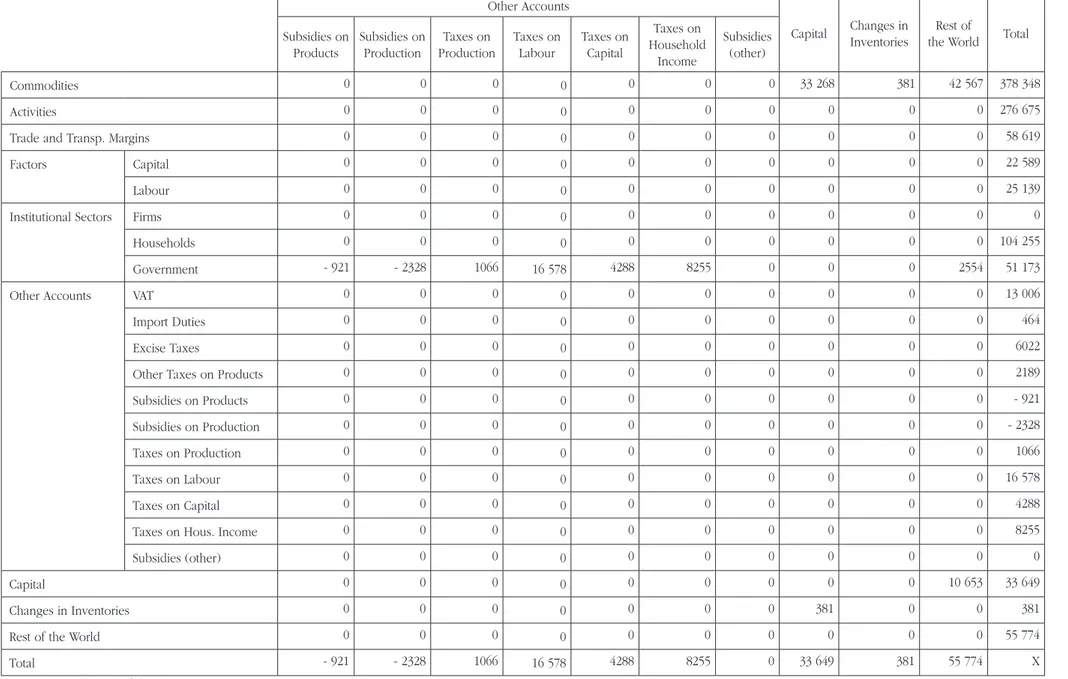
Almost all of the description in Table 1 is adapted to fit the corresponding model. This structure was adopted in its entirety for the Azores and almost totally for Portugal. In the latter case, some adaptations had to be introduced at the disaggregated level. Tables 2 and 3 are the corre-sponding numerical versions. In these numerical versions, the totals may not completely add up, due to the rounding off of some figures.
From these tables, it can be seen that the rows/col-umns are organised in the form of commodities, activities, trade and transport margins, factors (of production), stitutional sectors, other accounts, capital, changes in in-ventories, and rest of the world accounts. Except for the capital account and the changes in inventories account, all the other accounts were subdivided into yet further ac-counts, with the other accounts being exclusively related with taxes and subsidies and the institutional sectors ac-counts being related only with households and the govern-ment (in keeping with the structure of 2001, firms have a row and a column in Tables 1-3, but these are not filled).
47
Measuring and Modelling the Activity of Countries and Regions with Social Accounting Matrices
Revista Portuguesa de Estudos Regionais, n.º 33, 2013, 2.º Quadrimestre underlying the work that was undertaken are presented in
Santos (2011: 26-37).
3.2.2. A basic SAM for Portugal in 2005
The SAM that will now be presented results from the work that the author has already undertaken under the scope of the SAM-based approach, presented in Section 2. That work has been developed within a conceptual frame-work based on the frame-works of Graham Pyatt and his associ-ates (Pyatt, 1988 and 1991; Pyatt and Roe, 1977; Pyatt and Round, 1985) and has benefited from the efforts made to reconcile that framework with what has been defined by (successive versions of) the SNA (Pyatt, 1985 and 1991a; Round, 2003; Santos, 2009).
Unlike the CGE model databases presented above, this SAM was not constructed in order to calibrate a specific model. Its form derives from a particular research work in progress, which has the aim of finding a consistent and complete structure to depict the activity of a country or a region, from which it will be possible to construct several models. The author is also currently researching a model adapted to this SAM (see Santos: 2012, 2010 and 2009).
Some other characteristics that are not normally consid-ered in the CGE model databases will now be considconsid-ered here: each transaction is recorded only once in a cell of its own; the rows/columns are organised in the form of pro-duction (and trade), institutions and rest of the world ac-counts, which can be subdivided into yet further accounts; all the transactions taking place between the actors in the economic system and measured by the system of national accounts are included in the SAM, which can therefore be considered to provide a complete account of the circular flow in the economy (see, Santos, 2009: 3-8).
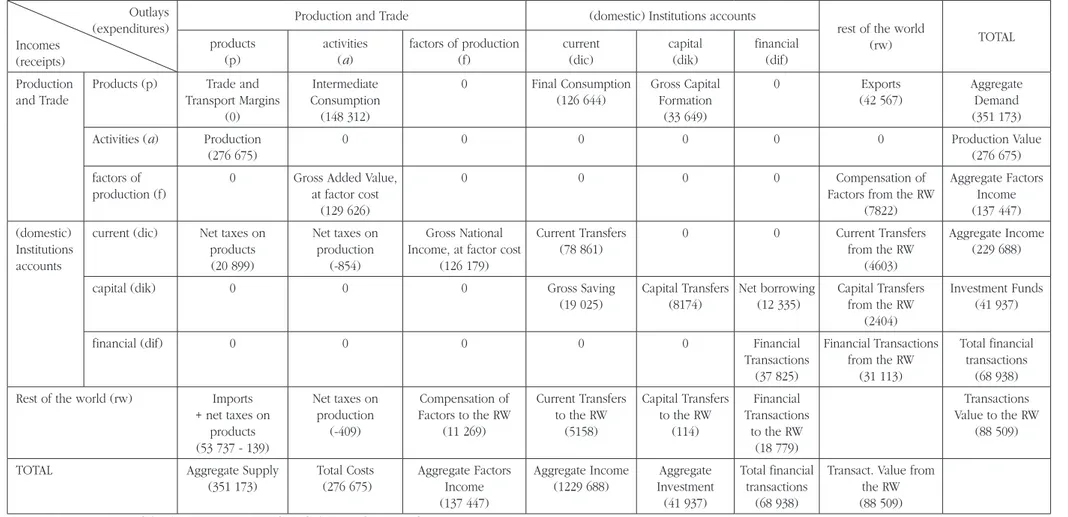
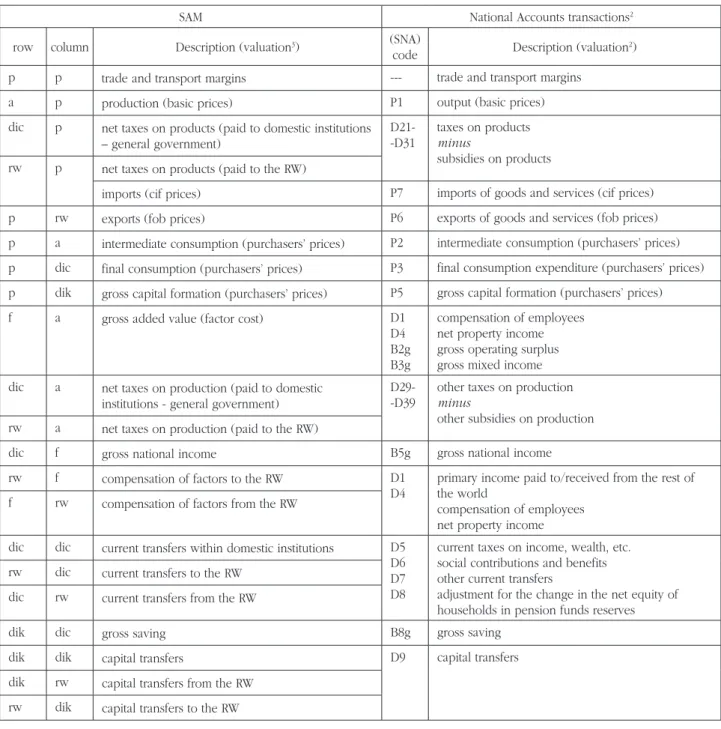
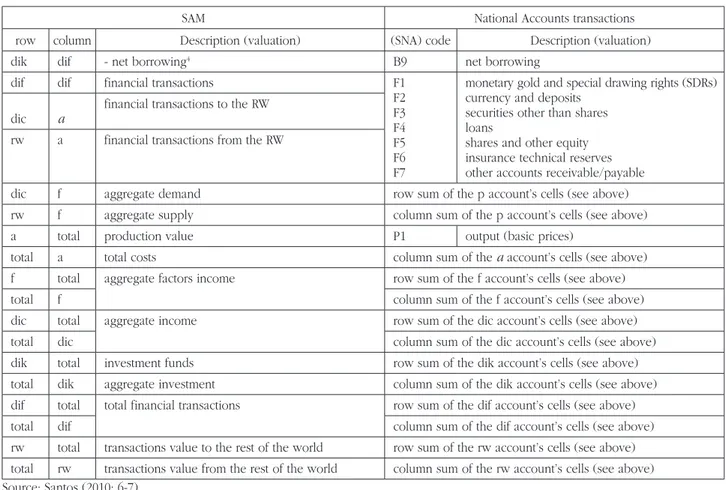
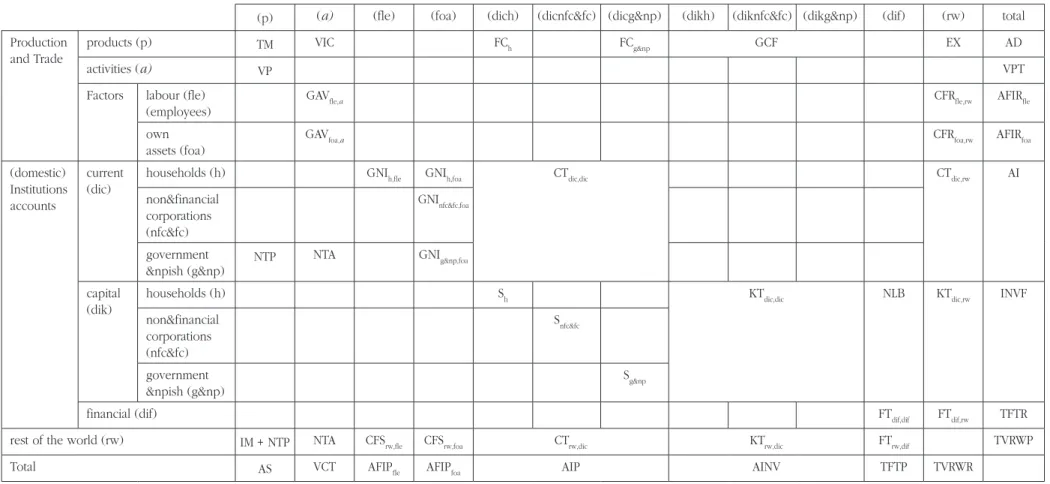
Santos (2010) works with a SAM with these character-istics for the year of this study – 2005. Table 4 is a fully aggregated version of the SAM presented in that study and the description of the cells of that same SAM can be seen in Table 5.
We therefore have a SAM that is entirely consistent with the national accounts and completely covers the activity of Portugal in 2005 measured by those accounts.
This SAM was also worked upon at some level of dis-aggregation. Thus, in the case of the domestic economy, “Production and Trade” was divided into six groups of products and activities and two factors of production. In turn, “Institutions” were divided into current, capital and financial accounts, with the last of these being a totally ag-gregate figure1, while the others were divided into
house-holds, enterprises (or non-financial corporations), financial corporations, general government and non-profit institu-tions serving households (NPISH). Besides these accounts, we also have an aggregate account for the “rest of the
1 Due to a lack of available information about the “from
whom to whom” transactions, from which the submatrices of the transactions between institutional sectors can be constructed.
world” (Santos, 2010: 2-3). From this SAM, and for the pur-pose of comparing it with the basic CGE model databases, presented in Subsection 3.2.1, the basic SAM was con-structed with the cells described in Table 6 and quantified in Table 7. In the case of Table 6, the description is adapt-ed to the model which, as has already been mentionadapt-ed, the author is currently researching.
3.2.3. differences between the basic cGe model database and the basic SAM
Bearing in mind the two ideas already mentioned, namely that, on the one hand, SAMs can be seen as a frame-work both for constructing models of how the economy works and for providing data that can be used to monitor its working, and that, on the other hand, SAMs for meas-uring and modelling the activity of countries and regions should be consistent and exhaustive regarding the national and regional accounts, the differences between the basic CGE model databases and the basic SAM were identified.
Comparing the cell contents of the above-described ba-sic forms (CGE model databases and SAM), Tables 8 and 9 identify those differences by specifying the direct and the indirect relationships, respectively. Thus, from those tables, it can be seen that the part relating to production and trade, namely the supply and demand for products, was worked upon with both the CGE model databases and the SAM, although there were clearly some differenc-es between them. The same can be said about the pri-mary distribution of income, which allowed for the use of both the CGE model databases and the SAM to iden-tify the functional and institutional distribution of income. However, the secondary distribution of income is not treat-ed so effectively by the CGE model databases. In fact, al-though, in the CGE model databases, taxes are worked upon in great detail, current and capital transfers are in-complete and financial transactions are not considered. On the other hand, although households are disaggregated by income brackets, financial and non-financial corporations are not considered explicitly, although they are implicit in the production sectors. This means that an important part of the activity which should normally be included in a model claiming to represent the activity of a region and/or a country is not considered by the CGE model databases and, consequently, by the corresponding models. Since the model and the corresponding database for 2001 was only used for the region of the Azores, the lack of available in-formation certainly contributed towards that situation.
4. cOncLUdinG ReMARKS
48 Susana Santos
Revista Portuguesa de Estudos Regionais, n.º 33, 2013, 2.º Quadrimestre Thus, if we take into account the different paradigms
and their corresponding underlying accounting identities, the full adoption of the information provided by the na-tional and regional accounts is recommended for analys-ing that work. To the extent that these accounts make it possible to work with institutions and sectors of activity, with transactions that are associated with production, and with the distribution, redistribution and use of income, in terms of economic activity as a whole, they can be con-sidered the best data that are available and provide the basic source of information from which consistency can be achieved within a SAM framework. This will mean that, when describing both the empirical and the theoretical as-pects of the activity of countries and regions, important in-teractions can be considered.
On the other hand, if we adopt sources of information other than the national and regional accounts, the disag-gregation of specific accounts does not lead to a loss in the consistency of the whole system and will make it pos-sible to work with specific aspects of the activity of coun-tries and regions, whether for measuring or for modelling purposes.
In our applications and in the corresponding compari-sons that we made at the country level (Portugal), it was possible to see that, as far as the part measured by the national accounts is concerned, the CGE model database only provided an incomplete coverage of the institution-al sectors and the secondary distribution of income. This means that, although the supply and demand for prod-ucts and the primary distribution of income were covered by the CGE model database, the description of the whole economy was incomplete, so that the results and their cor-responding analysis may be biased.
This same conclusion can be made at the regional lev-el. Even though it is known that the regional accounts are not so complete as the national accounts, an extra effort is recommended in order to harmonise them with (and even extend them to) the national accounts, as was done in the case of the application to the Azores.
A study carried out at the regional level may provide a useful method for helping the national accounts depart-ments, at their respective statistics offices, to improve and complete the results of their work.
ReFeRenceS
Bayar, A. et al. (2010a), “AzorMod: CGE Model of the Azorean Economy”, in Fortuna, M. and Rege, S. (eds.), Computable general Equilibrium Models: theory and Applications, CEEAplA (Research Centre for Applied Economics in the Atlantic), Azores, Portugal, pp. 89-120. Bayar, A. et al. (2010b), “Road Construction under Public-Private Partnership”, in Fortuna, M. and Rege, S. (eds.), Computable general Equilibrium Models: theory and Applications, CEEAplA (Research Centre for Applied Economics in the Atlantic), Azores, Portugal, pp. 185-198.
Bayar, A. et al. (2010c), “Impacts of Closure of a Military Base on a Small Island Open Economy”, in Fortuna, M. and Rege, S. (eds.), Computable general Equilibrium Models: theory and Applications, CEEAplA (Research Centre for Applied Economics in the Atlantic), Azores, Portugal, pp. 199-210.
Bayar, A. et al. (2010d), “Impacts of Tax Cuts on a Small Island Open Economy”, in Fortuna, M. and Rege, S. (eds.), Computable general Equilibrium Models: theo-ry and Applications, CEEAplA (Research Centre for Ap-plied Economics in the Atlantic), Azores, Portugal, pp. 211-219.
Bayar, A. et al. (2006), “A Computable General Equilibrium Modeling Platform for the Azorean Economy: A simple approach with international trade”, CEEAplA (Research Centre for Applied Economics in the Atlantic), Work-ing Paper No. 09/2006, Universidades dos Açores e da Madeira, 28pp.; also available at EcoMod2006 (down-loads) – International Conference on Policy Modelling, promoted by EcoMod (Global Economic Modeling Net-work). Hong-Kong (China): 28-30/6.
Eurostat (1996), “European System of Accounts (ESA 95)”, Luxembourg.
Ferreira, P. et al. (2010), “The 2001 SAM” in Fortuna, M. and Rege, S. (eds.), Computable general Equilibrium Mod-els: theory and Applications, CEEAplA (Research Centre for Applied Economics in the Atlantic), Azores, Portu-gal, pp. 121-182.
Inter-Secretariat Working Group on National Accounts – ISWGNA (2008), System of National Accounts (2008 SNA), United Nations Statistics Division and the United Nations Regional Commissions, New York; Internation-al Monetary Fund – IMF, Washington, DC; World Bank, Washington, DC; Organisation for Economic Coopera-tion and Development – OECD, Paris; Statistical Office of the European Communities – Eurostat, Brussels/Lux-embourg.
Pyatt, G. (2001), “Some Early Multiplier Models of the Relation-ship between Income Distribution and Production Struc-ture”, Economic Systems Research, Vol. 13, pp. 139-163 Pyatt, G. (1991), “Fundamentals of Social Accounting”,
Eco-nomic Systems Research, Vol. 3, pp. 315-341.
Pyatt, G. (1991a), “SAMs, the SNA and National Account-ing Capabilities”, Review of Income and wealth, Vol. 37, pp. 177-198.
Pyatt, G. (1988), “A SAM Approach to Modeling”, Journal of Policy Modeling, Vol. 10, pp. 327-352.
Pyatt, G. and Roe, A. (1977), Social Accounting for Devel-opment Planning with Special Reference to Sri Lanka, Cambridge University Press, Cambridge, 190pp. Pyatt, G. (1985), “Commodity Balances and National
Ac-counts: a SAM Perspective”, Review of Income and wealth, Vol. 31, pp. 155-169.
49
Measuring and Modelling the Activity of Countries and Regions with Social Accounting Matrices
Revista Portuguesa de Estudos Regionais, n.º 33, 2013, 2.º Quadrimestre World Bank, Washington, D.C.; also in Economic
Jour-nal, 89 (356), 1979, pp. 850-873.
Round, J. (2003), “Constructing SAMs for Development Pol-icy Analysis: Lessons Learned and Challenges Ahead”, Economic Systems Research, Vol. 15, pp. 161-183. Santos, S. (2012), “The policy decision process in a SAM
(Social Accounting Matrix) framework”. Paper present-ed to the 20th International Input-Output Conference, promoted by the IIOA (International Input-Output As-sociation), Bratislava (Slovakia), 72 pp.
Santos S. (2011), “The Underlying Database of an Instru-ment for Economic and Social Policy Analysis for the Azores. Application and Extension to 2005”, CEEAplA
(Research Centre for Applied Economics in the Atlan-tic), Working Paper No. 14/2011 – Universities of the Azores and Madeira, 52 pp.
Santos S. (2010), “A quantitative approach to the effects of social policy measures. An application to Portugal, using Social Accounting Matrices”, MPRA (Munich Per-sonal RePEc Archive), Paper No. 23676; EERI (Econom-ics and Econometr(Econom-ics Research Institute), RP (Research Papers) 2010/33, July 2010, 75 pp.
Santos S. (2009), From the System of national Accounts (SnA) to a Social Accounting Matrix (SAM)-Based Mod-el. An Application to Portugal, Edições Almedina, Coim-bra (Portugal), 194pp.
APPendiceS
KeY TO TABLe 1 (in ALPHABeTicAL ORdeR):
TRHG taxes on the households’ income received by the government
TRK taxes on capital
TRKG taxes on capital received by the government TRL taxes on wages
TRLG taxes on labour received by the government (in the case of Portugal)
TRLRoW taxes on labour received by the Mainland (in the case of the Azores)
TRM taxes on imports
TRMG taxes on imports by the government TRoC other taxes on products
TRoCG other taxes on products received by the government
TRP taxes on production
TRPG taxes on production received by the government TRPS subsidies on production
TRPSG subsidies on production paid by the government TRPoS other subsidies (in the case of the Azores) TRPoSG other subsidies paid by the government (in the
case of the Azores)
TRRoWH transfers from the rest of the world to the households
TRRoWG transfers from the rest of the world to the government
TTM trade and transport margins
TTMP trade and transport margins (part of production) XD domestic production or gross output delivered
to the domestic market and exported CG final consumption of the government
C final consumption of the households DEPR depreciation
E exports
FEI foreign exchange inflows FEO foreign exchange outflows GCF gross capital formation
I investments (gross fixed capital formation and acquisitions less disposals of valuables) IO intermediate consumption
K capital use of the sector
KSH income from capital received by the households L labour use of the sector
LSH income from labour received by the households M imports
SC total changes in inventories SH households’ savings
SG government savings
SRoW foreign savings
SV changes in inventories by commodity TRC taxes on commodities
TRCG taxes on products received by the government TRCS subsidies on products
TRCSG subsidies on products paid by the government TRE excise taxes
TREG excise taxes received by the government TRGH transfers from the government to the
households
50
Susana Santos
Revista Portuguesa de Estudos Regionais
, n.º 33, 2013, 2.º Quadrimestr
e
APPendiceS
TABLe 1. BASic cGe MOdeL dATABASe/SAM FOR THe AZOReS And PORTUGAL – deScRiPTiOn
(p) (a) (ttm) (fk) (fl) (f) (h) (g) (vat) (id) (id) (tp)
Commodities (p) IO TTMP C CG
Activities (a) XD
Trade and Trans. Margins (ttm) TTM
Factors (f) Capital (k) K
Labour (l) L
Institutional Sectors Firms (f)
Households (h) KSH LSH TRGH
Government (g) TRCG(1) TRMG(1) TREG(1) TRoCG(1)
Other Accounts VAT (vat) TRC(1)
Import Duties (id) TRM(1)
Excise Taxes (et) TRE(1)
Other Taxes on Products (tp) TRoC(1)
Subsidies on Products (sp) TRCS(1)
Subsidies on Production (sprod) TRPS(1)
Taxes on Production (tprod) TRP(1)
Taxes on Labour (tl) TRL(1)
Taxes on Capital (tk) TRK(1)
Taxes on Household Income (th) TRH(1)
Subsidies (other) (os) TRPoS(1)
Capital (i) DEPR SH SG
Changes in Inventories (ci)
Rest of the World (Rw) M
Total Total
Supply
Total Outlays
TTMP Capital Outlays (households)
Labour Outlays
Households Outlays
Government Outlays
51
Measuring and Modelling the Activity of Countries and Regions with Social Accounting Matrices
Revista Portuguesa de Estudos Regionais
, n.º 33, 2013, 2.º Quadrimestr
e
TABLe 1. BASic cGe MOdeL dATABASe/SAM FOR THe AZOReS And PORTUGAL – deScRiPTiOn (cOnTinUed)
(sp) (sprod) (tprod) (tl) (tk) (th) (os) (i) (ci) (Rw) Total
Commodities (p) I SV E Total Demand
Activities (a) Gross Output
Trade and Trans. Margins (ttm) TTM
Factors (f) Capital (k) Capital Income
Labour (l) Labour Income
Institutional Sectors Firms (f)
Households (h) TRRoWH Households
Income
Government (g) TRCSG (1) TRPSG (1) TRPG (1) TRLG (1;2) TRKG (1) TRHG (1) TRPoSG (1) TR
RoWG Government
Income
Other Accounts VAT (vat) TRC
Import Duties (id) TRM
Excise Taxes (et) TRE
Other Taxes on Products (tp) TRoC
Subsidies on Products (sp) TRCS
Subsidies on Production (sprod) TRPS
Taxes on Production (tprod) TRP
Taxes on Labour (tl) TRL
Taxes on Capital (tk) TRK
Taxes on Household Income (th) TRH
Subsidies (other) (os) TRPoS
Capital (i) SRoW Savings
Changes in Inventories (ci) SC Changes in
Inventories
Rest of the World (Rw) TRLRoW (1;2) FEO
Total TRC TRPS TRP TRL TRK TRH TRPoS Investment
(GCF)
Changes in Invent.
FEI
Source: Ferreira et al. (2010).
(1) Transactions that are considered twice in the matrix.
52
Susana Santos
Revista Portuguesa de Estudos Regionais
, n.º 33, 2013, 2.º Quadrimestr
e
TABLe 2. BASic cGe MOdeL dATABASe/SAM FOR THe AZOReS in 2005 (in 106 eUROS)
Commodities Activities Transport MarginsTrade and
Factors Institutional Sectors Other Accounts
Capital Labour Firms Households Government VAT Import Duties
Excise Taxes
Other Taxes on Products
Commodities 0 2354 464 0 0 0 1737 728 0 0 0 0
Activities 4951 0 0 0 0 0 0 0 0 0 0 0
Trade and Transp. Margins 464 0 0 0 0 0 0 0 0 0 0 0
Factors Capital 0 727 0 0 0 0 0 0 0 0 0 0
Labour 0 1133 0 0 0 0 0 0 0 0 0 0
Institutional Sectors Firms 0 0 0 0 0 0 0 0 0 0 0 0
Households 0 0 0 727 1133 0 0 142 0 0 0 0
Government 0 0 0 0 0 0 0 0 152 1 52 19
Other Accounts VAT 152 0 0 0 0 0 0 0 0 0 0 0
Import Duties 1 0 0 0 0 0 0 0 0 0 0 0
Excise Taxes 52 0 0 0 0 0 0 0 0 0 0 0
Other Taxes on Products 19 0 0 0 0 0 0 0 0 0 0 0
Subsidies on Products -8 0 0 0 0 0 0 0 0 0 0 0
Subsidies on Production 0 - 26 0 0 0 0 0 0 0 0 0 0
Taxes on Production 0 14 0 0 0 0 0 0 0 0 0 0
Taxes on Labour 0 90 0 0 0 0 0 0 0 0 0 0
Taxes on Capital 0 42 0 0 0 0 0 0 0 0 0 0
Taxes on Hous. Income 0 0 0 0 0 0 117 0 0 0 0 0
Subsidies (other) 0 - 38 0 0 0 0 0 0 0 0 0 0
Capital 0 655 0 0 0 0 180 - 150 0 0 0 0
Changes in Inventories 0 0 0 0 0 0 0 0 0 0 0 0
Rest of the World 1572 0 0 0 0 0 0 0 0 0 0 0
53
Measuring and Modelling the Activity of Countries and Regions with Social Accounting Matrices
Revista Portuguesa de Estudos Regionais
, n.º 33, 2013, 2.º Quadrimestr
e
TABLe 2. BASic cGe MOdeL dATABASe/SAM FOR THe AZOReS in 2005 (in 106 eUROS) (cOnTinUed)
Other Accounts
Capital Changes in Inventories
Rest of
the World Total Subsidies on
Products
Subsidies on Production
Taxes on Production
Taxes on Labour
Taxes on Capital
Taxes on Household
Income
Subsidies (other)
Commodities 0 0 0 0 0 0 0 1290 20 611 7 203
Activities 0 0 0 0 0 0 0 0 0 0 4 951
Trade and Transp. Margins 0 0 0 0 0 0 0 0 0 0 464
Factors Capital 0 0 0 0 0 0 0 0 0 0 727
Labour 0 0 0 0 0 0 0 0 0 0 1 133
Institutional Sectors Firms 0 0 0 0 0 0 0 0 0 0 0
Households 0 0 0 0 0 0 0 0 0 31 2 034
Government - 8 - 26 14 0 42 117 - 38 0 0 396 720
Other Accounts VAT 0 0 0 0 0 0 0 0 0 0 152
Import Duties 0 0 0 0 0 0 0 0 0 0 1
Excise Taxes 0 0 0 0 0 0 0 0 0 0 52
Other Taxes on Products 0 0 0 0 0 0 0 0 0 0 19
Subsidies on Products 0 0 0 0 0 0 0 0 0 0 - 8
Subsidies on Production 0 0 0 0 0 0 0 0 0 0 - 26
Taxes on Production 0 0 0 0 0 0 0 0 0 0 14
Taxes on Labour 0 0 0 0 0 0 0 0 0 0 90
Taxes on Capital 0 0 0 0 0 0 0 0 0 0 42
Taxes on Hous. Income 0 0 0 0 0 0 0 0 0 0 117
Subsidies (other) 0 0 0 0 0 0 0 0 0 0 - 38
Capital 0 0 0 0 0 0 0 0 0 625 1 310
Changes in Inventories 0 0 0 0 0 0 0 20 0 0 20
Rest of the World 0 0 0 90 0 0 0 0 0 0 1 663
Total - 8 - 26 14 90 42 117 - 38 1310 20 1663
54
Susana Santos
Revista Portuguesa de Estudos Regionais
, n.º 33, 2013, 2.º Quadrimestr
e
TABLe 3. BASic cGe MOdeL dATABASe/SAM FOR PORTUGAL in 2005 (in 106 eUROS)
Commodities Activities Transport MarginsTrade and
Factors Institutional Sectors Other Accounts
Capital Labour Firms Households Government VAT Import Duties
Excise Taxes
Other Taxes on Products
Commodities 0 148 312 25 139 0 0 0 93 695 34 986 0 0 0 0
Activities 276 675 0 0 0 0 0 0 0 0 0 0 0
Trade and Transp. Margins 25 139 0 0 0 0 0 0 0 0 0 0 0
Factors Capital 0 22 589 0 0 0 0 0 0 0 0 0 0
Labour 0 58 619 0 0 0 0 0 0 0 0 0 0
Institutional Sectors Firms 0 0 0 0 0 0 0 0 0 0 0 0
Households 0 0 0 22 589 58 619 0 0 23 046 0 0 0 0
Government 0 0 0 0 0 0 0 0 13 006 464 6022 2189
Other Accounts VAT 13 006 0 0 0 0 0 0 0 0 0 0 0
Import Duties 464 0 0 0 0 0 0 0 0 0 0 0
Excise Taxes 6022 0 0 0 0 0 0 0 0 0 0 0
Other Taxes on Products 2189 0 0 0 0 0 0 0 0 0 0 0
Subsidies on Products - 921 0 0 0 0 0 0 0 0 0 0 0
Subsidies on Production 0 - 2328 0 0 0 0 0 0 0 0 0 0
Taxes on Production 0 1 066 0 0 0 0 0 0 0 0 0 0
Taxes on Labour 0 16 578 0 0 0 0 0 0 0 0 0 0
Taxes on Capital 0 4288 0 0 0 0 0 0 0 0 0 0
Taxes on Hous. Income 0 0 0 0 0 0 8255 0 0 0 0 0
Subsidies (other) 0 0 0 0 0 0 0 0 0 0 0 0
Capital 0 27 551 0 0 0 0 2306 - 6860 0 0 0 0
Changes in Inventories 0 0 0 0 0 0 0 0 0 0 0 0
Rest of the World 55 774 0 0 0 0 0 0 0 0 0 0 0
55
Measuring and Modelling the Activity of Countries and Regions with Social Accounting Matrices
Revista Portuguesa de Estudos Regionais
, n.º 33, 2013, 2.º Quadrimestr
e
TABLe 3. BASic cGe MOdeL dATABASe/SAM FOR PORTUGAL in 2005 (in 106 eUROS) (cOnTinUed)
Other Accounts
Capital Changes in Inventories
Rest of
the World Total Subsidies on
Products
Subsidies on Production
Taxes on Production
Taxes on Labour
Taxes on Capital
Taxes on Household
Income
Subsidies (other)
Commodities 0 0 0 0 0 0 0 33 268 381 42 567 378 348
Activities 0 0 0 0 0 0 0 0 0 0 276 675
Trade and Transp. Margins 0 0 0 0 0 0 0 0 0 0 58 619
Factors Capital 0 0 0 0 0 0 0 0 0 0 22 589
Labour 0 0 0 0 0 0 0 0 0 0 25 139
Institutional Sectors Firms 0 0 0 0 0 0 0 0 0 0 0
Households 0 0 0 0 0 0 0 0 0 0 104 255
Government - 921 - 2328 1066 16 578 4288 8255 0 0 0 2554 51 173
Other Accounts VAT 0 0 0 0 0 0 0 0 0 0 13 006
Import Duties 0 0 0 0 0 0 0 0 0 0 464
Excise Taxes 0 0 0 0 0 0 0 0 0 0 6022
Other Taxes on Products 0 0 0 0 0 0 0 0 0 0 2189
Subsidies on Products 0 0 0 0 0 0 0 0 0 0 - 921
Subsidies on Production 0 0 0 0 0 0 0 0 0 0 - 2328
Taxes on Production 0 0 0 0 0 0 0 0 0 0 1066
Taxes on Labour 0 0 0 0 0 0 0 0 0 0 16 578
Taxes on Capital 0 0 0 0 0 0 0 0 0 0 4288
Taxes on Hous. Income 0 0 0 0 0 0 0 0 0 0 8255
Subsidies (other) 0 0 0 0 0 0 0 0 0 0 0
Capital 0 0 0 0 0 0 0 0 0 10 653 33 649
Changes in Inventories 0 0 0 0 0 0 0 381 0 0 381
Rest of the World 0 0 0 0 0 0 0 0 0 0 55 774
Total - 921 - 2328 1066 16 578 4288 8255 0 33 649 381 55 774 X
56
Susana Santos
Revista Portuguesa de Estudos Regionais
, n.º 33, 2013, 2.º Quadrimestr
e
TABLe 4. PORTUGUeSe MAcRO SAM FOR 2005 (in 106 eUROS)
Outlays (expenditures) Incomes
(receipts)
Production and Trade (domestic) Institutions accounts
rest of the world
(rw) TOTAL
products (p)
activities (a)
factors of production (f) current (dic) capital (dik) financial (dif) Production and Trade
Products (p) Trade and Transport Margins
(0)
Intermediate Consumption (148 312)
0 Final Consumption (126 644) Gross Capital Formation (33 649) 0 Exports (42 567) Aggregate Demand (351 173)
Activities (a) Production (276 675)
0 0 0 0 0 0 Production Value
(276 675)
factors of production (f)
0 Gross Added Value, at factor cost
(129 626)
0 0 0 0 Compensation of
Factors from the RW (7822) Aggregate Factors Income (137 447) (domestic) Institutions accounts
current (dic) Net taxes on products (20 899)
Net taxes on production
(-854)
Gross National Income, at factor cost
(126 179)
Current Transfers (78 861)
0 0 Current Transfers
from the RW (4603)
Aggregate Income (229 688)
capital (dik) 0 0 0 Gross Saving
(19 025) Capital Transfers (8174) Net borrowing (12 335) Capital Transfers from the RW
(2404)
Investment Funds (41 937)
financial (dif) 0 0 0 0 0 Financial
Transactions (37 825)
Financial Transactions from the RW
(31 113)
Total financial transactions
(68 938)
Rest of the world (rw) Imports + net taxes on
products (53 737 - 139)
Net taxes on production
(-409)
Compensation of Factors to the RW
(11 269)
Current Transfers to the RW
(5158)
Capital Transfers to the RW
(114)
Financial Transactions
to the RW (18 779)
Transactions Value to the RW
(88 509)
TOTAL Aggregate Supply
(351 173) Total Costs (276 675) Aggregate Factors Income (137 447) Aggregate Income (1229 688) Aggregate Investment (41 937) Total financial transactions (68 938)
57
Measuring and Modelling the Activity of Countries and Regions with Social Accounting Matrices
Revista Portuguesa de Estudos Regionais, n.º 33, 2013, 2.º Quadrimestre
TABLe 5. nATiOnAL AccOUnTS TRAnSAcTiOnS in THe ceLLS OF THe MAcRO SAM23
SAM National Accounts transactions2
row column Description (valuation3) (SNA)
code Description (valuation2)
p p trade and transport margins --- trade and transport margins
a p production (basic prices) P1 output (basic prices)
dic p net taxes on products (paid to domestic institutions – general government)
D21--D31
taxes on products minus
subsidies on products rw p net taxes on products (paid to the RW)
imports (cif prices) P7 imports of goods and services (cif prices)
p rw exports (fob prices) P6 exports of goods and services (fob prices)
p a intermediate consumption (purchasers’ prices) P2 intermediate consumption (purchasers’ prices) p dic final consumption (purchasers’ prices) P3 final consumption expenditure (purchasers’ prices) p dik gross capital formation (purchasers’ prices) P5 gross capital formation (purchasers’ prices)
f a gross added value (factor cost) D1
D4 B2g B3g
compensation of employees net property income gross operating surplus gross mixed income dic a net taxes on production (paid to domestic
institutions - general government)
D29--D39
other taxes on production minus
other subsidies on production rw a net taxes on production (paid to the RW)
dic f gross national income B5g gross national income
rw f compensation of factors to the RW D1
D4
primary income paid to/received from the rest of the world
compensation of employees net property income f rw compensation of factors from the RW
dic dic current transfers within domestic institutions D5 D6 D7 D8
current taxes on income, wealth, etc. social contributions and benefits other current transfers
adjustment for the change in the net equity of households in pension funds reserves rw dic current transfers to the RW
dic rw current transfers from the RW
dik dic gross saving B8g gross saving
dik dik capital transfers D9 capital transfers
dik rw capital transfers from the RW rw dik capital transfers to the RW
2 Transactions at the first level of disaggregation, in accordance with the European System of National and Regional Accounts in the
Eu-ropean Community of 1995 – ESA 95 (Eurostat, 1996) – which is itself based on the 1993 version of the International United Nations System of National Accounts – SNA 93 – prepared by the Inter-Secretariat Working Group on National Accounts and published by the United Na-tions Statistical Office (ISWGNA, 1993). Group on National Accounts and published by the United NaNa-tions Statistical Office (ISWGNA, 1993).
3 In the transactions represented by the cells whose row and/or column denotes production accounts, the following types of valuation
are identified: fator cost; basic, cif and fob prices; purchasers’ or market prices.
Fator cost represents the compensation of the factors, or the primary incomes, arising from the labour and capital used in the pro-duction process of the domestic economy, excluding taxes on propro-duction and imports (taxes on products and other propro-duction taxes) and subsidies (subsidies on products and other subsidies on production).
58 Susana Santos
Revista Portuguesa de Estudos Regionais, n.º 33, 2013, 2.º Quadrimestre
TABLe 5. nATiOnAL AccOUnTS TRAnSAcTiOnS in THe ceLLS OF THe MAcRO SAM (cOnTinUed)
SAM National Accounts transactions
row column Description (valuation) (SNA) code Description (valuation)
dik dif - net borrowing4 B9 net borrowing
dif dif financial transactions F1
F2 F3 F4 F5 F6 F7
monetary gold and special drawing rights (SDRs) currency and deposits
securities other than shares loans
shares and other equity insurance technical reserves other accounts receivable/payable
dic a
financial transactions to the RW rw a financial transactions from the RW
dic f aggregate demand row sum of the p account’s cells (see above)
rw f aggregate supply column sum of the p account’s cells (see above)
a total production value P1 output (basic prices)
total a total costs column sum of the a account’s cells (see above)
f total aggregate factors income row sum of the f account’s cells (see above)
total f column sum of the f account’s cells (see above)
dic total aggregate income row sum of the dic account’s cells (see above)
total dic column sum of the dic account’s cells (see above)
dik total investment funds row sum of the dik account’s cells (see above)
total dik aggregate investment column sum of the dik account’s cells (see above) dif total total financial transactions row sum of the dif account’s cells (see above)
total dif column sum of the dif account’s cells (see above)
rw total transactions value to the rest of the world row sum of the rw account’s cells (see above) total rw transactions value from the rest of the world column sum of the rw account’s cells (see above) Source: Santos (2010: 6-7).
KeY TO TABLe 6 (in ALPHABeTicAL ORdeR):
AD value of aggregate demand AFIP aggregate factors income (paid) AFIR aggregate factors income (received) AI aggregate income (received) AINV aggregate investment AIP aggregate income (paid) AS aggregate supply
CFR compensation of the factors of production received from the rest of the world CFS compensation of the factors of production
sent to the rest of the world CT current transfers
EX value of exports
FC value of final consumption FT financial transactions GAV gross added value
GCF value of gross capital formation
4 In the National Accounts, the net lending (+) or borrowing (-) of the total economy is the sum of the net lending or borrowing of the
institutional sectors. It represents the net resources that the total economy makes available to the rest of the world (if positive) or receives from the rest of the world (if negative). The net lending (+) or borrowing (-) of the total economy is equal, but with an opposite mathe-matical sign, to the net borrowing (-) or lending (+) of the rest of the world (Eurostat, 1996: paragraph 8.98).
In the SAM’s capital account, net lending or borrowing is considered to be a component of the investment funds required/not re-quired to cover the aggregate investment. In other words, it is the financing requirement/capacity of the economy that will be covered/ absorbed by financial transactions (from/to the rest of the world, since the national funds are not enough/in excess). Therefore, if there is net borrowing, we have a financing requirement that is covered by financial transactions, i.e. a resource of the capital account (row) and a use of the financial account (column). If there is net lending, we have financing capacity that is absorbed by financial transactions, i.e. a resource of the financial account (row) and a use of the capital account (column).
GNI gross national income IM value of imports INVF investment funds KT capital transfers NLB net lending / borrowing NTA net taxes on production NTP net taxes on products S gross saving
TFTP total financial transactions (paid) TFTR total financial transactions (received) TM trade and transport margins
TVRWP value of transactions to the rest of the world TVRWR value of transactions from the rest of the world VCT value of total costs
VIC value of intermediate consumption VP value of production
59
Measuring and Modelling the Activity of Countries and Regions with Social Accounting Matrices
Revista Portuguesa de Estudos Regionais
, n.º 33, 2013, 2.º Quadrimestr
e
TABLe 6. BASic SAM FOR PORTUGAL – deScRiPTiOn
(p) (a) (fle) (foa) (dich) (dicnfc&fc) (dicg&np) (dikh) (diknfc&fc) (dikg&np) (dif) (rw) total
Production and Trade
products (p) TM VIC FCh FCg&np GCF EX AD
activities (a) VP VPT
Factors labour (fle) (employees)
GAVfle,a CFRfle,rw AFIRfle
own assets (foa)
GAVfoa,a CFRfoa,rw AFIRfoa
(domestic) Institutions accounts
current (dic)
households (h) GNIh,fle GNIh,foa CTdic,dic CTdic,rw AI
non&financial corporations (nfc&fc)
GNInfc&fc,foa
government &npish (g&np)
NTP NTA GNIg&np,foa
capital (dik)
households (h) Sh KTdic,dic NLB KTdic,rw INVF
non&financial corporations (nfc&fc)
Snfc&fc
government &npish (g&np)
Sg&np
financial (dif) FTdif,dif FTdif,rw TFTR
rest of the world (rw) IM+ NTP NTA CFSrw,fle CFSrw,foa CTrw,dic KTrw,dic FTrw,dif TVRWP
Total AS VCT AFIPfle AFIPfoa AIP AINV TFTP TVRWR
60
Susana Santos
Revista Portuguesa de Estudos Regionais
, n.º 33, 2013, 2.º Quadrimestr
e
TABLe 7. BASic SAM FOR PORTUGAL in 2005 (in 106 eUROS)
(p) (a) (fle) (foa) (dich) (dicnfc&fc) (dicg&np) (dikh) (diknfc&fc) (dikg&np) (dif) (rw) total
Production and Trade
products (p) 0 148 312 93 695 34 986 33 648 42 576 353 210
activities (a) 276 675 276 675
Factors labour (fle) (employees)
75 358 189 75 547
own assets (foa)
54 267 7633 61 900
(domestic) Institutions accounts
current (dic)
households (h) 75 198 31 058 78 861 4603 229 688
non&financial corporations (nfc&fc)
20 899 - 854 19 646
government &npish (g&np)
277
capital (dik)
households (h) 9544 8174 12 335 2404 41 937
non&financial corporations (nfc&fc)
13 956
government &npish (g&np)
- 4475
financial (dif) 37 825 31 113 68 938
rest of the world (rw) 55 774
- 139
- 409 350 10 919 5158 114 18 779 88 509
Total 353 209 276 675 75 547 61 900 229 688 41 937 68 938 88 509
61
Measuring and Modelling the Activity of Countries and Regions with Social Accounting Matrices
Revista Portuguesa de Estudos Regionais
, n.º 33, 2013, 2.º Quadrimestr
e
TABLe 8. ceLLS OF THe BASic cGe MOdeL dATABASe diRecTLY ReLATed WiTH THe ceLLS OF THe BASic SAM – PORTUGAL in 2005 (in 106 eUROS)
(A) CGE Database/SAM (B) SAM National Accounts Transactions (A)-(B)
Cell (row, column)
Value
(106 Euros) Description
Cell (row, column)
Value
(106 Euros) Description
(SNA)
code Description (valuation)
Value
(106 Euros) Description
(p, ttm) 25 139 TTMP: Trade and Transport Margins (part of Production)
(p,p) 0 TM: Trade and Transport Margins
--- trade and transport margins
25 139 TM = TTMP - TTM
(ttm,p) 25 139 TTM: Trade and Transport Margins
25 139
(a,p) 276 675 XD: Domestic production (a,p) 276 675 VP: Value of Production P1 output (basic prices) 0
---(p,a) 148 312 IO: Intermediate consumption
(p,a) 148 312 VIC: Value of Inter mediate Consumption
P2 intermediate consumption (purchasers’ prices)
0
---(p,h) 93 695 C: Final Consumption of the households
(p,dich) 93 695 FCh: Value of Final Consumption of the households
P3 final consumption expenditure (purchasers’ prices)
0
---(p,g) 34 986 CG: Final Consumption of the Government
(p, dicg&np) 34 986 FCg&np: Value of Final Consumption of the government&npish
0
---(p,i) 33 268 I: Investments (gross fixed capital formation and acquisitions less disposals of valuables)
(p,dik) 33 648 GCF: Value of Gross Capital Formation
P5 gross capital formation (purchasers’ prices)
0 GCF = I+SV; GCF = I+SC
(p,ci) 381 SV: Changes in inventories by commodity
(ci,i) 381 SC: Total changes in inventories
(p,rw) 42 576 E: Exports (p,rw) 42 576 EX: value of Exports P6 exports of goods and services (fob prices)
0
---(rw,p) 55 774 M: Imports (rw,p) (part) 55 774 IM: value of Imports P7 imports of goods and services (cif prices)
0
---(i,h) 2 306 SH: Households Savings (dikh,dich) 9544 Sh: gross Saving of the households
B8g gross saving - 7 238 (A) does not con-sider the part of the current and capital transfers, which are, respectively, a component of the disposable income of domestic institu-tions and of investment funds. However, this gap is filled by DEPR.
(i,a) 27 551 DEPR (diknfc&fc,
dicnfc&fc)
13 956 Snfc&fc: gross Saving of non&financial corporations
- 13 594
(i,g) - 6860 SG: Government Savings (dikg&np, dicg&np)
- 4475 Sg&np: gross Saving of the government&npish
- 2 385
(i,rw) 10 653 SRoW: Foreign Savings (dik,dif) 12 335 NLB: net lending / borrowing
\B9 net lending (+) / borrowing (-)
62
Susana Santos
Revista Portuguesa de Estudos Regionais
, n.º 33, 2013, 2.º Quadrimestr
e
TABLe 8. ceLLS OF THe BASic cGe MOdeL dATABASe diRecTLY ReLATed WiTH THe ceLLS OF THe BASic SAM – PORTUGAL in 2005 (in 106 eUROS) (cOnTinUed)
(A) CGE Database/SAM (B) SAM National Accounts Transactions (A)-(B)
Cell (row, column)
Value
(106 Euros) Description
Cell (row, column)
Value
(106 Euros) Description
(SNA)
code Description (valuation)
Value
(106 Euros) Description
(vat, p) 13 006 TRC: Taxes on products (dicg&np,p) 20 899 NTP: net taxes on
products (paid to the Portuguese government and to the European Union Institutions, or the rest of the world)
D21- D31
taxes on products
minus
subsidies on products
0 NTP =
= TRC+TRM+ TRE +TRoC + TRCS
= TRCG+TRMG +TREG+ TRoCG + TRCSG
(A) does not distinguish between who really receives the taxes and who pays the subsidies on products.
(g, vat) TRCG: Taxes on products
received by the government
(id, p) 464 TRM: Taxes on imports
(g, id) TRMG: Taxes on imports received by the government
(et, p) 6022 TRE: Excise taxes
(g, et) TREG: Excise taxes received by the government
(tp, p) 2189 TRoC: Other taxes on
products
(g, tp) TRoCG: Other taxes on
products received by the government
(sp, p) - 921 TRCS: Subsidies on products
(g,sp) TRCSG: Subsidies on
products paid by the government
(rw,p) (part) - 139
(sprod, a) - 2 328 TRPS: Subsidies on
production
(dicg&np, a) - 854 NTA: net taxes on production (paid to the Portuguese government and to the European Union Institutions, or the rest of the world)
D29--D39
other taxes on production
minus
other subsidies on production
0 NTA = = TRPS + TRP = TRPSG+TRPG (A) does not distinguish between who really receives the taxes and who pays the subsidies on production.
(g, sprod) TRPSG: Subsidies on
production paid by the government
(tprod, a) 1 066 TRP: Taxes on production
(g, tprod) TRPG: Taxes on production
received by the government
(rw,a) - 409
63
Measuring and Modelling the Activity of Countries and Regions with Social Accounting Matrices
Revista Portuguesa de Estudos Regionais
, n.º 33, 2013, 2.º Quadrimestr
e
TABLe 9. ceLLS OF THe BASic cGe MOdeL dATABASe indiRecTLY ReLATed WiTH THe ceLLS OF THe BASic SAM – PORTUGAL in 2005 (in 106 eUROS)
(A) CGE Database/SAM (B) SAM (A)-(B)
Cell (row, column)
Value
(106 Euros) Description
National Accounts
Transactions Cell (row, column)
Value
(106 Euros) Description
National Accounts
Transactions Value (106
Euros)
Description (SNA)
code
Description (valuation)
(SNA) code
Description (valuation)
(tl, a) 16 578 TRL: Taxes on
wages
D12 (D61)
employers’ social contributions (social contributions)
(fle, a) 75 358 GAVfle,a: gross added value (factor cost), part of compensation of employees paid by the activities
D1 (=D11 +D12)
compensation of employees
0 GNIh,fle = TRL + L = TRLG + LSH
(g, tl) TRLG: Taxes on
labour received by the government
(dich, fle) 75 198 GNIh,fle: gross national income, part of compensation of employees received by households
(l, a) 58 619 L: Labour use of the sector
D11 wages and salaries
(rw,fle) 350 CFSrw,fle: compensation of employees paid to the rest of the world
- 161 CFRfle,RW - CFSrw,fle
GAVfle,a + (CFRfle,RW - CFSrw,fle) = TRL + L = TRLG + LSH
(h, fl) LSH: Income from
labour received by the households
(fle, rw) 189 CFRfle,RW: compensation of employees received from the rest of the world
(k, a) 22 589 K: Capital use of the setor
B3g gross mixed income
(foa, a) 54 267 GAVfoa,a: gross added value (factor cost), part compensation of own account workers and capital paid by the activities
B3g
B2g
D4
gross mixed income gross operating surplus
net property income
- 31 678 B3g+D4(net)
(h, fk) KSH: Income from
capital received by the households
(dich, foa) 31 058 GNI: gross national income, received by households and other institutions
- 19 646
-- -- -- -- -- (dicnfc&fc,
foa)
19 646 - 19 646 (A) does not consider this
item
-- -- -- -- -- (dicg&np,
foa)
277 - 277
-- -- -- -- -- (foa, rw) 7633 CFRfoa,RW: compensation
capital paid to the rest of the world
D4 property income - 7633
-- -- -- -- -- (rw, foa) 10 919 CFSrw,foa: compensation capital
received from the rest of the world
64
Susana Santos
Revista Portuguesa de Estudos Regionais
, n.º 33, 2013, 2.º Quadrimestr
e
TABLe 9. ceLLS OF THe BASic cGe MOdeL dATABASe indiRecTLY ReLATed WiTH THe ceLLS OF THe BASic SAM – PORTUGAL in 2005 (in 106 eUROS) (cOnTinUed)
(A) CGE Database/SAM (B) SAM (A)-(B)
Cell (row, column)
Value
(106 Euros) Description
National Accounts
Transactions Cell (row, column)
Value
(106 Euros) Description
National Accounts
Transactions Value (106
Euros)
Description (SNA)
code
Description (valuation)
(SNA) code
Description (valuation)
(th, h) 8255 TRH: Taxes on the
households’ income
D5 current taxes on income, wealth, etc.
(dic, dic) 78 861 CT: current transfers D5 current taxes on income, wealth, etc.
a) current transfers involving institutions other than households and government are not considered in (A)
b) in the current transfers with the rest of the world, (A) only considers a part of the transfers recorded from the rest of the world to the government
c) a part of the current transfers between government and households is not considered in (A)
(g, th) TRHG: Taxes on
the households’ income received by the government
D6 = D61 + D62 + D63
social contributions and benefits = social contributions + social benefits other than social transfers in kind + social transfers in kind
(tk, a) 4288 TRK: Taxes on
capital
(g, tk) TRKG: Taxes on
capital received by the government
D7 other current transfers
(h, g) 23 046 TRGH: Transfers from the
government to the households
D62 social benefits other than social transfers in kind
(rw, dic) 5158 D8 adjustment for the
change in the net equity of households in pension funds reserves
D7 other current transfers
(dic, rw) 4603
(g,rw) 2554 TRRoWG: Transfers from the rest of the world to the government
D92 investment grants
(dik, dik) 8174 KT: capital transfers D9 = D91 + D92 + D99
capital transfers = capital taxes + investment grants + other capital transfers
a) capital transfers involving
institutions other than households and government are not considered in (A)
b) in the capital transfers with the rest of the world, (A) only considers a part of the transfers recorded from the rest of the world to the government D99 other capital
transfers
(rw, dik) 114
(dik, rw) 2404
(dif, dif) 37 825 FT: financial transactions F1-7 financial transactions (A) does not consider financial transactions.
(dif, rw) 31 113