F
INANÇAS
T
RABALHO
F
INAL DE
M
ESTRADO
D
ISSERTAÇÃOH
OW DOESW
ORKINGC
APITALM
ANAGEMENT AFFECTF
IRMS´
P
ROFITABILITY?
–
E
VIDENCE FROMP
ORTUGALD
IOGOF
ILIPEN
ASCIMENTOG
OMESF
INANÇAS
T
RABALHO
F
INAL DE
M
ESTRADO
D
ISSERTAÇÃOH
OW DOESW
ORKINGC
APITALM
ANAGEMENT AFFECTF
IRMS´
P
ROFITABILITY?
–
E
VIDENCE FROMP
ORTUGALD
IOGOF
ILIPEN
ASCIMENTOG
OMESO
RIENTAÇÃO:
PROFESSORA DOUTORA ANA ISABEL ORTEGA VENÂNCIO
i
ABSTRACT
The purpose of this study is to analyze the relationship between working capital management (WCM) and firm’s profitability for Portugal. We use a database, combining firm-level financial data with a matched employer-employee data, for the period from 2004 to 2009, obtaining a sample of 106,961 observations corresponding to 41,536 firms. Like previous studies, we examine the existence of a non-linear relationship between WCM and firm’s profitability. Unlike them, we evaluate how the non-linear relationship is affected by CEO’s demographic and educational characteristics and firm’s characteristics such as age, size, industry sector and location.
The relationship between WCM and profitability is analyzed using panel data methodology, applying Fixed Effects model with robust standard errors.
Our results show that there is a concave relationship between WCM and profitability, indicating that firms have an optimal working capital level where firms should stand to maximize profitability. For CEO’s characteristics these are positively related with profitability, showing that male, Portuguese, older and with higher educational level CEOs have more profitable firms. The age, size, industry and location of firms affect the optimal WCM level that maximizes profitability. For firms, with the WCM level below the optimal point, in order to increase profitability, should increase the investment in WCM, once there is a positive relation between the two variables for low levels of working capital.
JEL classification: G30; G31; G32; L26; M10
ii
RESUMO
Este estudo examina a relação entre working capital management (WCM) e a rentabilidade das empresas em Portugal. Recorremos a uma base de dados, que combina informação financeira das empresas com dados do empregado-empregador, para o período de 2004 a 2009, obtendo uma amostra de 106,961 observações num total de 41,536 empresas. Tal como em outros estudos, examinamos a existência de uma relação não-linear entre WCM e a rentabilidade, mas também como a relação não-linear é afectada pelas características demográficas e educacionais do CEO e da empresa, de acordo com a idade, a dimensão, o sector industrial e a localização.
A relação entre o WCM e a rentabilidade é testada através da metodologia panel data, aplicando modelo Efeitos Fixos com resíduos padronizados robustos.
Os resultados demonstram a existência de uma relação côncava entre WCM e a rentabilidade, indicando a existência de um nível óptimo de investimento em working capital que permite maximizar a rentabilidade. As características demográficas e educacionais do CEO estão positivamente relacionadas com a rentabilidade das empresas, onde CEOs masculinos, Portugueses, de maior idade e com maior nível educacional apresentam empresas mais lucrativas. A idade, dimensão, industria e localização influencia o nível óptimo de WCM que maximiza a rentabilidade. Assim, para empresas com um nível de WCM inferior ao óptimo, por forma a aumentar a rentabilidade devem aumentar o investimento em WCM dado a existência de uma relação positiva entre as variáveis para baixos níveis de working capital.
Classificação do JEL: G30; G31; G32; L26; M10
iii
ACKNOWLEDGMENTS
I am grateful to many people for help, both direct and indirect, in writing this dissertation.
First of all, I would like to thank my supervisor, Prof. Ana Venâncio, for all the support, advice and guidance. Her contributions to the development of this research, both in terms of intellectual insight and comments were essentials for the success of this paper.
Secondly, my warmest thanks to my family and closest friends for all the support, love and encouragement.
iv
TABLE OF CONTENTS
ABSTRACT ... i
RESUMO ... ii
ACKNOWLEDGMENTS ... iii
TABLE OF CONTENTS ... iv
LIST OF FIGURES ... v
LIST OF TABLES ... v
1. INTRODUCTION ... 1
2. LITERATURE REVIEW ... 4
2.1. Working Capital Management and Firm Value ... 5
2.2. Working Capital Management Policies and Firm Profitability ... 6
2.3. Determinants of Working Capital Management ... 9
3. THEORY AND HYPOTHESES ... 14
4. DATA AND DESCRIPTIVE STATISTICS ... 17
4.1. Sample and Data Description ... 17
4.2. Variables Description ... 18
4.3. Descriptive Statistics ... 19
5. EMPIRICAL METHODOLOGY AND RESULTS ... 22
5.1. Regression Analysis ... 24
6. CONCLUSION ... 37
7. BIBLIOGRAPHY ... 40
v
LIST OF FIGURES
Figure 1- Short-term operating activity and cash-flow of firm ... 5
LIST OF TABLES
Table 1 - Linear Relationship between Working Capital Accounts and Working Capital Policies ... 7Table 2 - Summary Statistics ... 20
Table 3 - CEO’s Characteristics ... 21
Table 4 - Estimation and Identification of Panel data Model ... 26
Table 5 - Working Capital Management relationship with profitability according to firm’s age ... 30
Table 6 - Working Capital Management relationship with profitability according to firm’s size ... 31
Table 7 - Working Capital Management relationship with profitability according to firm’s industry sector ... 33
Table 8 - Working Capital Management relationship with firm’s profitability according to firm’s location (NUTS II) ... 35
Table A 1 - Working Capital Management and the Relationship with Determinants .... 46
Table A 2 - Variables Description and Measurement ... 47
Table A 3 - Correlations Matrix ... 48
Table A 4 - Number of Financial Institutions Across Regions ... 48
1
1.
INTRODUCTION
For long, working capital management has been considered an important component of
firms’ financial decision process, occupying a major portion of managers’ time and resources (Richard & Laughlin, 1980; Silva, 2012).
Working capital management reflects the time interval between actual cash expenditures on a firm’s purchase of productive resources and the recovery of cash receipts from sales, during firm’s regular course of operations (Richards & Laughlin, 1980; Dong & Su, 2010). Therefore, working capital connects short-term financial management with firms’ strategic decisions1, affecting firm’s profitability, risk, and consequently its value, even for firms with favorable long-run prospects (Smith, 1980; Richards & Laughlin, 1980).
First studies on this area suggest the existence of a linear relation between working capital management and firms’ profitability2. Thus, firms can maximize profitability and minimize associated risks through an efficient management of working capital accounts. In fact, manager’s goal is to improve financial performance through working capital policies (Gitman, 1974; Gitman & Sachdeva, 1982).
In order to improve profitability, through linear relation, firms may adopt two types of working capital policies: the aggressive and conservative policies. The aggressive working capital policy implies that firms become more profitable and more risky by decreasing investments in working capital accounts3. In contrast, conservative working
1 Strategic decisions that have to do with the amount invested in inventories and how much trade credit extend to
customers or accept from suppliers. These are the main drivers of working capital.
2 See for example: Czyzewski & Hicks, (1992); Long, Malitz, & Ravid, (1993); Jose, Lancaster, & Stevens, (1996);
Deloof & Jegers, (1996); Shin & Soenen, (1998); Deloof, (2003); Valadas, (2005); García-Teruel & Martínez-Solano, (2007).
3 See for example: Jose & Lancaster (1996); Shin & Soenen (1998); Deloof (2003); Valadas (2005); Kieschnick,
2
capital policy implies that firms become less profitable and less risky as they increase investment in working capital accounts. However, some empirical studies4 support that aggressive working capital policies enhances profitability, neglecting relevant aspects, such as, the risk of losing sales or interruptions in production process if firms reduce excessivly their investment in working capital (Baños-Caballero, et al., 2012). For Kamath, (1989); Long, et al., (1993) and Deloof & Jegers, (1996) adopt conservative policies might increase sales increasing profitability.
Recent studies point to the existence of an optimal level of working capital, captured through a concave relation between WCM and profitability, showing that firms pursue an optimal working capital level that maximizes profitability (Baños-Caballero, et al., 2012). The non-linear relationship is positive when firms hold low levels of investment in working capital and becomes negative for higher levels (Baños-Caballero, et al., 2010); (Baños-Caballero, et al., 2012).
In this study we provide empirical evidence about the effects of WCM on Portuguese
firms’ profitability and the importance of working capital policies. Moreover, we evaluate the existence of a non-linear relationship between WCM and profitability, and how this relation varies according to size, age, industry sector, location and CEO’s demographic and educational characteristics. To answer our key questions, we combine firm-level financial data with a matched employer-employee data from 2004 to 2009, gathering
detailed information on firms’ year-end financial data, and CEO demographic and educational characteristics.
4 See the authors: Jose & Lancaster (1996); Shin & Soenen (1998); Deloof (2003); García-Teruel & Martínez-Solano
3
A more thorough understanding of the impact of working capital on firms’ profitability is important to define and understand which working capital strategies fit within different frameworks. Our conclusions are likely to be extended to other European countries, based on banking oriented financial system, where firms face long-term capital markets funding constraints.
Our results suggest a concave relationship between WCM and profitability, having firms an optimal working capital level that maximizes profitability. Analyzing CEO’s characteristics effects over profitability, results show that all variables are positively related, where male, Portuguese, older and with higher education CEOs have more profitable firms. For the sub-samples, results also suggest a non-linear relationship, showing that WCM for older firms is higher, that WCM practices within industries are different and that working capital level of firms across locations with more financial institutions are also different. For all sub-samples, the average working capital levels stands below the optimal, showing that firms can improve performance through longer inventory turnover periods, extension of trade credit to customers and reduction of suppliers financing, indicating that higher investment in working capital leads to higher profitability and that beyond the optimal level the relation becomes negative, due to the concave relationship between the two variables.
4
2.
LITERATURE REVIEW
WCM is an important component of the overall financial strategy of any firm to create value, having a significant impact on profitability and risk (Richard & Laughlin, 1980; Smith, 1980; Lamberson, 1995). It involves planning and controlling current assets5 and current liabilities6, in a manner that eliminates the risk of not meeting short-term obligations and avoid the excessive investment in firm’s assets and activities (Eljelly, 2004). The objective of WCM is to maintain the optimum balance of each account, namely: receivables, inventory and payables, that influence firm’s performance (Filbeck & Krueger, 2005).
According to Deloof, (2003) efficient WCM is fundamental for maximizing profitability. Therefore, maximizing profit is the main objective for firms; however, firms need at the same time to focus on liquidity to prevent insolvency (Raheman & Nasr, 2007). This happens because working capital investments are not converted into cash at the same moment in time or with the same cash flow magnitude, thereby, firms should guarantee
the necessary amounts of available funds to match firm’s liquidity needs (Richard & Laughlin, 1980).
WCM is particularly important for small firms, with limited access to long-term capital markets; once these firms tend to rely heavily on financing from trade credit and short-term bank loans to finance the needed investments in cash, accounts receivables and inventory (Long, et al., 1993).
5
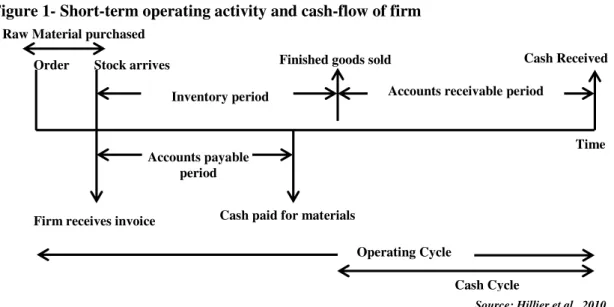
Short-term finance is concerned with short-term operating activities such as buying materials, paying cash for purchases, product manufacturing, product selling or cash collecting. These activities create patterns of cash inflows and cash outflows that are unsynchronized and uncertain. Hillier, et al., (2010), used a framework to explain the functioning of WCM (see Figure 1).
Figure 1- Short-term operating activity and cash-flow of firm
Operating cycle is the interval between the order of inventory and the date that cash is collected. In the meantime, cash cycle begins when firms pay suppliers for the materials purchased and ends when cash is collected from customers (Hillier, et al., 2010).
2.1. Working Capital Management and Firm Value
Previous empirical studies with respect to the impact of WCM over firm’s value do not provide clear evidence on whether firms actually do maximize their value through their WCM choices (Kieschnick, et al., 2006). In fact, the study that comes nearest of addressing this issue is Shin & Soenen, (1998), where firms that manage working capital more efficiently, through shorter net trade cycles, experience higher operating cash flows
Time Cash Received
Accounts receivable period Inventory period
Stock arrives Order
Raw Material purchased
Accounts payable period
Cash paid for materials Firm receives invoice
Operating Cycle
Cash Cycle
6
and are more valuable. Therefore, reducing the net trade cycle to a reasonable minimum is a strategy to create value (Shin & Soenen, 1998).
In order to study the effects of WCM on firm’s value, it is important to understand the relevance of under-investment and over-investment in working capital on firms’ valuation (Kieschnick, et al., 2006). An efficient management of working capital is crucial, once under-investment result on firm’s inability to meet obligations, whereas, for situations of over-investment, the return on capital employed will not be maximized (Kieschnick, et al., 2006). Thus, firms within the optimal level experience lower risk, are more prepared for uncertainty and have a cash reserve that can be used during difficult times (Autukaite & Molay, 2011).
The over-investment situation, studied by Valadas, (2005) and Kieschnick, et al., (2006) suggests a negative relationship between value and WCM, once additional investment in working capital is associated with a reduction in firm value. When looking at the factors that influence the efficiency of working capital, Kieschnick, et al., (2006) point to size and future sales growth. Indeed, industry practices have strong influence on firm’s working capital adopted policies, Hawawini, Viallet, & Vora, (1986), found evidence of substantial industry effects on working capital policies, as well as the existence of benchmarks to which firms adhere when implementing working capital policies.
2.2. Working Capital Management Policies and Firm Profitability
Studies on the relationship between WCM and firms’ performance, started through the analysis of a linear relation.
7
boost the chances of adequate levels of liquidity and, conversely, decisions that focuses entirely on maximize liquidity decreases profitability (Smith, 1980). Thus, this trade-off depends on working capital policies adopted, distinguished as conservative or aggressive policies (see Table 1).
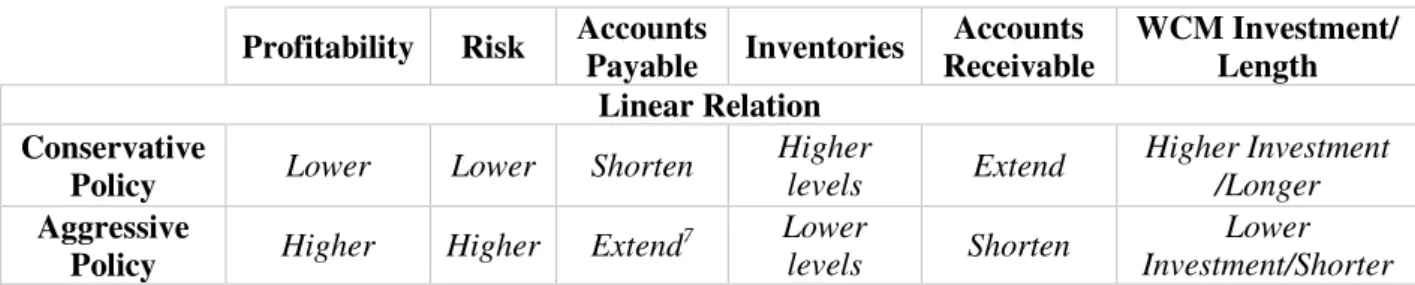
Table 1 - Linear Relationship between Working Capital Accounts and Working Capital Policies
Profitability Risk Accounts
Payable Inventories
Accounts Receivable
WCM Investment/ Length Linear Relation
Conservative
Policy Lower Lower Shorten
Higher
levels Extend
Higher Investment /Longer
Aggressive
Policy Higher Higher Extend
7 Lower
levels Shorten
Lower Investment/Shorter
The conservative working capital policy implies a higher investment in working capital accounts, such as higher levels of inventories, extending more trade credit to customers
and reducing supplier’s financing, resulting in a lower profitability and lower risk. However, for some authors, conservative working capital policy positively affect profitability8, due to higher sales (Petersen & Rajan, 1997); higher levels of inventories that prevents interruptions in operating cycle process and a reduction of supply costs, reducing both the risk of price fluctuation among business cycles and the risk of losing customers due to product scarcity (Blinder & Maccini, 1991; Carpenter, et al., 1994, Fazzari, & Petersen, 1994).
In terms of trade credit to customers adopting conservative working capital policies may increase profitability because extend trade credit helps to ensure that the contracted services have been carried out, allowing customers to check if purchased products and services are as agreed in quality and quantity terms prior to payment, leading to repeated
8
sales (Long, et al., 1993; Deloof & Jegers, 1996). Extend trade credit to customers, also reduces asymmetric information between buyer and seller (Smith, 1987), strengthening long-term supplier-customer relationships, increases sales in periods of low demand and reduces transaction costs (Emery, 1987). Reduction on supplier’s financing, allows customers to take advantage of prompt payment discounts due to early payments, as well as, reduction of the costs of external financing (Ng, et al., 1999; Wilner, 2000; Baños-Caballero, et al., 2010).
In contrast, aggressive working capital policy implies lower investments in working capital accounts, through lower levels of investment in inventories, shortening trade credit to customers and postponing payments to suppliers, resulting in an increase of profitability and risk for firms9. Authors like Hager, (1976); Jose, et al., (1996) provided evidence of an inverse relationship between working capital and profitability, where firms that keep lower investment in working capital tend to be more profitable, that is achieved by minimizing the cost of holding unproductive assets, such as cash and marketable securities, rather than by increasing payables; reducing the dependency of external
financing preserves firm’s debt capacity, since less short term borrowing is required to
provide liquidity. Further these results fit better to large firms, being the relationship sensitive to industry factors.
Authors like Shin & Soenen, (1998) and Deloof, (2003) suggest a negative relationship between WCM and profitability, showing that a reduction in working capital accounts, namely accounts receivables and inventories, to a reasonable extend, increases profitability, arguing that less profitable firms need more time to pay their bills. In sum,
9See for example: Jose, et al., (1996); Shin & Soenen, (1998); Deloof, (2003); Valadas, (2005); García-Teruel &
9
this policy leads to a reduction in costs due to the low levels of inventories and account receivables. The risks taken are low, because of the low levels of accounts receivables. Therefore, small firms can create value by reducing working capital accounts to a reasonable minimum due to the observed negative relation (Dong & Su, 2010).
More recent studies on the relationship between WCM and profitability, (Baños-Caballero, et al., 2012; Silva, 2012), point to a non-linear relationship, indicating that there is an optimal working capital level that maximizes profitability, which indicates that both high and low working capital levels are associated with a lower profitability. Such relationship between WCM and profitability, behaves positively for low levels of investment in working capital and negatively for high levels of investment in working capital, showing the greater profitability effect but also the greater risk effect for firms with low levels of working capital (Baños-Caballero, et al., 2012).
2.3. Determinants of Working Capital Management
Despite the importance of WCM, few studies have looked into his determinants (Baños-Caballero, et al., 2009). When analysing the determinants of WCM, internal and external finance are not perfect substitutes10. In these circumstances firms’ investments and financing decisions are interdependent and firms may have an optimal working capital level that balances costs and benefits and maximizes firm value (Baños-Caballero, et al., 2010).
Within the macroeconomic context, gross domestic product (GDP) is an important determinant for WCM. According to Lamberson, (1995), changes in economic activity
10 External finance, debt or new finance issues, may be more expensive than internal finance because of financial market
10
affect WCM decisions of small firms, although these responses may be different from those taken in large firms11. Further, Lamberson, (1995) finds a negative relation between inventory levels and GDP, where firms hold less inventories during economic expansion and more inventories during recessions. On the contrary, Blinder and Maccini, (1991), finds that firms reduce inventories during economic recessions, also Chiou, et al., (2006) finds a positive relation, having firms more receivables and inventories during recessive economic periods.
For age12, this is associated with firm’s source of financing and trade credit relationships. According to Chiou, et al., (2006), age is positively related with working capital requirements, this is explained by the fact that older firms can get external financing easier and under better conditions. According to Baños-Caballero, et al., (2010), there is a positive relation, once older firms, with better access to external financing, maintain higher investment in WCM. Moreover, García-Teruel & Martínez-Solano, (2010), finds that younger firms use more credit from suppliers, and old firms less, since they have other sources of finance as consequence of their credit capacity and reputation.
Size13 is another variable that affects working capital investment. Results found by Petersen and Rajan, (1997); García-Teruel & Martínez-Solano, (2010) suggest that large firms provide more credit to customers, whereas, small firms use more trade credit. Chiou, et al., (2006); Kieschnick, et al., (2006) 14 found a positive relation for small firms because
11 According to Chiou, et al., (2006), it is difficult for a firm to get external financing during economic recessions,
because of limited cash supplies.
12This determinant has been used as a proxy for the time the firm may have known its customers and the firm’s quality
and reputation (Petersen & Rajan, 1997) as well as for the length of the relationship between suppliers and customers (Cuñat, 2007) and firm’s creditworthiness to suppliers of debt and equity (Niskanen & Niskanen, 2006).
13 According to Long et al., (1993) large firms with an established reputation on product quality, have little need to
extend trade credit. Small firms that have no reputation need to provide trade credit to guarantee product quality.
14 Kieschnick, et al., (2006) finds positive but not significant relationship between size and cash conversion cycle, for
11
the cost of funds used to invest in current assets decreases with firm size, as smaller firms have greater information asymmetry, greater informational opacity and are less followed by analysts. Moreover, according to the trade-off theory, they have a higher likelihood of bankruptcy, as larger firms are more diversified failing less often. This might affect the trade credit granted, because, according to Petersen and Rajan, (1997) and Niskanen and Niskanen, (2006), firms with better access to capital markets extend more trade credit. Whited, (1992) and Fazzari and Petersen, (1993) showed that small firms also face greater financial constraints, which also increases trade credit received from suppliers, using this form of credit when other forms are unavailable or have been exhausted15. In addition, Nakamura & Palombini, (2009), finds a negative relation between size and accounts receivables, suggesting a greater market power from large firms or that small firms provide more trade credit to guarantee product quality.
For Chiou, et al., (2006), there is a negative relation between profitability and working capital requirements, once more profitable firms have better access to external capital, and thus can invest in more profitable investments. Also for Shin & Soenen, (1998), more profitable firms have better WCM, because of their market dominance, having larger bargaining power with suppliers and customers. For Petersen and Rajan, (1997) firms with higher profitability receive significantly more credit from suppliers.
In terms of Cash flows, these are generated internally, being expected that firms with bigger cash flows and lower leverage to grant more trade credit to customers in order to get a competitive advantage. On the contrary, these firms need less credit from suppliers (García-Teruel & Martínez-Solano, 2010). Authors Fazzari and Petersen, (1993),
12
demonstrated that investment in working capital is sensitive to cash flow, suggesting that firms with larger capacity to generate internal resources have higher current asset levels, which might be due to the lower cost of funds invested in working capital. According to Chiou, et al., (2006), there is a negative relation with working capital requirements16, suggesting that firms with greater cash flows have better WCM. Nazir & Afza, (2008) did not found any statistical significant relationship.
Sales growth affects trade credit granted and received, as well as investment in inventories (Nunn, 1981). Firms with fast growing sales pay more attention to WCM17 (Chiou, et al., 2006). According to Chiou, et al., (2006) there is a negative but not significant relationship between growth and working capital requirements. Furthermore, Nakamura and Palombini (2009), found negative relationship between growth and cash conversion cycle. For García-Teruel & Martínez-Solano, (2010) growth is negatively related to accounts receivable and positively with accounts payable for small firms. On the other hand, Kieschnick, et al., (2006) show a positive relation with firm’s WCM suggesting that firms build up inventories anticipating future sales growth.
Investment in tangible fixed assets can affect WCM. Fixed assets are negatively related with working capital requirements because the proportions of accounts receivable and inventories almost fully determine the proportion of firm’s fixed assets (Kieschnick, et al., 2006). On the other hand, firms with more tangible assets have lower costs when
16According to Niskanen & Niskanen, (2006); García-Teruel & Martínez-Solano, (2010) there is a significant negative
relation between cash flow and payables, whereas Niskanen & Niskanen, (2006) find an insignificant positive with receivables. Nakamura & Palombini, (2009) find significant negative relation between free cash flow and inventory. 17An example of more attention to WCM in growing firms is that managers may decide to build up inventory levels
13
raising funds to invest in current assets, which increase their working capital (Baños-Caballero, et al., 2010). Thus the relation is not clear.
Lastly, leverage, Chiou, et al., (2006) encountered a negative relationship with working capital requirements. Also Baños-Caballero, et al., (2010), found negative relation between leverage and inventories and a positive with payables, as well as, receivables, indicating that firms with better access to financial credit redistribute it, to firms with poor access to these markets, through trade credit.
14
3.
THEORY AND HYPOTHESES
Previous authors point to an increase of firm’s profitability through a lower investment in working capital. In fact, the relationship between working capital and firm’s profitability may be concave rather than linear (Baños-Caballero, et al., 2012; Silva, 2012). This non-linear relation between the two variables indicates that both high and lower levels of working capital investment are associated with lower profitability. In order to improve financial performance, firms should balance the benefits and costs of investing in working capital. Therefore, it is expected that profitability and working capital to relate positively at low levels of working capital and negatively at higher levels of investment in working capital 18 (Baños-Caballero, et al., 2012). Managers should aim to keep as close to the optimal working capital level and avoid deviations to maximize profitability.
Hypothesis 1 - There is a non-linear (concave) relationship between working capital
management and firm’s profitability.
The age of firms is likely to affect the optimal level of working capital. Age is associated
to firm’s source of financing an trade credit, being age used as a proxy for the time firms may know its customers, firm’s quality and reputation, as well as, for the length of the relationships between suppliers and customers and for firm’s creditworthiness to suppliers of debt and equity. Younger firms present higher growth rates from the early years of a firm, which forces manager to efficiently control working capital that slows down in the course of time. Moreover, younger firms lack reputation and creditworthiness having higher costs for investing in WCM. On the other hand, old firms can easily access
18It’s expected that firm’s profitability to rise as working capital increases, until a certain level, given that the increase
15
external financing under better conditions than younger firms, so the cost of funds of investing in working capital are lower for these firms, therefore, WCM is expected to increase with age due to lower cost of invested funds.
Hypothesis 2 – The non-linear relationship between working capital management and
firm’s profitability differs according to firms’ age.
The size of firms is likely to affect the level of working capital. Smaller firms need to monitor working capital due to their volatile cash flows, dependence on short-term debt and less liquidity, compared to large firms, due to greater information asymmetry. In fact, small firms should adopt WCM routines in order to reduce the likelihood of bankruptcy and failure, as well as, to enhance profitability. Small firms are expected to receive more trade credit, due to greater financial constraints, using this form of credit when other forms are not available. Small firms also have lower receivables and inventory levels once the cost of funds invested in current assets is higher for these firms, which makes these firms to have a lower optimal working capital level, compared to large firm that allocate more resources and expertise in the management of working capital profiting more from
economies of scale, once the cost of funds used to invest in current assets decreases with size. In sum, as firms dimension increases, is expected the complexity of its operations to increase and more amounts of working capital will be needed.
Hypothesis 3 – The non-linear relationship between working capital management and
firm’s profitability differs according to firms’ size.
16
of credit to customers, the management of inventory and firm’s ability to postpone payments to suppliers depend on industry structures. Some firms can easily minimize accounts receivables and inventory levels; others are best suited to maximize accounts payables. Several studies as Hawawini, et al., (1986); Filbeck & Krueger, (2005) proved that WCM is affected by industry factors, although WCM practices within industries change significantly over time, distinctions between industries persist. Therefore, industry effects on WCM policies may be explained by differences in trade credit and investment in inventories. In order to identify industry benchmarks to which firms adhere when implementing WCM policies we use the median working capital level of firms to proxy for the typical WCM practices within such industry.
Hypothesis 4 – The non-linear relationship between working capital management and
firm’s profitability differs according to firms’ industry sector.
Firm’s geographic location (by NUTS II) and the number of financial institutions available affect the optimal working capital level, once the fact that firms located at a considered more favorable region, with more financial institutions, can have easier access to financing, making the optimal WCM level to alter when compared to regions with less external financing offer. Therefore, using NUTS we define a set of sub-regions that are used to study how WCM practices varies according to regions conditions. For regions it may be found variations in the optimal working capital levels, but also in the access external financing.
Hypothesis 5 – The non-linear relationship between working capital management and
17
4.
DATA AND DESCRIPTIVE STATISTICS
4.1. Sample and Data Description
Our analysis draws on a matched employer-employee database (QP - “Quadros de Pessoal”) combined with firms’ financial database, the SCIE (Simplified Corporate Information).
The matched employer-employee database (QP) is a mandatory survey submitted annually to the Portuguese Ministry of Employment and Social Security by firms with at least one employee. It covers the entire Portuguese private sector from 1986 to 2009, gathering comprehensive information on more than 220,000 firms and 2,000,000 individuals per year. Every year, firms report: year of creation, geographic location, size, industry classification, number of establishments, initial capital and ownership structure. At the individual level, the database contains employers’ information on CEOs’ gender, age and education.
18
From our matched employer-employee, we select all eligible firms for which we could identify CEOs and their background history. We also restrict the sample to CEOs aged between 20 and 60, ending up with a total of 106,961 observations, corresponding to 41,536 firms.
4.2. Variables Description
For the descriptive statistics from our sample we summarize in Table A 2, in Appendix, the main variables used in this study.
The profitability (𝑃𝑅𝑂), is the return on assets (ROA), given by operating income over total assets. Working capital management (𝑊𝐶𝑀) is measured by the aggregate summary indicator: cash conversion cycle (CCC) (Emery, 1984). The CCC, is a performance indicator of WCM efficiency, measuring the number of days that funds are committed to inventories and accounts receivable minus the number of days that payment to suppliers is deferred (Gitman, 1974). Size (𝑆𝐼𝑍𝐸), is computed by the number of individuals in employee records yearly. Firm’s growth (𝐺𝑅𝑂𝑊𝑇𝐻), is measured as sales growth, affecting trade credit granted and received, as well as investment in inventories (Baños-Caballero, et al., 2012). Leverage (𝐿𝐸𝑉) is measured as the ratio of debt (short and long-term loans) to total assets (Deloof, 2003; Lazaridis & Tryfonidis, 2006; Dong & Su, 2010).
As CEO’s characteristics, 𝐺𝑒𝑛𝑑𝑒𝑟 this is a dummy variable equaling one for men and zero for women. For age, we define four categorical variables: Age20-29 coded one for individuals aged between 20 and 29, Age30-39, coded one for individuals aged between 30 and 39; Age40-49, coded one for individuals aged between 40 and 49 and finally
19
four categorical variables: higheducation that is a dummy variable, equaling one for founders with bachelors, masters or doctoral degrees; mediumeducation, is a dummy variable equaling one for individuals reporting a high school diploma or vocational school degree; loweducation, is a dummy variable equaling one for individuals that attended junior high school and veryloweducation, is a dummy variable equaling one for individuals who never attended or completed elementary school. Lastly, 𝑁𝑎𝑡𝑖𝑜𝑛𝑎𝑙𝑖𝑡𝑦, which is a dummy variable equaling one for foreign managers and zero for Portuguese.
4.3. Descriptive Statistics
For the descriptive statistics, we begin with the correlations matrix, Table A 3, in Appendix, although describing the relationship between variables it does not identify the causes. Therefore, the estimated correlations between explanatory variables and profitability show a higher correlation between profitability, given by ROA, and profitability in previous period, about 67.2%. Leverage is also highly correlated with profitability, about 74.3%. Finally, it is also observable that WCM is highly correlated, 84.7%, with its square.
Table 2 and Table 3 provide descriptive statistics of our sample. On average the profitability shows how profitable a firm is compared to its total assets, ROA gives an idea of how efficient management is, using its assets to generate earnings; therefore, on average, the profitability of our sample is negative (-59%). The average numbers of days, since the purchase of raw materials until firms collect receivables, is on average 34 days. Firms in our sample almost do not grow, when compared to the homologous period, and have on average 6 employees. In terms of leverage, short and long-term loans represent
20 Table 2 - Summary Statistics
Variables Observations Mean Std. Dev. Min. Median Max.
𝐏𝐑𝐎𝐭 106,961 -0.59 119.61 -29000 0.04 140.02
𝐏𝐑𝐎𝐭−𝟏 106,961 -0.36 81.13 -26000 0.04 8.04
𝐖𝐂𝐌 106,961 34.23 57.98 -70.98 19.98 194.98
𝐖𝐂𝐌𝟐 106,961 4532.95 7497.67 0.00 1178.93 38018.91
𝐒𝐈𝐙𝐄 106,961 5.70 11.35 1.00 3.00 1062
𝐆𝐑𝐎𝐖𝐓𝐇 106,961 -0.02 0.48 -9.46 0.00 7.99
𝐋𝐄𝐕𝐄𝐑𝐀𝐆𝐄 106,961 0.79 101.96 0.00 0.32 33341.00
This table reports summary statistics during the period 2004-2009. Descriptive statistics are the following: Number of Observations, Mean, Standard Deviation, Minimum, Median and Maximum. Variables are as follows PRO = Firm Profitability; PROt-1= Firm Profitability in previous period; WCM= Number of days of Working Capital Management;
WCM2= Squared Number of days of Working Capital Management; SIZE= Reported Number of Employees within
Firms; GROWTH= Natural Logarithm of Sales; LEVERAGE= Firm Financial Debt Ratio to Total Assets.
21 Table 3 - CEO’s Characteristics
GENDER Frequency Percent
Male 73,596 68.81%
Female 33,365 31.19%
AGE Mean Frequency Percent
20 to 29 26.60 12,327 11.52%
30 to 39 34.56 41,732 39.02%
40 to 49 44.13 34,099 31.88%
50 to 60 54.09 18,803 17.58%
EDUCATION Frequency Percent
Very Low 16,630 15.55%
Low 45,010 42.08%
Medium 26,614 24.88%
High 18,707 17.49%
NATIONALITY Frequency Percent
Portuguese 103,491 96.76%
Europe 1,758 1.64%
Africa 443 0.41%
Asia 437 0.41%
South American 779 0.73%
Central and North American 49 0.05%
Other 4 0.00%
ENTRY YEAR Frequency Percent
2000 9,872 9.23%
2001 20,978 19,61%
2002 16,432 15.36%
2003 12,041 11.26%
2004 12,089 11.30%
2005 13,900 13.00%
2006 11,933 11.16%
2007 7,447 6.96%
2008 1,967 1.84%
2009 302 0.28%
22
5.
EMPIRICAL METHODOLOGY AND RESULTS
In order to test the effects of WCM on profitability we conduct a multivariate analysis based on multiple regression analysis in order to test the relationship between dependent and explanatory variables.
Being this an empirical longitudinal study, data is analyzed under panel data methodology. According to Brooks, (2008) this methodology presents benefits: (i) gives access to more information by combining time-series and cross-sectional, allowing to address more complex issues that would not be possible with time-series or cross-sectional data; (ii) allows the use of a large number of observations, ensuring the asymptotic properties of estimators and increases the degrees of freedom, meaning more robust and meaningful t and F Statistic tests; (iii) reduces risk of Multicollinearity, since the data between entities have different structures; (iv) increases efficiency and stability of estimators by conducting adequate regression methods allowing a safer choice between different methods. Panel data also allows controlling for unobserved cross-section heterogeneity, making possible to exclude bias derived from the existence of individual effects. That is possible because it confines the heterogeneity to the intercept term of the relationship (Baum & F., 2006).
The equation to determine the relationship between WCM and profitability is:
Equation (1): 𝑃𝑅𝑂𝑓𝑖𝑡𝑐 = 𝛼𝑓+ 𝜆𝑡+ 𝛽𝑗 + 𝜃𝑐 + 𝛿𝑖 + 𝑋1𝑃𝑅𝑂𝑓𝑡−1+ 𝑋2𝑊𝐶𝑀𝑓𝑡+ 𝑋3𝑊𝐶𝑀𝑓𝑡2 + 𝑋4𝐺𝑅𝑂𝑊𝑇𝐻𝑓𝑡 + 𝑋5𝐿𝐸𝑉𝑓𝑡+ 𝜔𝑓𝑡 + 𝜂𝑓+ 𝜀𝑓𝑖𝑡𝑐
Where, f indicates firm, i refers to the CEO, j indicates the industry, t the time period and
23
The dependent variable profitability (𝑃𝑅𝑂𝑓𝑖𝑡𝑐), is defined as the return on assets (ROA), being given by operating income over total assets. Independent variables include (𝑃𝑅𝑂𝑓𝑡−1) which is given by firm’s return on assets in the previous period; Working Capital Management (𝑊𝐶𝑀𝑓𝑡) and its square, (𝑊𝐶𝑀𝑓𝑡2), which are measured by the CCC; Firm growth (𝐺𝑅𝑂𝑊𝑇𝐻𝑓𝑡) is the logarithm of sales growth; Firm leverage (𝐿𝐸𝑉𝑓𝑡) is measured as the ratio of debt to total assets; Our model includes the vector 𝜔𝑓𝑡, which is a vector for CEO’s characteristics, which includes CEO’s gender (equaling one for men and zero for women); four categorical variables for age (Age 20-29 coded one for individuals aged between 20 and 29; Age 30-39 coded one for individuals aged between 30 and 39; Age 40-49 coded one for individuals aged between 40 and 49 and; Age 50-60
coded one for individuals aged between 50 and 60); four categorical variables for educational level (veryloweducation,is a dummy variable equaling one for individuals who never attended or completed elementary school; loweducation, is a dummy variable equaling one for individuals that attended junior high school; mediumeducation, is a dummy variable equaling one for individuals reporting a high school diploma or vocational school degree and higheducation, is a dummy variable equaling one for founders with bachelors, masters or doctoral degrees); finally, CEO’s nationality (equals
one for foreign CEO’s and zero for Portuguese). In reporting the estimated coefficients
our omitted category is CEO’s aged 20-29 and with very low educational level.
24
respective industry code; Regional dummy variable (θ𝑐), defined with seven categorical variables, following NUTS II, equaling one for the respective territorial unit; and, year dummy variable (𝜆𝑡), defined with four categorical variables, from 2006 to 2009, equaling one for the respective reference year; 𝛼 measures the constant term; the 𝜂𝑓 is the unobservable heterogeneity or firm’s unobservable individual effects and 𝜀𝑓𝑖𝑡𝑐 the random disturbance.
5.1. Regression Analysis
The estimation and identification of panel data models requires previous tests to identify the correct method. Such method implies firstly to analyze data considering Pooled Ordinary Least Squares (OLS) estimation, in order to test for unobserved heterogeneity effects across firms.
Pooled OLS estimation provides an F Statistic test under a null hypothesis that the constant terms are equal across entities. If the null hypothesis is rejected there are unobservable individual effects that have to be properly treated.
There are several techniques to analyze panel data, in which Fixed Effects (FE) or Random Effects (RE) are usually chosen. We choose which methodology is used through the Hausman test that examines whether the unobservable heterogeneity term (𝜂𝑖) is correlated with explanatory variables, while continuing to assume that regressors are uncorrelated with the disturbance term in each period. The null hypothesis for this test is that unobservable heterogeneity term is not correlated with the independent variables 𝐸 (𝜂𝑖
𝑥𝑖𝑡) = 0. If the null hypothesis is rejected then we employ Fixed Effects (FE)
25
26
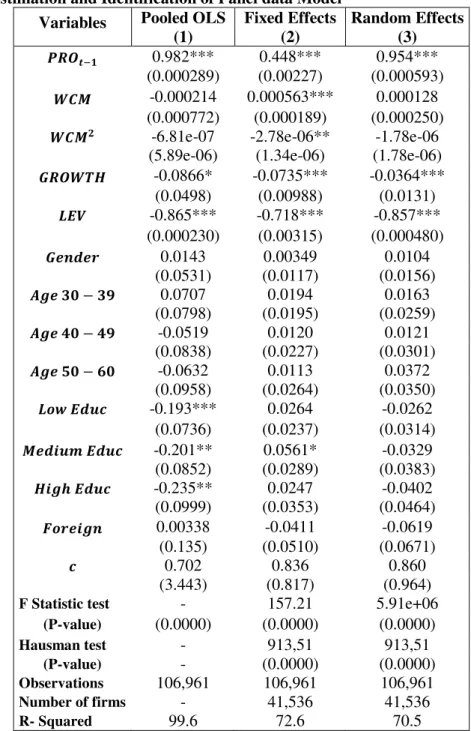
Table 4 - Estimation and Identification of Panel data Model
Variables Pooled OLS Fixed Effects Random Effects
(1) (2) (3)
𝑷𝑹𝑶𝒕−𝟏 0.982*** 0.448*** 0.954***
(0.000289) (0.00227) (0.000593)
𝑾𝑪𝑴 -0.000214 0.000563*** 0.000128 (0.000772) (0.000189) (0.000250)
𝑾𝑪𝑴𝟐 -6.81e-07 -2.78e-06** -1.78e-06
(5.89e-06) (1.34e-06) (1.78e-06)
𝑮𝑹𝑶𝑾𝑻𝑯 -0.0866* -0.0735*** -0.0364***
(0.0498) (0.00988) (0.0131)
𝑳𝑬𝑽 -0.865*** -0.718*** -0.857*** (0.000230) (0.00315) (0.000480)
𝑮𝒆𝒏𝒅𝒆𝒓 0.0143 0.00349 0.0104
(0.0531) (0.0117) (0.0156)
𝑨𝒈𝒆 𝟑𝟎 − 𝟑𝟗 0.0707 0.0194 0.0163
(0.0798) (0.0195) (0.0259)
𝑨𝒈𝒆 𝟒𝟎 − 𝟒𝟗 -0.0519 0.0120 0.0121
(0.0838) (0.0227) (0.0301)
𝑨𝒈𝒆 𝟓𝟎 − 𝟔𝟎 -0.0632 0.0113 0.0372
(0.0958) (0.0264) (0.0350)
𝑳𝒐𝒘 𝑬𝒅𝒖𝒄 -0.193*** 0.0264 -0.0262
(0.0736) (0.0237) (0.0314)
𝑴𝒆𝒅𝒊𝒖𝒎 𝑬𝒅𝒖𝒄 -0.201** 0.0561* -0.0329
(0.0852) (0.0289) (0.0383)
𝑯𝒊𝒈𝒉 𝑬𝒅𝒖𝒄 -0.235** 0.0247 -0.0402
(0.0999) (0.0353) (0.0464)
𝑭𝒐𝒓𝒆𝒊𝒈𝒏 0.00338 -0.0411 -0.0619
(0.135) (0.0510) (0.0671)
𝒄 0.702 0.836 0.860 (3.443) (0.817) (0.964)
F Statistic test - 157.21 5.91e+06
(P-value) (0.0000) (0.0000) (0.0000)
Hausman test - 913,51 913,51
(P-value) - (0.0000) (0.0000)
Observations 106,961 106,961 106,961
Number of firms - 41,536 41,536
R- Squared 99.6 72.6 70.5
This table reports the regression estimates, during the period 2004-2009. The variables used in this analysis are as follows. Variables are as follows PRO = Firm Profitability; PROt-1= Firm Profitability in previous period; WCM=
Number of days of Working Capital Management; WCM2= Squared Number of days of Working Capital Management;
GROWTH= Natural Logarithm of Sales Growth; LEV= Firm Financial Leverage. The dummy variables are: “Gender”, “Age20-29”, “Age30-39”, “Age40-49”, “Age50-60” “Very Low Education”, “Low Education”, “Medium Education”, “High Education”, “Foreign”, “Year”, “NUTS”, “Industry”, “Size” and “Age” are control variables for CEO and firm characteristics. Some dummy variables are omitted in order to avoid collinearity problems. Robust t Statistic in parentheses. Hausman test provides a statistical test that evaluates the significance of an estimator (RE) versus an alternative estimator (FE). P-value of Hausman test in parentheses. F test is carried on under the null hypothesis that the constant terms are equal across entities (firms). The null hypothesis, of both tests, must be rejected at the 5 percent significance level. P-value of F test in parentheses. R-squared expressed in percentage. ***, ** and * mean statistical significance at the 1% level, 5% level and 10% level, respectively.
27
a p-value of zero, making us reject the null hypothesis, for unobservable heterogeneity effects across entities. The HausmanTest, is then used to determine if those unobservable effects are considered random or alternatively fixed; we have a p-value of zero for both fixed and random effects, making us to reject the null hypothesis, indicating a significant correlation between unobservable heterogeneity (𝜂𝑖) and explanatory variables, being employed FE estimation, considered as the best methodology.
The results, for Pooled OLS, presented in column (1) indicate that, firm’s profitability is positively related with ROA in the previous period, a 1% increase of ROA in previous year is associated with an increase of 98.2% on current profitability. For WCM, there is a negative relation with profitability, indicating that if working capital length increases in one day, the ROA decreases 0.0214%. Firm’s growth is also negatively related with
profitability, a 1% increase in sales growth decreases profit in 0.866%. Firm’s leverage is negatively related with profitability, a 1% increase in leverage decreases profitability
in 86.5%. For CEO’s characteristics, gender is positively related with profitability,
showing that male CEOs have more profitable firms, also CEOs until 39 years old have more profitable firms than CEOs aged between 20 and 29, for the others, age is negatively related with profitability, thus, older CEOs have less profitable firms compared to younger ones. In terms of education, all levels are negatively related with profitability, showing that the higher the educational level the less profitable the firm is. Finally, foreign CEOs present a negative relation with firm’s profitability, showing that Portuguese ones present more profitable firms.
28
relation with profitability, indicating that if working capital length increases in one day, the ROA increase 0.0566%. For firm’s growth, there is a negative relation with firm’s profitability, a 1% increase in sales growth, decreases profitability in 7.35%. Leverage is also negatively related with profitability, a 1% increase in debt ratio leads to a decrease
in profitability of 71.8%. For CEO’s characteristics, the majority of coefficient’ estimates
are not statistically significant, showing that gender is positively related with firm’s profitability, thus, male CEO’s have more profitable firms. For age, this is positively
related with firm’s profitability, showing that the older the CEO the higher the
profitability of firm. For education, only medium educational level is statistically significant at 10% level, but is possible to conclude that the higher the educational level the higher the profitability is. Finally, for nationality, this is negatively related with profitability; therefore, Portuguese CEO’s have more profitable firms. In sum, CEO’s demographic and educational characteristics are seen as extremely relevant for the
increase of firm’s profitability, once they present higher experience as well as a higher
educational level that enhances CEO’s capacity to handle difficult situations and maximize firm’s performance.
For the Random Effects, in column (3), the relationship between explanatory variables and profitability are equal to the FE estimation, except for the WCM and its square. In terms of CEO’s characteristics, the relationship is also similar to FE estimation except for educational level, where the relation with profitability is negative, showing that as CEO’s
education improves, firm’s profitability decreases.
29
capital at low levels and decreases at higher levels. Therefore, it is possible to conclude that the quadratic function presents a maximum point, since the second partial derivative of profitability with respect to WCM is negative. The maximum point of the quadratic equation can be derived by differentiating 𝑃𝑅𝑂 variable with respect to 𝑊𝐶𝑀, and making this derivate equal to zero. On solving for 𝑊𝐶𝑀, the maximum point is𝑊𝐶𝑀 = (−𝑋2
2×𝑋3). Replacing by coefficients’ estimates, presented in Table 4, column (2), 𝑊𝐶𝑀 =
(2×(−0.00000278)−0.000563 ) = 101.26 days-sales. The results show that the optimum WCM level is
around 101 days-sales. According to our findings, we expect that benefits of investing in working capital to increase until the maximum point is reached, meaning that profitability rise until the breakpoint is achieved. After reach that breakpoint, an increase in working capital level leads to a decrease of profitability. Hence we do not reject our first hypothesis.
Next, we evaluate the non-linear relationship between WCM and profitability according to firm age, size, industry sectors and geographic location, in order to determine firm’s optimal WCM level that maximizes profitability. In all regressions is used robust standard errors; this option relaxes the assumption that errors are identically distributed, not changing coefficient estimates but the test statistics present more accurate p-values, correcting the presence of heteroskedasticity19.
Using equation (1), we evaluate the effects of a non-linear relationship for firms aged between one and nine years. Table 5, presents the optimal WCM level that maximizes
19Heteroskedasticity occurs when the variance of error term differ across observations. The standard errors of the
30
profitability according to age, besides not being present; we estimated coefficients for all the variables as described previously in the FE estimation.
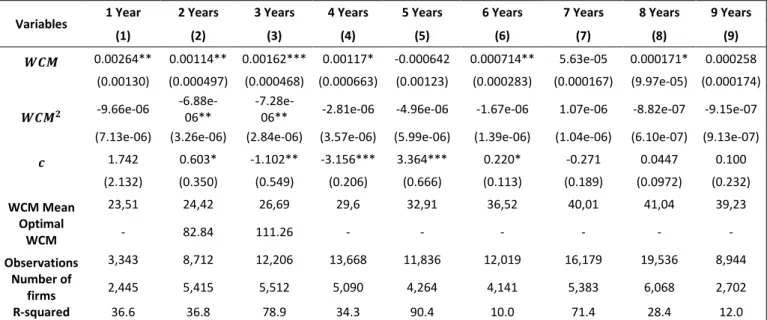
Table 5 - Working Capital Management relationship with profitability according to firm’s age
Variables 1 Year 2 Years 3 Years 4 Years 5 Years 6 Years 7 Years 8 Years 9 Years (1) (2) (3) (4) (5) (6) (7) (8) (9)
𝑾𝑪𝑴 0.00264** 0.00114** 0.00162*** 0.00117* -0.000642 0.000714** 5.63e-05 0.000171* 0.000258 (0.00130) (0.000497) (0.000468) (0.000663) (0.00123) (0.000283) (0.000167) (9.97e-05) (0.000174)
𝑾𝑪𝑴𝟐 -9.66e-06 -6.88e-06** -7.28e-06** -2.81e-06 -4.96e-06 -1.67e-06 1.07e-06 -8.82e-07 -9.15e-07
(7.13e-06) (3.26e-06) (2.84e-06) (3.57e-06) (5.99e-06) (1.39e-06) (1.04e-06) (6.10e-07) (9.13e-07)
𝒄 1.742 0.603* -1.102** -3.156*** 3.364*** 0.220* -0.271 0.0447 0.100 (2.132) (0.350) (0.549) (0.206) (0.666) (0.113) (0.189) (0.0972) (0.232)
WCM Mean 23,51 24,42 26,69 29,6 32,91 36,52 40,01 41,04 39,23 Optimal
WCM - 82.84 111.26 - - - - Observations 3,343 8,712 12,206 13,668 11,836 12,019 16,179 19,536 8,944
Number of
firms 2,445 5,415 5,512 5,090 4,264 4,141 5,383 6,068 2,702 R-squared 36.6 36.8 78.9 34.3 90.4 10.0 71.4 28.4 12.0
This table reports the regression estimates for our equation, using FE robust standard errors methodology, during the period 2004-2009. The variables used in this analysis are as follows. Variables are as follows PRO = Firm Profitability; PROt-1= Firm Profitability in previous period; WCM= Number of days of Working Capital Management; WCM2=
Squared Number of days of Working Capital Management; GROWTH= Logarithm of Sales; LEV= Firm Financial Debt Ratio; Gender= CEO’s gender; Age= CEO’s comprehended interval of years; Education Level= CEO’s educational experience; Foreign= CEO’s Nationality; C is the intercept term. The dummy variables: “Gender”, “Age 20-29”, “Age 30-39”, “Age 40-49”, “Age 50-60” “Very Low Education”, “Low Education”, “Medium Education”, “High Education”, “Foreign”, “Year of reference”, “NUTS”, “Industry Sector” and “Size” are control variables for CEO and firm characteristics. Some dummy variables are omitted in order to avoid collinearity problems. R-squared expressed in percentage. ***, ** and * mean statistical significance at the 1% level, 5% level and 10% level, respectively.
When testing for the non-linear relationship between WCM and profitability, we divided our sample according to age, where firms with two and three years present statistically significant estimated coefficients for WCM and its square, indicating the existence of an optimal WCM level that maximizes profitability.
31
26.69 days for column (3), showing that firms stand below the optimal level and that performance is not maximized. Therefore, once we have a concave relation, profitability can be improved by increasing the invested amount on working capital until the optimal level is reached.
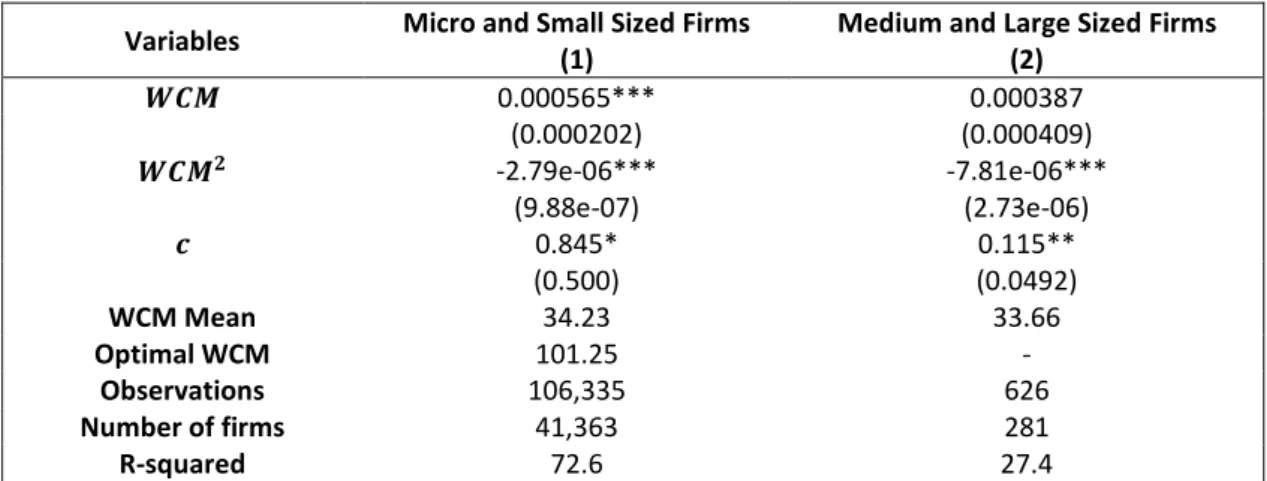
Next, we evaluate the non-linear relationship between WCM and profitability according to firm’s dimension. Table 6 presents results using equation (1). According to OECD, (2005) definition, firms are classified according to the number of employees, where micro firms have at most 10 employees, small have fewer than 50 employees, medium few than 250 employees and large more than 250 employees.
Table 6 - Working Capital Management relationship with profitability according to firm’s size
Variables Micro and Small Sized Firms Medium and Large Sized Firms
(1) (2)
𝑾𝑪𝑴 0.000565*** 0.000387
(0.000202) (0.000409)
𝑾𝑪𝑴𝟐 -2.79e-06*** -7.81e-06***
(9.88e-07) (2.73e-06)
𝒄 0.845* 0.115**
(0.500) (0.0492)
WCM Mean 34.23 33.66
Optimal WCM 101.25 -
Observations 106,335 626
Number of firms 41,363 281
R-squared 72.6 27.4
This table reports the regression estimates for our equation, using FE robust standard errors methodology, during the period 2004-2009. The variables used in this analysis are as follows. Variables are as follows PRO = Firm Profitability; PROt-1= Firm Profitability in previous period; WCM= Number of days of Working Capital Management; WCM2=
Squared Number of days of Working Capital Management; GROWTH= Logarithm of Sales; LEV= Firm Financial Debt Ratio; Gender= CEO’s gender; Age= CEO’s comprehended interval of years; Education Level= CEO’s educational experience; Foreign= CEO’s Nationality; C is the intercept term. The dummy variables: “Gender”, “Age 20-29”, “Age 30-39”, “Age 40-49”, “Age 50-60” “Very Low Education”, “Low Education”, “Medium Education”, “High Education”, “Foreign”, “Year of reference”, “NUTS”, “IndustrySector” and “Age” are control variables for CEO and firm characteristics. Some dummy variables are omitted in order to avoid collinearity problems. R-squared expressed in percentage. ***, ** and * mean statistical significance at the 1% level, 5% level and 10% level, respectively.
32
101.25 days, but the average working capital length for these firms stands at 34.23 days, indicating that firms are not maximizing profitability, by standing below the optimal level.
These micro and small-sized firms need to monitor working capital due to volatile cash flows, dependence on short-term debt and less liquidity due to greater information asymmetry, in order to reduce risks and maximize profitability. For medium and large firms is not possible to conclude the existence of a non-linear relation once coefficients are not statistically significant.
33
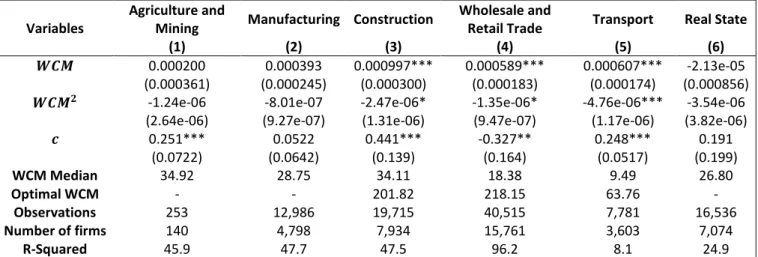
In Table 7, we analyze for existence of a non-linear relationship between WCM and profitability for the following industry sectors: Agriculture and Mining, Manufacturing, Construction, Wholesale and Retail Trade, Transportation and Real State. The results are obtained using equation (1), and according to the industry classification of CAE review 2.1 at two digits.
Table 7 - Working Capital Management relationship with profitability according to firm’s industry sector
Variables
Agriculture and
Mining Manufacturing Construction
Wholesale and
Retail Trade Transport Real State
(1) (2) (3) (4) (5) (6)
𝑾𝑪𝑴 0.000200 0.000393 0.000997*** 0.000589*** 0.000607*** -2.13e-05
(0.000361) (0.000245) (0.000300) (0.000183) (0.000174) (0.000856)
𝑾𝑪𝑴𝟐 -1.24e-06 -8.01e-07 -2.47e-06* -1.35e-06* -4.76e-06*** -3.54e-06
(2.64e-06) (9.27e-07) (1.31e-06) (9.47e-07) (1.17e-06) (3.82e-06)
𝒄 0.251*** 0.0522 0.441*** -0.327** 0.248*** 0.191
(0.0722) (0.0642) (0.139) (0.164) (0.0517) (0.199)
WCM Median 34.92 28.75 34.11 18.38 9.49 26.80
Optimal WCM - - 201.82 218.15 63.76 -
Observations 253 12,986 19,715 40,515 7,781 16,536
Number of firms 140 4,798 7,934 15,761 3,603 7,074
R-Squared 45.9 47.7 47.5 96.2 8.1 24.9
This table reports the regression estimates for our equation, using FE robust standard errors methodology, during the period 2004-2009. The variables used in this analysis are as follows. Variables are as follows PRO = Firm Profitability; PROt-1= Firm Profitability in previous period; WCM= Number of days of Working Capital Management; WCM2=
Squared Number of days of Working Capital Management; GROWTH= Logarithm of Sales; LEV= Firm Financial Debt Ratio; Gender= CEO’s gender; Age= CEO’s comprehended interval of years; Education Level= CEO’s educational experience; Foreign= CEO’s Nationality; C is the intercept term. The dummy variables: “Gender”, “Age 20-29”, “Age 30-39”, “Age 40-49”, “Age 50-60” “Very Low Education”, “Low Education”, “Medium Education”, “High Education”, “Foreign”, “Year of reference”, “NUTS”, “Size” and “Age” are control variables for CEO and firm characteristics. Some dummy variables are omitted in order to avoid collinearity problems. R-squared is expressed in percentage. ***, ** and * mean statistical significance at the 1% level, 5% level and 10% level, respectively.
34
for this industry sector, is 34.11 days, indicating that firms are not at the optimal working capital level. For Wholesale and Retail Trade sector, in column (4), the optimal working capital level is 218.15 days, the median working capital level for this sector is 18.38 days, showing that firms are not at the optimal working capital level. Finally the Transportation sector, in column (5), the optimal working capital level is 63.76 days which is the lowest optimal level compared to the other two sectors. Transportation sector presents also the lowest median working capital length, 9.49 days, indicating, that this sector is below the optimal level.
Therefore, firms within different industry sectors are likely to present different levels of working capital. Industry practices are significant determinants of firms’ WCM policies, because distribution of trade credit, management of inventories and the ability to postpone payments depends on industry structure. Therefore, each sector should increase investment in WCM, in order to increase profitability. When looking deeply to compare these sectors, Construction is expect to present high levels of accounts receivables and payables, while for the Wholesale and Retail Trade levels of accounts receivables are very low, having more impact the management of inventories and payables. Finally, for Transportation this present almost no inventory levels but a relevant weight for accounts receivables and payables.
35
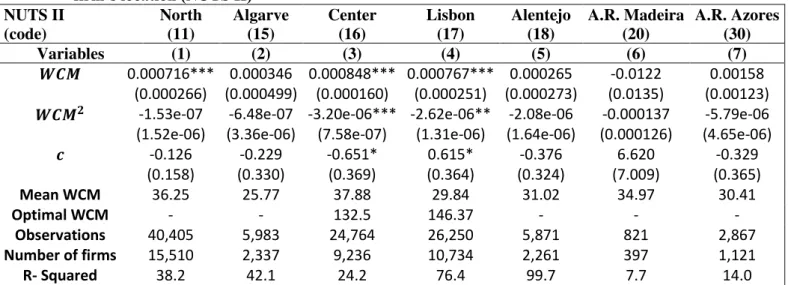
Table 8, analyses the existence of a non-linear relationship between WCM and
profitability, according to firm’s geographic location, using the second level of Statistic Territorial Units (NUTS II), we have the following regions: North Region, Center Region, Lisbon, Alentejo, Algarve, Autonomous Region of Madeira and Azores.
Table 8 - Working Capital Management relationship with firm’s profitability according to
firm’s location (NUTS II)
NUTS II (code) North (11) Algarve (15) Center (16) Lisbon (17) Alentejo (18) A.R. Madeira (20) A.R. Azores (30)
Variables (1) (2) (3) (4) (5) (6) (7)
𝑾𝑪𝑴 0.000716*** 0.000346 0.000848*** 0.000767*** 0.000265 -0.0122 0.00158 (0.000266) (0.000499) (0.000160) (0.000251) (0.000273) (0.0135) (0.00123)
𝑾𝑪𝑴𝟐 -1.53e-07 -6.48e-07 -3.20e-06*** -2.62e-06** -2.08e-06 -0.000137 -5.79e-06
(1.52e-06) (3.36e-06) (7.58e-07) (1.31e-06) (1.64e-06) (0.000126) (4.65e-06)
𝒄 -0.126 -0.229 -0.651* 0.615* -0.376 6.620 -0.329 (0.158) (0.330) (0.369) (0.364) (0.324) (7.009) (0.365)
Mean WCM 36.25 25.77 37.88 29.84 31.02 34.97 30.41
Optimal WCM - - 132.5 146.37 - - -
Observations 40,405 5,983 24,764 26,250 5,871 821 2,867
Number of firms 15,510 2,337 9,236 10,734 2,261 397 1,121
R- Squared 38.2 42.1 24.2 76.4 99.7 7.7 14.0
This table reports the regression estimates for our equation, using FE robust standard errors methodology, during the period 2004-2009. The variables used in this analysis are as follows. Variables are as follows PRO = Firm Profitability; PROt-1= Firm Profitability in previous period; WCM= Number of days of Working Capital Management; WCM2=
Squared Number of days of Working Capital Management; GROWTH= Logarithm of Sales; LEV= Firm Financial Debt Ratio; Gender= CEO’s gender; Age= CEO’s comprehended interval of years; Education Level= CEO’s educational experience; Foreign= CEO’s Nationality; C is the intercept term. The dummy variables: “Gender”, “Age 20-29”, “Age 30-39”, “Age 40-49”, “Age 50-60” “Very Low Education”, “Low Education”, “Medium Education”, “High Education”, “Foreign”, “Year of reference”, “Industry Sector”, “Size” and “Age” are control variables for CEO and firm characteristics. Some dummy variables are omitted in order to avoid collinearity problems. R-squared expressed in percentage. ***, ** and * mean statistical significance at the 1% level, 5% level and 10% level, respectively.
36
WCM length of this region, 29.84 days, showing that these firms are not at the optimal level.