C
ONTABILIDADE
,
F
ISCALIDADE E
F
INANÇAS
E
MPRESARIAIS
T
RABALHO
F
INAL DE
M
ESTRADO
D
ISSERTAÇÃO
G
OVERNANCE AND
T
AX
M
ANAGEMENT
:
D
OES IT
MATTER
?
E
VIDENCE FROM
S
PAIN
.
A
NA
I
SABEL
L
OPES DOS
S
ANTOS
C
ONTABILIDADE
,
F
ISCALIDADE E
F
INANÇAS
E
MPRESARIAIS
T
RABALHO
F
INAL DE
M
ESTRADO
D
ISSERTAÇÃO
G
OVERNANCE AND
T
AX
M
ANAGEMENT
:
D
OES IT
MATTER
?
E
VIDENCE FROM
S
PAIN
.
A
NA
I
SABEL
L
OPES DOS
S
ANTOS
O
RIENTAÇÃO:
P
AULOM
ANUEL DEM
ORAISF
RANCISCOAbstract
This paper investigates the role of corporate governance devices on tax management. This is done by analysing 103 Spanish listed firms through four different regressions models, each associated with a different corporate governance mechanism: (1) board of
directors’ composition, (2) CEO’s characteristics, (3) directors’ compensation structure and (4) ownership structure. Extending existing literature on this subject, the results support the view that corporate governance has, in fact, an important impact on tax management. The conclusions also support the idea that shareholders (and not only managers) may be interested in reducing the firms’ tax burden, as it is an opportunity to improve its performance and earn more money. The present study may provide insights into how legislators may reduce situations where taxes are managed in an excessive way
and help define the firms’ corporate policies.
Keywords: corporate governance; tax management; effective tax rate; Spanish listed firms.
Resumo
Este estudo tem por objectivo investigar o papel do governo das sociedades na gestão fiscal. Isto é feito analisando 103 empresas espanholas cotadas através de quatro regressões diferentes, cada uma associada a um mecanismo de governo das sociedades distinto: (1) composição do conselho de administração, (2) características do CEO, (3) estrutura compensatória dos directores e (4) estrutura de detenção. Os resultados obtidos confirmam a literatura existente sobre este tema, demonstrando que o governo das sociedades tem, de facto, um impacto importante na gestão fiscal. As conclusões mostram também que os accionistas (e não apenas os gestores) podem estar interessados em reduzir a carga fiscal das empresas, uma vez que esta é uma oportunidade para aumentar o desempenho destas e ganhar mais dinheiro. Este estudo pode ajudar a compreender como os legisladores podem reduzir as situações em que os impostos são geridos de forma excessiva e ajudar a definir as políticas corporativas das empresas.
Agradecimentos
No decorrer da realização deste trabalho contei com o apoio de muitas pessoas
que foram essenciais para a sua concretização.
Em primeiro lugar, gostaria de expressar os meus mais sinceros agradecimentos
ao meu orientador, Professor Paulo Francisco, pelas suas sugestões, comentários e,
principalmente, pela sua disponibilidade para me ajudar em qualquer fase deste
trabalho.
De uma forma especial, agradeço aos meus pais e ao meu namorado, por
acreditarem em mim e me apoiarem incondicionalmente.
Agradeço também aos meus colegas e amigos, que sempre me deram força para
continuar, mesmo quando a vontade faltava, para além de me ajudarem a tornar as
Index
Table index ...IV
Acronyms ... V
1. Introduction ... 1
2. Literature review and hypothesis ... 3
2.1. Governance and taxes ... 3
2.2. Hypotheses ... 5
2.2.1. Board of directors characteristics... 5
2.2.2. CEO characteristics ... 9
2.2.3. Board compensation ... 10
2.2.4. Ownership structure ... 11
3. Contextual setting ... 13
4. Data and Methodology ... 15
4.1. Data... 15
4.1.1. Dependent variable ... 16
4.1.2. Independent variables... 17
4.1.3. Control variables ... 19
4.1.4. Model specifications ... 20
5. Results ... 22
6. Conclusion ... 33
7. References ... 36
Table index
Table I –Board characteristics results………...………...30
Table II –CEO characteristics results………..………...…33
Table III –Earnings results………...………...…...…35
Table IV –Ownership results………..………...…37
Table A.I –Variables description………...……44
Acronyms
CEO – Chief Executive Officer
CNMV – Comisión Nacional del Mercado de Valores
ETR – Effective tax rate
MBA – Master of Business Administration
1. Introduction
This study aims to investigate the role of corporate governance devices on tax
management. This analysis is interesting because tax planning generally requires
complex operations that may be designed solely to hide its true intentions (tax
avoidance), which may lead to managerial opportunism (Desai and Dharmapala, 2007).
This type of behaviour can, in turn, reveal agency problems that may reduce
shareholders value. On the other hand, tax management can be positively related to firm
performance, since it reduces its tax burden. This is, therefore, a theme that affects
several agents: the firm, its shareholders, its managers and its directors.
If the corporate governance mechanisms that influence these actions could be
understood, new insights could be obtained concerning the means by which corporate
governance influence firm performance.
To do this analysis, data from 103 Spanish listed firms was collected and
examined through four different regressions models, each associated with a different
corporate governance mechanism: (1) board of directors’ composition, (2) CEO’s
characteristics, (3) directors’ compensation structure and (4) ownership structure.
The results show that a larger board of directors and with more inside members
is related to lower ETR, possibly due to less effective monitoring and more knowledge
about the business. Conversely, the type of auditing firm is negatively associated with
tax management. The education of the CEO also revealed to be important, since a law
or MBA course appears to lead to more tax management, due to the higher knowledge
of tax management devices and laws that CEOs have. The board compensation structure
is another relevant issue, indicating that as directors earn more, they are less willing to
literature (e.g., Desai and Dharmapala, 2006; Rego and Wilson, 2009; Armstrong,
Blouin and Larcker, 2011) the variable portion of compensation has a negative relation
with the ETR, showing that compensation contracts closely tied to firm performance
lead to more aggressive tax management. Finally, the dispersion of ownership and the
existence of restrictions to the market of corporate control are associated with lower
ETR, suggesting that, as the Spanish market is not very active, the effect of these
measures is not as strong as expected.
The way the relation between corporate governance and tax management is
analysed here is innovative and contributes to the literature in several ways. First, as far
as the author knows, there are no studies relating these variables in Spain. Some authors
investigated the effect of several corporate governance variables on firm performance,
but haven’t focused on the fiscal aspect (Miguel, Pindado and Torre, 2003;
García-Castro and Aguilera, 2012). Additionally, this study analyses a wide range of specific
governance factors, while other authors have only used aggregate indices of governance
and/or focused in a particular set of corporate governance devices (e.g. Desai and
Dharmapala, 2006). Finally, this study extends a recent stream of empirical literature
that analyses the role of corporate governance on tax planning (e.g. Minnick and Noga,
2010; Lanis and Richardson, 2011).
With respect to policy implications, the present study may help Spanish
legislators to better understand the relations between corporate governance and tax
planning within listed firms. This will possibly allow them to reduce situations where
taxes are managed in an excessive way. This study is also important to the definition of
the firm’s corporate governance policies, since it identifies the mechanisms that
The remaining of the study is organized as follows. Part 2 presents the literature
review as well as the four different hypotheses proposed. In the third part, the contextual
setting of the Spanish market is exposed. Part 4 shows the data and the methodology
used and in part 5 the results are presented. Finally, in part 6 the results are discussed
and the conclusions are presented.
2. Literature review and hypotheses
2.1.Governance and taxes
This study focus is on the relationship between tax management and corporate
governance. Given this, it is important to define each of these concepts.
According to Wahab and Holland (2012), tax management can be defined as the
activities designed to produce a tax benefit. In many cases, this is allowed by the
legislator and the firm can choose how to design its transactions, so, when a company
manages its taxes, it is not doing anything illegal (Dyreng, Hanlon and Maydew, 2008).
Nevertheless, there are other types of actions that may be illegal (tax evasion) or fall in
the “grey area” (tax avoidance).
Tax management can bring costs and benefits for shareholders. Lanis and
Richardson (2011) argue that the benefits are associated with the tax savings that can be
obtained, while the costs include implementation costs of the tax management
strategies, potential sanctions from tax authorities and reputational and political costs.
However, literature addressing the relationship between tax management and firm
performance argue that tax planning is a value enhancing activity and that shareholders
hold that belief (Graham and Tucker, 2006; Desai and Dharmapala, 2006; Minnick and
The concept of corporate governance includes the “procedures and processes
according to which an organization is directed and controlled” (European Central Bank,
2004). It also incorporates the manner in which the rights of the shareholders and other
stakeholders are taken into account, the distribution of rights and responsibilities in the
organization and the rules and procedures for decision-making (European Central Bank,
2004). The main goal of corporate governance is to avoid the agency problems that
result from the agency theory developed by Jensen and Meckling (1976). Agency
problems occur because the agent (managers) will always have some incentives to act in
his own interest, rather than in the interests of the principal (shareholders). A good
corporate governance system can help align the interest of these two parties, avoiding
agency problems.
If tax management improves firm performance then one should see a positive
relationship between better corporate governance devices and tax management.
However, as Desai and Dharmapala (2007) suggest, tax management often requires
managers to perform complex transactions with some secrecy, which may cause
managerial opportunism and diversion of rents from shareholders. When corporate
governance is weak, managers have more opportunities to divert funds (Desai and
Dharmapala, 2009).
Given this, the question of whether better governance leads to better tax
management is puzzling. On the one hand, managing taxes may decrease tax burdens
and increase firm value if the benefits of tax management more than offset its costs.
However, better corporate governance devices may prevent managers from avoiding
taxes, putting pressure on them to be more transparent and limiting firms from
Considering all the arguments presented above, the impact of various corporate
governance mechanisms on tax management will be empirically analysed. First, the
structure and characteristics of the board of directors, as well as various Chief Executive
Officer’s (CEO) attributes will be investigated. Finally, the impact of board’s
compensation on tax management and the way ownership structure influences this
variable will also be analysed.
2.2.Hypotheses
2.2.1.Board of directors characteristics
The board of directors and its composition are considered the most important
and effective corporate governance mechanisms and some tax authorities, accountants
and investors have already recognized this (Fama and Jensen, 1983; Lanis and
Richardson, 2011). One example of this acknowledgment is the inclusion of rules
concerning the number of independent board members in the Spanish code of good
corporate governance (Código unificado, 2006), where it is advised that independent
directors represent, at least, one third of the total number of directors.
The board of directors’ goal is to control managers to prevent them from
harming shareholders. The board is, therefore, a system that separates management from
control (Fama and Jensen, 1983). But one might ask: how many members should an
effective board of directors have? Jensen (1993) argues that when the board is small it
performs a better controlling function, because a larger board is more easily controlled
by the CEO. Similarly, Beasley (1996) and Yermack (1996) show that small boards are
more effective, even though larger boards can have more experience and more
independent members, which are necessary to guarantee a good supervision of
Board members can be divided into inside and outside directors and outside
directors can also be considered independent or grey directors. Inside directors are the
managers of the corporation, while outside directors include all non-employee members
of the board. An independent director has no relation with the firm, whereas a grey
director has some relation other than being part of the board. Therefore, the last group
can be a violation of independence rules, as they are not totally independent from
management (Hermalin and Weisbach, 1988; Beasley, 1996; Klein, 2002; Uzun et al.,
2004).
Fama (1980) and Fama and Jensen (1983) argue that the composition of the
board is critical in establishing an effective supervision mechanism and emphasize the
value of having both inside and outside members on the board. Inside directors have
access to valuable information about the firm’s activities that is necessary to control the
decision-making process. However, outside members have more incentives to monitor
management and guarantee that the firm is creating value to shareholders.
Consequently, a higher proportion of independent directors may increase the board’s
monitoring effectiveness, avoiding excessive tax management (Fama, 1980; Fama and
Jensen, 1983; Beasley, 1996; Cornett, Marcus and Tehranian, 2008; Lanis and
Richardson, 2011). Nevertheless, some authors consider that there is no significant
evidence that a highly independent board brings better performance (Bhagat and Black,
1999; Brown and Caylor, 2004). Even though the relation between board independence
and tax management doesn’t seem to be straightforward, a higher percentage of
independent members is predicted to lead to higher ETR, because with more
supervision, managers do not manage taxes so effectively by using opaque devices
experience about the business, it is expected that the inclusion of more inside members
in the board is responsible for a higher level of tax management, since they know better
how to reduce the firm’s ETR.
Directors’ gender seems to be a relevant factor as well. Even though the majority
of board members are men, Singh and Vinnicombe (2004) and Terjesen, Vinnicombe,
and Freeman (2007) believe that gender diversity within the board improves
management performance. Therefore, a negative relation between the percentage of
female board members and the level of tax management can be inferred.
In some companies, the CEO and the president of the board are the same person
(CEO duality). When this happens, the CEO can’t perform his functions as president
without taking into consideration his own interests, which reduces the effectiveness of
the board as a monitoring tool and increases the probability of tax management (Jensen,
1993; Cornett, Marcus and Tehranian, 2008; Lanis and Richardson, 2012). Spanish
corporate governance rules also consider this problem, recognizing that duality may
have advantages and disadvantages. If function accumulation gives the firm a clear
leader, internally and externally, reducing the costs of coordination, having too much
power concentrated in only one person is dangerous and may cause conflict of interests
(Código unificado, 2006). Given this, it is anticipated that the level of tax management
will be higher in firms where CEO duality is present.
The board of directors should meet regularly to guarantee its effectiveness. The
number of meetings can be related to firm’s performance in two opposite ways: more
frequent meetings increase the supervision made by directors, even though it represents
1999). Consequently, it is expected that more frequent board meetings results in lower
levels of tax management, due to higher monitoring from directors.
In an attempt to improve its control activities, the board of directors typically
delegates some responsibility to an audit committee (Beasley, 1996; Agrawal and
Chadha, 2005). This committee provides the board with knowledge about the firm’s
financial statements and other financial information that allow directors to make
decisions in a more informed and efficient way. This also helps to reduce agency issues
caused by manipulated financial statements (Klein, 2002). The size of this committee
and the frequency of meetings may also be relevant, because larger committees are
more efficient, even though they have higher associated costs, and more frequent
meetings increase the accuracy of supervision, improving the performance of the firm
(Aldamen et al., 2011). A similar argument can be made about the executive committee,
which some firms have as a separate body from the board of directors that has some
power to make and implement a few organizational decisions.
Another relevant issue is the quality of the external auditors, since with better
auditing, managers are less likely to use less transparent devices to manage taxes. A
common approach is to consider that the Big Four auditing firms (Deloitte Touche
Tohmatsu, PricewaterhouseCoopers, Ernst & Young and KPMG) perform better than
smaller firms, due to their higher experience. Although this may not be completely true,
it will be considered that a firm audited by one of the Big Four tends to have a higher
ETR. Given the above discussion the following hypothesis is developed:
2.2.2.CEO characteristics
The CEO has an important role in a corporation’s board of directors. He is
appointed by the board and his responsibilities include managing the operations of the
firm and making key corporate decisions. In some cases, entrenched CEOs may even
have influence on new board members hiring and compensation policy. This means
that, in some situations, the CEO has the ability to influence the board, compromising
its independence and monitoring role.
Further, CEO’s personal characteristics, namely his gender, age, tenure and
education, may influence the level of tax management a firm engages in. According to
Smith, Smith and Verner (2005) and Peni (2012), having a female CEO has a positive
influence on firm’s corporate governance and performance, therefore reducing its ETR.
However, none of these studies states that a male CEO has a negative impact, so no sign
will be predicted for the relation between these two variables.
Cornett, Marcus and Tehranian (2008) assert that an older CEO has more
experience and knowledge about the company and the sector in which it operates, so
firm’s performance is improved. Given this, it is expected that tax management
increases with the age of the CEO.
Concerning the years the CEO has been in that position, Beasley (1996) believes
that a less senior CEO might be less effective in their duties, while a more senior one is
likely to be less vulnerable to group pressure, acting in a more independent way.
Nevertheless, a more experienced CEO may get entrenched within the firm and have
more power to influence the board, which reduces his independence and willingness to
control managers’ actions (Hermalin and Weisbach, 1988). Since the relation between
A similar assumption will be made in relation to CEO education. A CEO that
has a management or MBA course might be better prepared to deal with specific issues
concerning the business of the firm. However, other types of courses may also be
helpful, since the CEO becomes more aware of other possible problems. Considering
these arguments, the following hypothesis is formulated:
H2: Firm ETR is a function of CEO characteristics.
2.2.3.Board compensation
The members of the board of directors are compensated through money and
other benefits and the amount received might have some influence on their behaviour
and, consequently, on the level of tax management. The monetary compensation may be
classified into fixed, variable or other (subsistence allowance or stock options, for
example). It can also be classified according to the type of directors who earn it (inside
or independent directors).
The compensation topic has been considered a solution to agency problems,
since it can align the interests of managers and shareholders (Jensen and Murphy, 1990;
Wahab and Holland, 2012). For Desai and Dharmapala (2006), if managers’
compensation is connected to the value of firm’s equity, their interests will be similar to
those of shareholders (both will want to increase firm value). However, in terms of tax
management, this compensation policy may have two distinct effects. On the one hand,
managers are more likely to increase firm value through tax evasion, because the results
will be better, but, on the other hand, their behaviour will be less opportunistic, since
Given this, the impact of the compensation policy on tax management depends
on the quality of the corporate governance system, being more visible when a firm has
good governance. Following this discussion, the hypothesis to be tested is:
H3: Firm ETR is a function of board compensation structure.
2.2.4.Ownership structure
According to Desai and Dharmapala (2007), the ownership structure is
influenced by the problems created by bad governance and can influence firm value by
being associated with taxes and tax policy.
The majority of studies relate ownership concentration or insider ownership
(shares hold by members of the board) to firm performance (Miguel, Pindado and Torre,
2003). Concerning the first variable, most authors believe that big shareholders (the
ones with more than 5% of shares) have more incentives to monitor managers than
small ones, not only because they have more power, but also due to what they might
lose if managers don’t act correctly (Shleifer and Vishny, 1986; Jensen, 1993; Cornett,
Marcus and Tehranian, 2008). Consequently, one might expect that a firm with a more
concentrated ownership has better performance and, therefore, a lower ETR.
As it was mentioned before, some companies pay board members with stock
options. Therefore, part of the shares of the firm is owned by its directors, who become
more motivated to increase its value. However, as pointed out, this can be accomplished
though fraud or more aggressive strategies (Jensen and Meckling, 1976; Cornett,
Marcus and Tehranian, 2008). Some authors argue that when independent directors own
a substantial part of equity they are more likely to question and challenge managers’
1976; Jensen, 1993; Klein, 2002). Conversely, if board members have a large stake in
the firm, which gives them enough voting power or influence, they may follow their
own goals without taking into account what is best for the firm. Given this, higher
insider ownership leads to worst firm performance, because the board of directors gets
entrenched with management and does not perform an effective monitoring (Fama and
Jensen, 1983; Jensen, 1993; Wahab and Holland, 2012). According to Miguel, Pindado
and Torre (2003), what defines which effect will be stronger is the corporate governance
system. For Spanish firms, it is assumed that higher insider ownership will lead to less
tax management.
Besides the discussed variables, some other aspects might impact tax
management. The general meeting is where shareholders can exercise their voting
power and supervise managers’ actions. Consequently, it is predicted that the bigger the
participation of shareholders in the general meetings, the better the monitoring of
managers will be and, thus, the less tax management will happen.
Related to this is the fact that some firms create voting restrictions or different
classes of shares, meaning that only a shareholder with a minimum number or type of
shares has the right to vote in the general meeting. This reduces the monitoring power
of these agents, leaving more room for managers to act opportunistically. Another
common situation is anti-takeover measures that have the objective of avoiding the
acquisition of the firm by another corporation or increase the costs of this operation.
According to Campbell et al. (2011), the managers of firms with these limitations have
more opportunities to act according to their interests, since the market for corporate
control becomes less effective. Despite creating inefficiencies, this type of limitations
and larger ones (Shleifer and Vishny, 1989). Finally, in some firms, shareholders create
a pact to guarantee that their interests are taken into account. This also reduces market
efficiency, since shareholders will act in a coordinated manner to avoid losing their
power in the firm. Given this, in the presence of these four types of restrictions, it is
anticipated higher tax management and, consequently, a lower ETR. The hypothesis
developed according to the above discussion is:
H4: Firm ETR is a function of the firm ownership structure.
3. Contextual setting
In order to analyse Spanish firms’ characteristics, it is necessary to understand its
corporate governance system and fiscal context.
Regarding corporate governance, García-Castro and Aguilera (2012) found that
Spain selects the best practices of Anglo-Saxon countries concerning transparency and
independence of the board. Despite this, Spanish firms have excessively large boards
with very powerful chairmen, with authority to appoint and dismiss directors, and
CEO/chairman duality, which firms try to compensate by appointing independent
directors with more power and responsibilities. However, there seems to be a lack of
independent members in most of the boards.
Other corporate governance mechanisms are used more effectively by these
firms, such as the disclosure of any conflict of interest among directors, the mandatory
existence of an audit committee that guarantees the independence of external auditors
and the use of stock options as an incentive system.
In terms of the Spanish market, these authors found recently privatized firms, a
changes improved market efficiency, competition and transparency, creating corporate
governance codes which increased the safety of financial markets.
García-Castro and Aguilera (2012) also found that the Spanish stock market is
highly concentrated when compared to other European countries, having a reduced
number of investors who dominate the transactions and market capitalization.
Nevertheless, the number of institutional investors (those who trade in large quantities
or monetary amounts, having preferential treatment and lower commissions, like
pension funds) is lower than in other similar countries.
Another study about Spain tried to find a relation between ownership
concentration and the value of the firm. Miguel, Pindado and Torre(2003) found that up
to a certain level of ownership concentration (87% in their study), the value of the firm
increases with this variable, as a consequence of better monitoring from big
shareholders. From that level on, the value of the firm decreases, because small
shareholders become expropriated by larger ones.
These authors also found a negative relation between firm value and its size,
which means that larger firms tend to have more agency problems and asymmetric
information that require a more concentrated ownership to achieve better performance.
To investigate if a firm is engaging in tax management or not, it is necessary to
know how the Spanish tax system works. According to the legislation (Real Decreto
Legislativo 4/2004), the corporate tax (Impuesto sobre Sociedades) has to be paid by all
firms with headquarters in Spain. Small and medium-sized enterprises can benefit from
a tax rate reduction during a 3 year period.
In terms of tax rates, Spain is composed of several regions, such as Basque
However, the general rule is that for a taxable income between 0 and 300.000 Euros the
tax rate is 25%, being 30% for a taxable income above that amount. However, this rate
changed over the period analysed in this study: before 2007, the tax rate was 30% for a
taxable income up to 120.202 Euros and 35% for larger amounts. Given this, the
existence of tax management strategies will be assumed when the ETR of a firm in a
certain year is below 30%, which is the higher rate applicable in the majority of the
years under analysis.
4. Data and Methodology
In order to test the hypotheses stated in part 2, several types of data from Spanish
firms was collected. As Dyreng, Hanlon and Maydew (2008) state, larger firms tend to
manage their taxes more effectively; therefore the focus of this study is on listed firms.
The continuous market (SIBE), rather than the Spanish index (IBEX 35), was chosen,
because that is where the most representative stocks are traded and it accounts for a
higher trading volume.
4.1.Data
All the data related to corporate governance was hand collected from the
corporate governance reports disclosed by firms at the CNMV website and their own
websites, corresponding to the years between 2006 and 2010. The financial information
was obtained from the Bloomberg database.
The initial sample comprised 126 firms, which represent all firms listed in SIBE
in 2011. The availability of corporate governance reports was analysed to obtain a
balanced panel data and 22 firms were eliminated due to the lack of reports in the
bank that followed slightly different corporate governance rules. The final sample
comprised 103 firms, which correspond to 515 firm-years.
4.1.1.Dependent variable
To measure tax management, the effective tax rate (ETR) was used, computed as
income tax expense, as shown in the financial statements, over pre-tax income (similar
to Janssen and Buijink, 2000; Rego, 2003; Phillips, 2003). To assess the presence of tax
management, it will be considered that a company has managed its taxes effectively
when its ETR is below the statutory tax rate from the country where it operates
(Minnick and Noga, 2010).
The way this rate is defined may have some problems, since the ideal would be
to have the real value of taxes paid by the firm in each year. However, once that type of
data is confidential and is not disclosed by companies, it is necessary to calculate it
using available information. According to Dyreng, Hanlon and Maydew (2008), the rate
calculated in this manner includes current and deferred taxes, which represent taxes to
be paid or received in the future and not taxes from the current period. Additionally, tax
expense is an accounting measure and may not represent the amount effectively paid as
taxes, due to differences in the accounting and tax treatment of several situations (for
example, to calculate depreciation, the accounting system allows managers some
judgment to decide the useful life of equipment. However, the tax system has rigid
rules, which may create differences in the amount of taxes determined through each
method). Given this arguments, the idea that better tax management leads to lower ETR
may be wrong, which is a possible limitation of this study.
Furthermore, the ETR doesn’t take into account implicit taxes, which may be
return of an investment, before taxes, is lower after reducing the tax rate. This means
that a tax strategy is effective only if implicit taxes are not higher than the saved explicit
taxes (Sartori, 2009).
The ETR also brings some problems when pre-tax income is negative, because it
causes the rate to become negative, which is difficult to interpret. Even when pre-tax
income is positive, it is possible to obtain a meaningless rate if income tax expense is
negative (the tax rate becomes negative) or if it is much higher than pre-tax income (the
tax rate is above 100%). Most authors prefer to classify these observations as undefined
and ignore them, while adjusting the rest of the observations between 0% and 100%
(Dyreng, Hanlon and Maydew, 2008). Others try to calculate different measures of
ETR, like Plesko (2003) or Gupta and Newberry (1997). However, a different approach
will be taken in this study.
To avoid negative or higher than 100% ETRs some modifications were made to
the collected rate. The ETR of all firm-years with negative pre-tax income and positive
income tax expenses was set equal to 100%, which corresponds to 6,6% of the total
sample. The observations with positive pre-tax income and negative income tax
expenses were corrected to 0%, which happened 10,3% of the times. Finally, when both
pre-tax income and income tax expenses were negative, the ETR was set equal to 0%,
representing 12,6% of the sample. This means that 67,8% of the observations were not
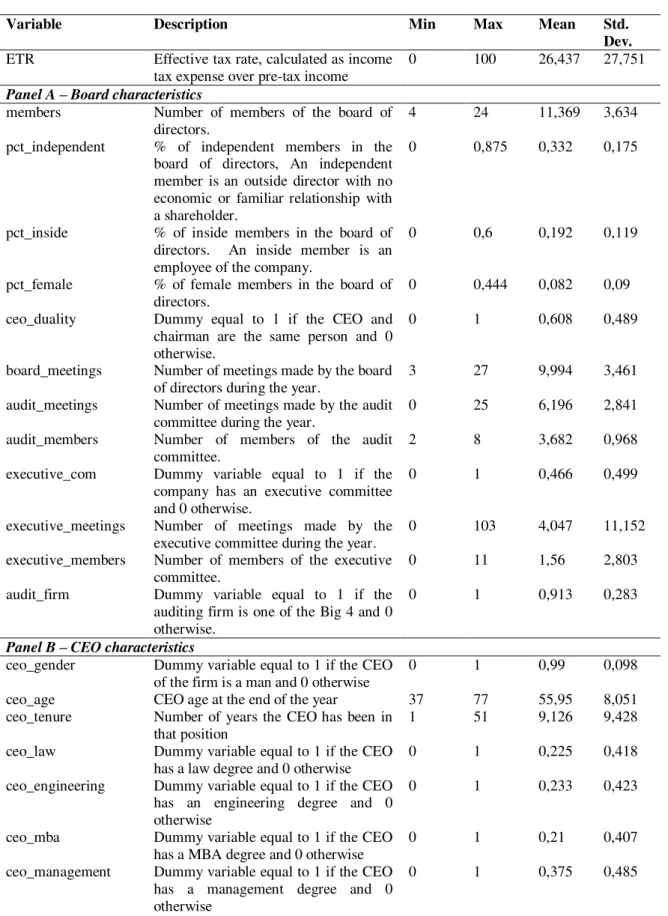
modified. The descriptive statistics for ETR are presented in Table A.I, in appendix.
4.1.2.Independent variables
As it was mentioned before, the analysis of the impact of the different corporate
governance mechanisms on tax management was divided into four groups. The various
Panel A describes the variables related to the structure and characteristics of the
board of directors and the following variables were included: members, measured as the
total number of board members; pct_independent and pct_inside, the percentage of
independent and inside directors, respectively; pct_female, the percentage of women in
the board; ceo_duality, a dummy variable equal to 1 if the CEO and chairman are the
same person; board_meetings, measured by the number of meetings during the year;
audit_meetings and audit_members, which give the number of meetings of the audit
committee and its size; executive_com, a dummy variable that equals 1 if the firm has
an executive committee; executive_meetings and executive_members, measuring the
number of meetings and members of the executive committee; and audit_firm, which
takes the value of 1 if the firm is audited by one of the Big Four auditing firms.
In Panel B, the various CEO attributes are described, including ceo_gender,
which equals 1 if the CEO is a man; ceo_age, measured by the age of the CEO at the
end of each year; ceo_tenure, which gives the number of years the CEO has been in that
position; and a series of variables related to CEO education in law, engineering, MBA,
management or other courses.
The variables associated with board compensation are presented Panel C,
comprising compens_avrg, measured by the average compensation earned by each
director; pct_comp_fix, pct_comp_var and pct_comp_other, which indicate the
percentage of the total compensation that is considered fixed, variable or other,
respectively; pct_comp_inside and pct_comp_indep, which measure the percentage of
total compensation earned by inside and independent directors.
Finally, in Panel D there are the variables related to ownership structure, namely
percentage of shares not hold by big shareholders; board_owner, measured by the
percentage of shares owned by directors; votes_gm, which indicates the average
percentage of voting rights present in the general meeting; voting_restriction,
share_class, takeover and agreement, four dummy variables that equal 1 when there are
voting restrictions, different classes of shares, anti-takeover measures or shareholders’
agreements, respectively.
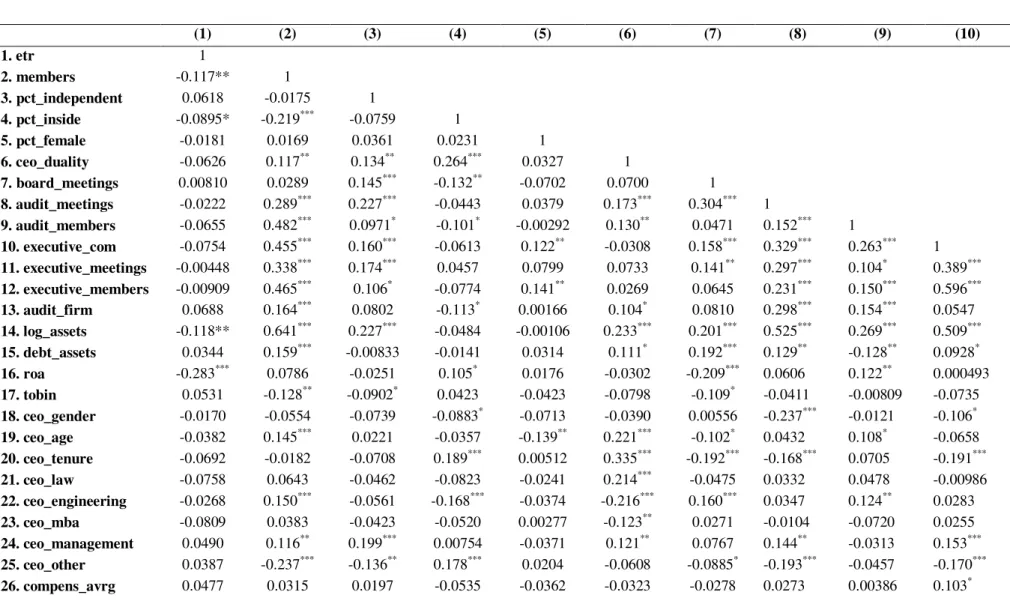
To test the correlation among all these variables, Table A.II in appendix presents
the correlation matrix.
4.1.3.Control variables
Several firm characteristics seem to be related to tax management and can
function as control variables. According to Dyreng, Hanlon and Maydew (2008), a
lower ETR is associated with larger firms, located in tax heavens, with a high ratio of
fixed assets and intangibles and high leverage.
Regarding the size of the firm, some studies found that larger corporations have
higher ETR, because they have more visibility and reputational risks and, consequently,
they don’t manage taxes as much as smaller companies (Rego, 2003). Other authors
believe that larger firms have more opportunities to reduce their tax burden due to their
higher economic and political power (Richardson and Lanis, 2007). Given this, the way
tax management is related to firm size is not clear.
Further studies focused on the relation between leverage and the agency theory
and concluded that the financing decisions have impact on the agency problems, since
the use of debt may cause debt holders to perform the monitoring activities instead of
the shareholders (Jensen and Meckling, 1976). Moreover, the use of debt implies that
have less money to spend in an opportunistic way. This means that leverage can
function as a corporate governance mechanism (Jensen, 1986). However, it is important
to remember that too much debt can bring excessive costs, particularly bankruptcy
costs, while creating reputational risks to the manager and the firm.
In what concerns the ETR, Janssen and Buijink (2000) found that leverage has a
negative impact on it, since interest is tax deductible, reducing the amount of tax paid to
the government. Also, the type of assets that the firm holds may influence its ETR,
because some benefit from tax deductions, such as tax credits or accelerated
depreciation (Gupta and Newberry, 1997; Mills, Erickson and Maydew, 1998).
The firm’s performance is also associated to the level of tax management that it
engages in. According to Lanis and Richardson (2012), when a company performs
badly, its managers become more concerned about profitability, increasing the
probability of tax management in order to maintain its reputation. This implies that the
higher the profitability of the firm, the higher should its ETR be.
Following previous empirical analyses, the following control variables were
included: log_assets, measured by the logarithm of total assets; debt_assets, the ratio
between total debt and total assets; roa, calculated as net income divided by average
total assets; and tobin, which represents the firms’ Tobin’s Q. These variables are
described in table A.I – Panel E.
4.1.4.Model specifications
To study how corporate governance variables related to the firms’ ETR, four
different models with the ETR as the dependent variable were estimated, according to
the four corporate governance mechanisms discussed in part 2. This process was chosen
inclusion of related variables into each of the models. All the models were estimated
using the OLS method and heteroskedastic robust coefficients were estimated,
controlling for sector and year effects.
In order to test the first hypothesis (H1) a first baseline model is estimated. This
includes all independent variables described in Table A.I – Panel A and can be
described as:
where i correspond to each of the 103 firms and t relates to years between 2006
and 2010. Here, board is a set of six board of director’s variables: members,
pct_independent, pct_inside, pct_female, ceo_duality and board_meetings.
The committee group of variables shows the existence, number of members and
number of meetings of the audit and executive committees of each firm in each year. It
is important to note that no dummy variable was created for the existence of an audit
committee because it was present in all firms in the sample. This group also considers
the type of auditing firm the company works with (audit_firm).
The model also uses three control variables: one for the size of the firm, other
for the leverage and the final one to control for profitability.
In model (2), the variables used to test H2 are related to CEO’s characteristics.
This model can be expressed as:
Where CEO includes the variables related to CEO’s gender, age and tenure and
The third model, used to test H3, includes variables associated with
compensation structure. Model (3) can, then, be described as:
where earnings is a set of variables that includes the average compensation
earned by each director (compens_avrg), as well as the percentage of the total
compensation that is considered fixed, variable or other. It also comprises the
percentage of compensation earned by independent and inside directors.
The final model includes the variables described in Table A.I – Panel D and is
expressed as:
In this model, ownership contains variables related to the ownership structure of
the firms, including top_3, free_float, board_owner, votes_gm, voting_restriction,
share_class, takeover and agreement.
5. Results
Table A.I shows the descriptive statistics of all the variables used to test the four
proposed hypotheses. The independent variable, ETR, has an average of 26,4%, a value
that is smaller than the threshold of 30% established in part 3. This indicates that the
majority of firms analysed between 2006 and 2010 engaged in successful tax
management, being able to reduce their ETR below the statutory tax rate applicable in
In Panel A it is observable that the boards of directors of the Spanish firms have
between 4 and 24 members and, on average, they are composed of 11 directors, with
87,5% being independent, which complies with the one third rule established by the
Spanish code of corporate governance, and 44,4% female. In 60,8% of the observations
there is CEO/chairman duality, meaning that, in these firm-years, the power was
concentrated in only one person. Concerning the frequency of meetings, on average, the
board of directors meets 10 times a year, while the audit and the executive committees
gather together less often (around 6 and 4 times a year, respectively). From the
firm-years in the sample, 91,3% are audited by one of the Big Four auditing firms.
As shown in Panel B, about 99% of CEOs are men (there are only 5
observations with a female CEO) and their ages are between 37 and 77, with an average
of 56 years. In terms of experience, the time CEOs have been in that position varies
between 1 and 51 years, with an average of 9 years of tenure. Concerning the education
of the CEO, all the courses are almost equally frequent, management being the most
common one.
Panel C illustrates that, on average, each member of the board earns 382
thousand Euros and this compensation can be divided into fixed (44%), variable
(17,1%) and other (38%). Concerning the type of members, 60% of the total
compensation is earned by inside directors, while independent directors earn only
15,6% of the total.
Finally, Panel D shows that the top 3 shareholders of the Spanish firms have, on
average, 35,7% of the shares, whereas board members own 25,08% of total equity. In
terms of participation in the shareholders’ general meetings, on average, 69% of the
decisions that are made in these meetings. Considering the different classes of shares
and anti-takeover measures, only a small percentage of firms presented these features.
However, in 26,8% of observations there are voting restrictions and in 25%
shareholders created pacts to ensure the protection of their rights.
Table A.II shows the correlation matrix for the variables being analysed. In the
first column it is observable that the dependent variable, ETR, has a linear relationship
with members, pct_inside, log_assets, roa, pct_comp_var, pct_comp_inside,
pct_comp_indep, votes_gm, voting_restriction and share_class. Among the explanatory
variables, there are several statistically significant correlation coefficients, the most
relevant being between members and log_assets, pct_independent and pct_comp_indep,
pct_inside and pct_comp_inside, audit_meetings and log_assets, executive_com and
both executive_members and log_assets, executive_meetings and both
executive_members and log_assets, executive_members and log_assets , ceo_age and
ceo_tenure, pct_comp_fix and pct_comp_other, pct_comp_inside and pct_comp_indep
and, finally, between top_3 and free_float. The presence of these high correlations can
cause high variance for the coefficient estimators when each pair of variables is
included in the same regression model.
Concerning the regressions, several specifications were made in each of the four
models, in order to analyse the impact of the different groups of variables in the firm’s
ETR. Table I shows the results for model (1), where five different specifications were
created. Model (1.1) includes all variables associated with the composition of the board
and its committees, using ROA as the control variable for profitability. Here, the
that a larger board might be less effective in monitoring managers, leading to a small
ETR as predicted, and supporting the view of Jensen (1993).
Table I
Board characteristics results
Predicted Sign Model (1.1) Model (1.2) Model (1.3) Model (1.4) Model (1.5) members - -0.966** -1.008** -0.625 -0.622
(2.11) (2.06) (1.51) (1.42) pct_independent + 3.487 4.800 5.685 5.831 (0.45) (0.60) (0.74) (0.73) pct_inside - -21.823* -31.719** -21.108* -26.352**
(1.78) (2.49) (1.74) (2.20) pct_female + -10.874 -15.662 -7.086 -7.938 (0.76) (1.06) (0.50) (0.57) ceo_duality - -1.511 0.246 -1.751 -0.880 (0.57) (0.09) (0.68) (0.35) board_meetings + -0.579 -0.190 -0.552 -0.475 (1.20) (0.38) (1.19) (1.04)
audit_meetings + 0.217 -0.012 0.442 (0.47) (0.02) (1.03) audit_members + 1.365 0.850 0.451 (1.20) (0.72) (0.46) executive_com + -3.779 -2.648 -0.703 -5.844* (1.08) (0.72) (0.22) (1.79) executive_meetings + 0.068 0.151 -0.000 (0.70) (1.45) (0.00) executive_members + 1.062* 1.119** 1.328**
(1.96) (1.99) (2.57) audit_firm + 10.263** 6.958 12.071***
(2.13) (1.30) (2.62)
log_assets ? -1.219 -2.239** -0.777 -0.444 -1.763** (1.15) (2.01) (0.81) (0.54) (2.02) debt_assets - -0.067 0.091 -0.082 -0.112 -0.125 (0.85) (1.11) (1.08) (1.46) (1.59) roa + -0.832*** -0.847*** -0.796*** -0.818***
(4.47) (4.54) (4.45) (4.85) tobin + 0.102
(0.09)
Constant 50.055*** 51.308*** 46.991*** 55.957*** 46.584*** (5.21) (4.57) (5.16) (6.78) (6.65) Industry dummy Yes Yes Yes Yes Yes Year dummy Yes Yes Yes Yes Yes R2 0.19 0.12 0.18 0.17 0.16 N 515 515 515 515 515 F 3.36 2.19 3.33 3.18 3.59 p-value 0.0000 0.0005 0.0000 0.0000 0.0000
executive_meetings and executive_members) and type of auditing firm (audit_firm). The control variables are: logarithm of total assets, as a proxy for firm size (log_assets), total debt over total assets, as a proxy for leverage (debt_assets) and ROA or Tobin-Q, as a proxy for profitability (roa or tobin). Heteroskedastic robust t-statistics are presented in parenthesis. *p < 0.1, **p < 0.05, ***p < 0.01
The coefficient for the percentage of inside members is also significant and
negative, according to H1, meaning that more inside members help reduce the firms’
ETR through higher experience and knowledge of the business. The positive coefficient
for the percentage of independent members also supports several authors’ idea that a
board with more independent directors has fewer opportunities to manage taxes (e.g.
Lanis and Richardson, 2011). According to Adams and Ferreira (2009), women are
better at monitoring and attend more board meetings, so a positive relation between the
percentage of female directors and the ETR was expected. However, the results show
that women might not be as effective supervisors as men, since a 1% increase in the
percentage of women decreases the ETR by 10%. This may be due to their lack of
visibility and power in the board (Singh and Vinnicombe, 2004).
Some other factors increase tax management, like the CEO/chairman duality
and, contrary to what was expected, the frequency of board meetings. Supporting Lanis
and Richardson (2012), the accumulation of functions in only one person reduces the
monitoring effectiveness of the board, reducing the firm ETR by 1,5%. Concerning the
number of board meetings, it is possible that boards are also engaging in tax
management strategies to improve firm performance (Vafeas, 1999).
The number of meetings and size of the audit committee are positively related to
firms’ ETR, supporting Lanis and Richardson (2011) idea that the existence of this
committee may indicate more effective supervision, reducing managers’ opportunism.
Another significant result is the size of the executive committee, where an
committee is more effective in monitoring managers. The type of auditing firm seems to
be relevant as well, indicating that firms audited by one of the Big Four auditing firms
have an increase in their ETR of about 10%.
Finally, the coefficient for the control variable ROA is also significantly
negative. This means that, the profitability of the firm is negatively associated with its
ETR, which supports Miguel, Pindado and Torre (2003) findings. The level of leverage
has a negative coefficient, indicating that higher debt leads to a decrease in ETR, which
can be explained by the fact that interest is tax deductible (Janssen and Buijink, 2000).
The second specification (1.2) is similar to the first one, but the control variable
for profitability is replaced by Tobin-Q. In this case, the number of members of the
board is also significant and negative, as well as the percentage of inside members and
the size of the executive committee. The size of the firm also has a significant
coefficient, indicating that larger firms can reduce their tax burden more effectively
(Richardson and Lanis, 2007).
Model (1.3) uses the variables that characterize the board of directors, but only
analyses how the existence of an executive committee impacts the ETR. The results are
similar to those of the first condition.
In specification (1.4) only board characteristics were considered, ignoring the
existence of committees. Once again, the results are consistent with those of previous
regressions.
Lastly, the final specification (1.5) simply considers the variables related to the
audit and executive committees. Here, the coefficient for the existence of an executive
committee is relevant and negative, meaning that when this committee is present the
monitoring of management by this committee. However, since it replaces the board in
some situations, it is possible that the power of that supervision mechanism is reduced
(Lara, Osma and Penalva, 2005). Nevertheless, the coefficient for the number of
members is positive, indicating that a larger committee becomes more effective,
reducing the firm’s opportunity to engage in tax management.
In the last row of Table I there is the p-value for the F statistic. Since all values
are very close to zero, the hypothesis of all coefficients being equal to zero is rejected
and the models can be considered adequate.
Table II presents the results for the four different regressions based on model
(2), which include variables related to CEO’s characteristics.
Table II
CEO characteristics results
Predicted Sign Model (2.1) Model (2.2) Model (2.3) Model (2.4) ceo_gender ? -1.338 -3.938 -1.932
(0.34) (0.97) (0.47) ceo_age - -0.060 -0.017 -0.070
(0.34) (0.10) (0.42) ceo_tenure ? -0.250 -0.240 -0.251
(1.57) (1.59) (1.64) ceo_law ? -5.448 -6.489*
(1.43) (1.73) ceo_engineering ? -3.685 -4.164
(0.84) (1.00)
ceo_mba ? -5.496* -5.400* -5.822* (1.85) (1.83) (1.89) ceo_management ? 1.170 0.320 2.197
(0.29) (0.08) (0.75) ceo_other ? -0.350 -2.059
(0.06) (0.37)
Constant 38.328*** 35.481*** 32.986*** 37.095*** (4.07) (4.00) (5.00) (4.09) Industry dummy Yes Yes Yes Yes Year dummy Yes Yes Yes Yes R2 0.08 0.07 0.08 0.08
N 515 515 515 515
F 2.40 1.85 1.91 2.19 p-value 0.0005 0.0232 0.0137 0.0033
As in the previous model, the first specification (2.1) contains all variables.
From the results it seems that a male CEO helps reduce the ETR by 1,4%, even though
this result is not statistically significant. As expected, an older CEO with more
experience in that function also reduces the firm’s tax burden, possibly because of his
better understanding of the market and its rules (Beasley, 1996; Cornett, Marcus and
Tehranian, 2008). In this model, only the variable related to MBA education has a
statistically significant negative coefficient, indicating that when the CEO has this type
of course, the ETR is lower, probably due to his higher knowledge about businesses and
the way market functions. The same result is obtained when the CEO has a law,
engineering or other courses, with management being the only type of education that
increases firm’s ETR.
Three more specifications were made, considering only CEO’s characteristics
and ignoring the type of education (2.2), only CEO education (2.3) and only education
related to management (2.4), but a similar result was obtained in all of them. However,
for the third regression, the coefficient for ceo_law is negative and significant, which
means that this type of course may also help reduce firm ETR, by providing knowledge
about the laws that allow the firm to reduce its tax burden.
Once again, analysing the p-value for the F statistic, all specifications can be
considered adequate at the 5% or higher level.
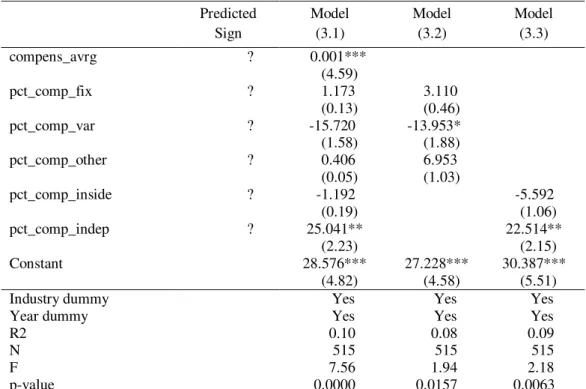
The results for model (3) are presented in Table III, where three specifications
Table III Earnings results Predicted Sign Model (3.1) Model (3.2) Model (3.3) compens_avrg ? 0.001***
(4.59)
pct_comp_fix ? 1.173 3.110 (0.13) (0.46) pct_comp_var ? -15.720 -13.953* (1.58) (1.88) pct_comp_other ? 0.406 6.953 (0.05) (1.03)
pct_comp_inside ? -1.192 -5.592 (0.19) (1.06) pct_comp_indep ? 25.041** 22.514**
(2.23) (2.15) Constant 28.576*** 27.228*** 30.387***
(4.82) (4.58) (5.51) Industry dummy Yes Yes Yes Year dummy Yes Yes Yes
R2 0.10 0.08 0.09
N 515 515 515
F 7.56 1.94 2.18
p-value 0.0000 0.0157 0.0063
Notes: The dependent variable is ETR, defined as income tax expense divided by pre-tax income. The independent variables are: average compensation earned by each director (compens_avrg), percentage of total compensation that is fixed, variable and other (pct_comp_fix, pct_comp_var and pct_comp_other) and percentage of total compensation earned by inside and independent directors (pct_comp_inside and pct_comp_indep). Heteroskedastic robust t-statistics are presented in parenthesis.*p < 0.1, **p < 0.05, ***p < 0.01
Specification (3.1) includes all variables related to compensation structure and
the most relevant result is the average compensation of each director, which has a
positive sign. This means that as the average amount rises, so does the firm ETR,
something that can be associated with the fact that directors prefer not to risk their
higher compensation by reducing the firm tax burden. Another variable with a
significant positive coefficient is the percentage of total compensation earned by
independent directors. As such, when these directors earn an additional 1% of total
compensation, the ETR rises by 25%. This can indicate that when independent members
earn more, they supervise managers in a more active and effective way, in order to
directors increases, since the ETR is reduced by almost 2% with a 1% increase in
compensation, possibly because inside members try to improve firm performance
through tax management strategies.
In the second specification (3.2) only the composition of total compensation
(fixed, variable or other) was considered and only one variable has a statistically
significant coefficient: the variable compensation percentage of total compensation.
Since this coefficient is negative, it shows that as the variable proportion of
compensation rises by 1%, the ETR lowers by almost 14%, a result consistent with the
fact that compensation contracts closely tied to firm performance lead to more
aggressive tax management.
Regression (3.3) analyses how the division of compensation among different
members of the board impacts the firm’s ETR and the only relevant result is, once
again, the percentage of total compensation earned by independent directors.
The p-value for the F statistic indicates that all specifications can be considered
adequate at the 5% or higher level.
Finally, the results for the last group of regressions are shown in Table IV. The
variables used in the first specification (4.1) include the amount of shares hold by the
members of the board and by major shareholders, as well as the existence of voting
restrictions created by companies and agreements among its shareholders. Here, most of
the results have signs contrary to those that were expected.
The percentage of voting rights in the shareholders’ general meeting has a
significant negative sign, while it was expected to have a positive impact on ETR. This
means that a higher level of participation in these meetings is associated with higher tax
meetings or they also believe that the tax burden of the firm is too high and needs to be
reduced through tax management strategies.
Table IV Ownership results Predicted Sign Model (4.1) Model (4.2) Model (4.3) top_3 - -0.200 -0.257
(0.85) (1.12) free_float + -0.276 -0.319
(1.24) (1.45) board_owner + 0.027
(0.55)
votes_gm + -0.246** -0.264** (1.99) (2.42)
voting_restriction - 6.881** 7.786** (2.04) (2.54) share_class - 24.421* 27.483**
(1.80) (2.01) takeover - 9.192 2.425
(1.16) (0.31) agreement - -6.077** -6.864**
(2.09) (2.37) Constant 67.291*** 76.304*** 26.652***
(2.72) (3.23) (6.18) Industry dummy Yes Yes Yes Year dummy Yes Yes Yes
R2 0.11 0.08 0.09
N 515 515 515
F 2.63 2.14 2.41
p-value 0.0001 0.0062 0.0013
Notes: The dependent variable is ETR, defined as income tax expense divided by pre-tax income. The independent variables are: percentage of shares hold by the top 3 shareholders (top_3), percentage of shares not held by big shareholders (free_float), percentage of shares owned by directors (board_owner), average percentage of voting rights present in the general meetings (votes_gm) and existence of voting restrictions, different classes of shares, anti-takeover measures or shareholders’ pacts (voting_restriction, share_class, takeover and agreement). Heteroskedastic robust t-statistics are presented in parenthesis. *
p < 0.1, **p < 0.05, ***p < 0.01
Another variable with an unexpected sign is the one that analyses the existence
of voting restrictions. The coefficient is positive, indicating that in the presence of these
limits the ETR is higher by almost 7%. This may suggest that when shareholders have
to comply with certain rules they feel more responsible and, consequently, they monitor
managers more closely, avoiding excessive tax management. A similar result was
weakness of the Spanish market for corporate control that makes it less sensitive to
these measures. However, the coefficient for the agreement variable is negative as
predicted, meaning that when shareholders create pacts they reduce market efficiency
even further, allowing managers to act in a more opportunist way and reducing the
firms’ ETR by 6%.
The second specification (4.2) ignores the existence of any type of restrictions
and includes only the top 3 shareholders, the free-float and the voting rights present in
the general meetings. Once again, the result for votes_gm is relevant and negative. The
final regression (4.3), which has results similar to the first one, analyses the impact of
the voting restrictions and agreements between shareholders.
Even though the coefficients are not significant, the results for the variables that
measure the free-float and the existence of anti-takeover measures are also contrary to
H4. In the first case, a positive impact was anticipated, but the result is negative, which
indicates that when ownership is dispersed the ETR is lower, once again due to a lack of
efficiency in the market for corporate control. This may also be the reason why, for
anti-takeover measures, even though it was predicted a negative sign, the result is positive,
meaning that when these procedures exist, the ETR rises 9%.
By analysing the p-value for the F statistic it is possible to conclude that all
specifications can be considered adequate at the 1% or higher level.
6. Conclusion
The impact of corporate governance on tax management was investigated in the
The results suggest that bigger boards are less effective, leading to lower ETRs.
Additionally, the number of inside directors is also negatively related to ETR, indicating
that this type of board members have more knowledge about the market in which the
firm operates and more experience, being easier for them to reduce the tax burden of the
firm. Another statistically significant result indicates that firms with an executive
committee have lower ETRs. Given that the executive committee can replace the board
of directors when immediate actions are needed, its decision-making power is high and
this may lower the importance of independent directors as supervisors of management
(Lara, Osma and Penalva, 2005). If these immediate decisions are related to tax
management, this committee may act according to managers’ interests, since there is
less monitoring from other members of the board. However, the results are mixed,
because a higher number of members in this committee seem to be related to higher
ETR, confirming the monitoring theory associated with it. Further, firms audited by one
of the Big Four auditing firms engage less in tax management strategies.
Regarding CEO characteristics, the results suggest that when the CEO has a law
or a MBA degree the firm’s tax burden is lower. An explanation for this may be the fact
that a law course allows the CEO to know the rules that regulate the firm and the market
where it operates and a MBA improves CEO understanding of the market and the
business, making it easier for him to engage in tax management activities. Even though
it was not statistically significant, the CEO’s gender, age and tenure all had negative
coefficients, indicating that when a firm has an older male CEO with more experience
in that position its ETR is lower.
The results seem to corroborate the view that when directors earn more firms