2019
UNIVERSIDADE DE LISBOA
FACULDADE DE CIÊNCIAS
DEPARTAMENTO DE BIOLOGIA ANIMAL
Analysis of RAD sequencing data from species of
Mediterranean cicadas
Inês Vieira Oliveira
Mestrado em Bioinformática e Biologia Computacional
Especialização em Biologia Computacional
Dissertação orientada por:
Prof
aDoutora Paula Simões
iii
“You can do irrefutably impossible things with the right amount of planning and support from intelligent and hardworking people and pizza”. Scott M. Gimple
v
Agradecimentos
Este espaço é dedicado a todos os que ao longo deste tempo deram a sua contribuição para que esta dissertação fosse realizada. A todos eles deixo aqui o meu agradecimento sincero.
Os principais “prejudicados” com esta minha dissertação foram, sem dúvida, o Francisco Pina Martins e a Raquel Mendes. A eles particularmente, antes de mais ninguém, devo os meus profundos agradecimentos pelo modo como me aturaram, apoiaram e acompanharam ao longo desta árdua caminhada. Sendo assim, obrigada ao Francisco que se dispôs desde logo do início para me ensinar logo o “1+1=2” da linha de comandos e a ser a minha salvação na instalação de todos os programas que foram necessários e a resolver os problemas que iam aparecendo, mostrando-se sempre disposto sempre que eu, cheia de medo e receosa, mais uma vez o tinha que ir chatear. À Raquel, que para além de uma amiga que se tornou para mim, devo um enorme obrigada porque foi o meu braço direito e um motor para a concretização desta dissertação. Apoiou-me desde logo o início e durante toda a caminhada, dando-me todo o material para começar a estar a par do que se tratava o meu data set e como iniciaria o tratamento com o ipyrad; comentando os meus resultados que iam aparecendo e melhorias a fazer; resolver de erros e problemas que iam surgindo, assim como todas as palavras de encorajamento e de amizade que me deu quando as coisas não corriam bem e que me deram força para continuar e não desistir. Assim, devo a ela, sem dúvida, o concretizar desta dissertação.
Quero agradecer particularmente à minha orientadora, Paula Simões, pelo apoio e total disponibilidade para me receber no seu gabinete, sempre com simpatia e com conselhos fulcrais para o sucesso da realização desta dissertação. Já tinha tido a professora como docente de uma das cadeiras na licenciatura em Biologia, e como desde logo estabeleci ótima ligação com a mesma, ser orientadora desta tese foi sem dúvida uma razão que me a fez escolher. Sem os seus conselhos, as suas palavras amigas de encorajamento e orientação na análise dos resultados cruciais, nada disto teria sido possível.
Ao professor Octávio Paulo, que teve o poder de incutir em mim a paixão pelas Next-Generation Sequencing Technologies (NGS), muito obrigada. A forma brilhante como deu a cadeira Biologia Computacional e Genómica, fez-me querer escolher uma tese em que tivesse que trabalhar com dados gerados com estas tecnologias, porque de facto, foi a melhor escolha que fiz. Sendo assim, muito obrigada não só por me ter tornado apaixonada por este universo das NGS, mas também pelos conselhos e apoio ao longo de toda esta dissertação.
Quero agradecer também à Sara Silva, que me deu força quando, numa etapa final do período do ano letivo, tive que voltar a fazer tudo de novo. E cujo apoio na análise de dados com o Maverick foi crucial demonstrando-se sempre disponível para me ajudar e resolver todos os problemas que surgiram e interpretação dos resultados. A ela devo também um enorme obrigada mesmo estando lotada de trabalho pela sua disponibilidade para comigo que foi crucial pois sem ela também não seria possível concretizar este trabalho.
À Sofia Seabra, ao Gonçalo Costa e ao Eduardo Marabuto e aos restantes membros do grupo Cobig2 um imenso obrigada não só pelas opiniões que me deram para melhoria do tratamento dos meus dados que foram também cruciais durante a caminhada, e dando as suas interpretações do que os meus resultados iam “dizendo”, mas também pela forma calorosa e a simpatia como me acolheram no grupo mostrando-se sempre disponíveis para tudo.
vi
À Vera Nunes pela sua ajuda, numa fase mais inicial deste trabalho, com a contextualização do estado de arte do que já se tinham feito com as cigarras do género Tettigettalna.
Ao professor Vítor Sousa a quem agradeço pelo apoio que me deu já numa fase final de análise dos dados com o teste ABBA/BABA.
Quero agradecer também ao Diogo Silva, que mesmo nunca o tendo visto, teve também a sua contribuição essencial pela autoria de alguns scripts usados. Portanto, a ele devo também um imenso obrigada, porque sem a sua genialidade na “confeção” daqueles maravilhosos scripts, este trabalho também não teria sido possível.
Por último, mas não menos importante, quero agradecer de forma especial à minha família. À minha mãe Odília, ao meu pai José David, à minha irmã Diana e à minha avó Lúcia, que mesmo não percebendo patavina do andei para aqui a fazer e para que serve o meu curso, deram-se sempre total apoio e força para não baixar os braços mesmo quando estava prestes a desistir ou mais desanimada. Sem eles também a concretização desta dissertação não teria sido possível. Obrigada a vocês, de coração.
vii
ix
Resumo
Compreender a divergência e especiação entre espécies próximas sempre foi um tema desafiador no âmbito da biologia evolutiva. Os marcadores de DNA citoplasmáticos, os quais muitas vezes são usados em investigações no contexto de marcadores moleculares, nem sempre deram resultados bem-sucedidos que conseguissem resolver as respetivas filogenias e outras questões.
Nos últimos anos, com o surgimento da Nova Geração de Tecnologias de Sequenciação e técnicas associadas que tiram partido de uma reduzida representação do genoma, é agora possível responder a questões relacionadas com a divergência populações e especiação.
Aqui retratamos o potencial de uma dessas técnicas – Restriction-site Associated DNA (RAD) Sequencing -, para contribuir para a resolução de algumas questões no âmbito da especiação de um grupo particular de insetos, as cigarras mediterrânicas do género Tettigettalna.
A técnica RAD sequencing tira partido da Illumina, uma das Tecnologias da Nova Geração de Sequenciação, para gerar dados genómicos de zonas adjacentes a locais de corte de restrição por enzimas (RAD tags). Isto permite simultaneamente identificar e marcar milhares de SNPs espalhados por todo o genoma, de qualquer tamanho, em centenas de indivíduos e para organismos modelo ou não. Como a RAD-Seq é uma técnica de sequenciação de reduzida representação do genoma, é claro que o seu uso tem muitas mais vantagens em comparação com técnicas de sequenciação de todo o genoma. Isto permitiu que a RAD-Seq se tenha tornado a metodologia genómica mais usada para a descoberta de SNPs em estudos filogenéticos e de evolução de organismos não-modelo como é o caso das espécies de cicadas do género Tettigettalna.
Este género constitui um complexo de espécies de cigarras intimamente relacionadas que divergiram recentemente. Elas são morfologicamente semelhantes o que as torna um desafiante grupo taxonómico. Adicionalmente, o canto de chamamento produzido pelos machos é a principal característica que permite a distinção entre as espécies.
Na Península Ibérica, a diversidade das cigarras foi amplamente subestimada até à recente descrição e revisão taxonómica de nove espécies de cicadas de pequeno porte pertencentes ao género Tettigettalna: Tettigettalna mariae, Tettigettalna argentata, Tettigettalna aneabi, Tettigettalna josei, Tettigettalna defauti, Tettigettalna armandi, Tettigettalna helianthemi, Tettigettalna boulardi e Tettigettalna estrellae.
Algumas das espécies mencionadas são restritas a Espanha, sendo que apenas uma delas, Tettigettalna estrellae, é restrita a Portugal. Tettigettalna argentata é a única que para além da Península Ibérica se estende para mais países Europeus.
Alguns estudos focados nas espécies da zona do Mediterrâneo pertencentes a este género evidenciaram a ocorrência de simpatria entre algumas espécies de Tettigettalna do sudoeste da Península Ibérica. As populações de Tettigettalna argentata têm uma distribuição que faz com que por vezes se sobreponham com outras populações de outras espécies. No Algarve (Portugal), as populações de Tettigettalna mariae e Tettigettalna argentata podem ser encontradas em simpatria ou parapatria. Estas duas espécies são consideradas um complexo de espécies gémeas, sendo morfologicamente muito semelhantes e apenas se distinguindo pelo seu canto de chamamento.
x
Trabalhos baseados na análise de sequências mitocondriais (COI) permitiram a separação de populações de Tettigettalna argentata em clade do norte e clade do Sul. Adicionalmente, este clade do Sul revelou não ser geneticamente distinto dos espécimenes de Tettigettalna mariae, com o qual partilha a maior parte dos haplótipos. Assim, é muitas vezes impossível discriminar os espécimenes de T. mariae dos espécimenes de T. argentata (clade do Sul) com base apenas na análise de sequências COI.
Como referido, as espécies de Tettigettalna podem ser distinguidas através dos sons produzidos pelos machos, pelo que se pensa que estes sinais acústicos possam ter um papel preponderante no isolamento reprodutivo das espécies. Na verdade, estudos baseados em dados de acústica revelam que diferentes espécies têm diferentes padrões acústicos. Porém, outros trabalhos com dados genéticos não esclarecem várias questões. Nomeadamente, se a partilha de haplótipos entre o clade Sul de Tettigettalna argentata e as Tettigettalna mariae será devida a introgressão (existência de fluxo genético entre populações) ou “Incomplete Lineage Sorting”, (segregação imperfeita de alelos em linhagens bem definidas).
Os trabalhos realizados apontam assim para a necessidade de uma metodologia multilocus que possa ser uma melhor abordagem a adotar, por forma a responder às questoes acima mencionadas.
Neste trabalho, utilizámos então uma abordagem multilocus, ou seja, dados de RAD-Seq das cigarras do género Tettigettalna. Com este tipo de dados e utilizando ferramentas de limpeza e filtragem dos dados, como o Ipyrad, VCFtools e outros scripts, foi assim possível gerar resultados que permitiram responder melhor a questões que até agora não tinham sido respondidas à luz de abordagens single locus e/ou com dados de outras naturezas.
Com esta nova abordagem mostrámos que os dados RAD-Seq tornam evidentes os padrões de distribuição geográficos das espécies/populações das cigarras do género Tettigettalna, bem como parecem indicar que a partilha de haplótipos entre Tettigettalna argentata e Tettigettalna mariae de populações simpátricas na região Algarvia, é explicada pelo fenómeno de introgressão.
Palavras-chave: RAD-Sequencing, Tettigettalna, Península Ibérica, introgressão e incomplete lineage
xi
Abstract
Understanding population divergence and speciation among closely related species has long been a challenge in evolutionary biology. Cytoplasmic DNA markers, which have been widely used in the context of molecular barcoding, have not always proved successful in resolving phylogenies and other related questions.
With the advent of Next-Generation Sequencing technologies and associated techniques of reduced genome representation, not only the phylogenies of closely related species are now being resolved at a much greater detail, but are also allpwing a much better understanding on divergence and speciation patterns and processes.
Here we examine the potential of one of such techniques - Restriction-site Associated DNA (RAD) sequencing -, in disentangling questions related to the divergence and speciation of a particular group of insects, the meditteranean cicadas from the Tettigettalna genus. This genus constitutes a complex of closely related and recently diverged species. They are morphologically similar what makes them a taxonomical challenging group. The calling songs are the main character used for their identification.
Work focused on the Mediterranean species of this genus revealed the accurance of sympatric populations among some of the southern Iberian Tettigettalna species. In fact, Tettigettalna mariae and Tettigettalna argentata populations can be found in sympatry or close parapatry. As already referred, these two species are morphologically very similar and only distinguishable by their calling songs. However, mitochondrial COI studies also showed that these species share haplotypes but the results couldn’t reveal if this sharing was due to introgression (existence of gene flow between populations) or incomplete lineage sorting (defective segregation of alleles into well-defined lineages).
The present multilocus approach with RAD-Seq data, not only revealed a better understanding of the geographical patterns of distribution of the Tettigettalna species and populations, but also gave evidence that it is the phenomenom of introgression that explains the sharing of haplotypes between Tettigettalna argentata and Tettigettalna mariae, when in sympatry.
Therefore, the use of the Next-Generation sequencing data, in particular RAD-seq data, in this thesis has reinforced the utility of the methodology applied to solve problems related to recent diverged complexes of species, such our study group of insects in which we were able to give a significant contribution to a better understanding of its divergence and speciation.
Keywords: RAD-Sequencing, Tettigettalna, Iberian Peninsula, introgression and incomplete lineage
xiii
Table of Contents
Agradecimentos ... v
Resumo ... ix
Abstract ... xi
Table of Contents ... xiii
List of Figures ... xv
List of Tables ... xvii
List of Files ... xix
Chapter 1 Introduction ... 1
1.1
Sequencing Technologies: from the early DNA discovery to present day
research tools ... 1
1.1.1 The Sanger Sequencing: the first sequencing method ... 2
1.1.2 Human Genome Project ... 3
1.1.3 Next-Generation Sequencing technologies ... 3
1.2
Platform selection and RAD-Seq applications ... 10
1.2.1 Restriction-site Associated DNA (RAD) sequencing ... 10
1.2.1.1 Methodology of RAD-Seq ... 10
1.2.1.2 Applications of RAD-Seq ... 12
1.2.1.3 A bioinformatics tool for RAD datasets analysis: Ipyrad ... 14
1.3
The cicada group model in evolutionary studies ... 15
1.3.1 The Tettigettalna genus case study ... 18
1.3.2 Tettigettalna mariae and Tettigettalna argentata: the sibling species ... 22
1.4
Objectives of the Thesis ... 23
Chapter 2 Material and Methods ... 25
2.1 The RAD-Seq data treatment ... 26
2.1.1 The sequence treatment with Ipyrad ... 26
2.1.2 The filtering step with VCFtools program ... 30
2.1.3 The filtering step with vcf_parser.py code ... 31
xiv
2.3
Analysis of the RAD-Seq data with MavericK program ... 32
2.4
ABBA/BABA test ... 34
Chapter 3 Results ... 36
3.1
The RAD-Seq data treatment ... 36
3.1.1 The sequence treatment with Ipyrad ... 36
3.1.2 The filtering step with VCFtools program ... 36
3.1.3 The filtering step with vcf_parser.py code ... 38
3.2
The Principal Component Analysis of the RAD-Seq data ... 41
3.3
Analysis of the RAD-Seq data with MavericK program ... 46
3.4
ABBA/BABA test ... 49
Chapter 4 Discussion and Conclusions ... 51
Chapter 5 References ... 55
xv
List of Figures
Figure 1.1 Sanger Sequencing ... 2
Figure 1.2 454 pyrosequencing ... 5
Figure 1.3 Illumina sequencing ... 6
Figure 1.4 RAD marker library generation ... 11
Figure 1.5 Maturation stages of a periodical cicada ... 16
Figure 1.6 Morphology of a cicada tymbal ... 17
Figure 1.7 Iberian Peninsula map with approximated distributions of the genus
Tettigettalna ... 18
Figure 1.8 Tettigettalna josei copulation ... 19
Figure 1.9 Specimen of Tettigettalna mariae ... 20
Figure 1.10 Stone pine wood from Cartaya ... 21
Figure 1.11 Specimen of Tettigettalna argentata ... 22
Figure 2.1 Species locations collected during the surveys 2011-2013 on Iberian Peninsula
... 25
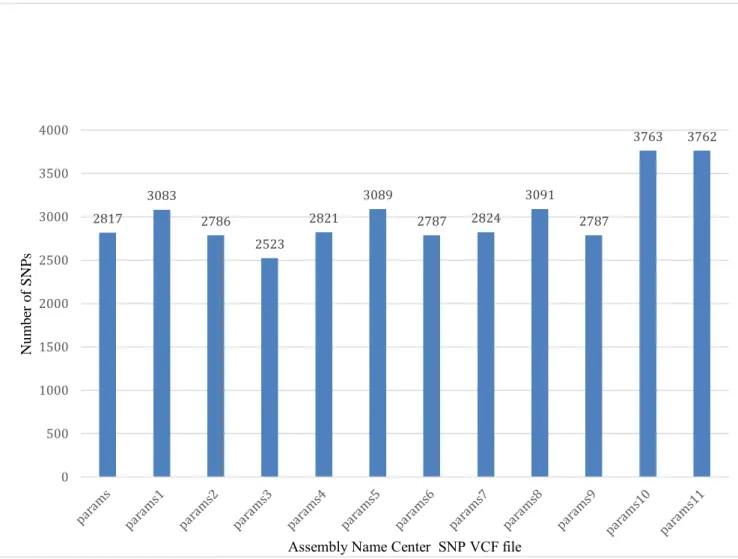
Figure 3.1 Number of SNPs in each Assembly Name Center VCF file ... 39
Figure 3.2 Average Missing Data ... 40
Figure 3.3 PCA results from RAD-Seq data treated after Ipyrad and filtering with
vcf_parser.py code ... 43
Figure 3.4 MavericK clustering plot result for assembly params 8 (including the
Tettigettalna aneabi) ... 46
Figure 3.5 MavericK clustering plot result for assembly params 10 (excluding
Tettigettalna aneabi) ... 47
xvii
List of Tables
Table 3.1 Results obtained in terms of number of SNPs for each assembly VCF file, after
filtering the original VCF file with the VCFtools filtering program in terms of minimum allele
frequency and maximum missing data ... 37
Table 3.2 Results obtained in terms of number of SNPs for each assembly VCF file, after
filtering the recode VCF file with the vcf_parser.py filtering code ... 38
Table 3.3 Results obtained for D-statistic, abba, baba and p-value for the three input GT
files ... 49
Table 3.4 Results obtained for D-statistic, deviation and z-value for the three input GT
files ... 49
Table 6.1: Specimens of Tettigettalna cicadas under study with indication of identification
barcode, species, sample location and data of the sample location... 64
Table 6.2: Clustering threshold and minimum sample locus values for each of the
assemblies performed on ipyrad program. ... 65
xix
List of Files
File 6.1 “barcodes_sem_aneabi.txt” file. ... 66
File 6.2 “barcodes_aneabi.txt” file ... 67
File 6.3 “barcodes_com_josei.txt” file ... 68
File 6.4 “individuos_algarve.txt” file ... 69
File 6.5 “individuos_sem_aneabi_algarve.txt” file ... 70
File 6.6 “params-params.txt” file ... 71
File 6.7 “params-params1.txt” file ... 72
File 6.8 “params-params2.txt” file ... 73
File 6.9 “params-params3.txt" file ... 74
File 6.10 “params-params4.txt” file ... 75
File 6.11 “params-params5.txt” file ... 76
File 6.12 “params-params6.txt” file ... 77
File 6.13 “params-params7.txt” file ... 78
File 6.14 “params-params8.txt” file ... 79
File 6.15 “params-params9.txt” file ... 80
File 6.16 “params-params10.txt” file ... 81
File 6.17 “params-params11.txt” file ... 82
File 6.18 “params-params12.txt” file ... 83
File 6.19 “params-params13.txt” file ... 84
File 6.20 “params-params14.txt” file ... 85
File 6.21 Script written in python named “vcf_parser.py” that was used to filter the
assembly_name.recode.vcf files ... 86
File 6.22 Script written in R named “vcf2PCA.R” used to generate Principal Component
Analysis plots ... 91
File 6.23 Script written in R named “MavericK1.0_functions.R” that came with the
Maverick installation ... 92
File 6.24 MavericK “parameters.txt” file ... 112
File 6.25 MavericK “parameters_final8_final.txt” file ... 113
File 6.26 MavericK “parameters_final10.txt” file ... 114
xx
File 6.28 Script written in R named “Dstat.R” used to calculate the D-statistics ... 116
File 6.29 Output result obtained for params8.recode.vcf when using the R Script
“vcf2PCA.R” ... 117
File 6.30 Output result obtained for params10.recode.vcf when using the R Script
“vcf2PCA.R” ... 118
File 6.31 Output result obtained for params8CenterSNP.vcf when using the R Script
“vcf2PCA.R” ... 119
File 6.32 Output result obtained for params10CenterSNP.vcf when using the R Script
“vcf2PCA.R” ... 120
1
Chapter 1
Introduction
1.1 Sequencing Technologies: from the early DNA discovery to present
day research tools
Determining the sequence of nucleic acids residues in biological samples is an integral component of a large variety of research applications since it gives the information for the hereditary and biochemical properties of terrestrial life. DNA sequencing plays such an important role as it allows measuring one of the major properties at which the life forms can be defined and differentiated from each other (Heather & Chain, 2016).
Over the last half century, a large number of researchers have invested a great deal of time and resources to the development and improvement of the sequencing technologies. Therefore, we have witnessed tremendous challenges over those years, moving from sequencing short sequences (gene scale) to millions of bases (whole genome scale) (Heather & Chain, 2016).
Hence, the evolution of DNA sequencing has a rich story full of several generations of sequencing technology that can be characterized in terms of their nature and the output generated by them (McGinn & Gut, 2013).
The history behind Next-Generation Sequencing (NGS), also known as high-throughput sequencing (HTS) techniques, goes back to the discovery of the double-helix DNA structure in 1953 (Watson & Crick, 1953). Some years later, Robert Holley and colleagues were able to produce the first whole nucleic acid sequence and structure, namely the 77 ribonucleotides of alanine tRNA from Saccharomyces cerevisiae, opening the door for others to determine the sequence of not only other RNAs but also DNA (Holley, Madison, & Zamir, 1964; Holley et al., 1965).
In 1977, Frederick Sanger was the first to sequence a complete DNA genome of bacteriophage X 174 and was the pioneer of the Sanger method, the known first-generation technique of sequencing (Sanger et al., 1977a; Sanger, Nicklen, & Coulson, 1977b). In fact, he was the first to realise the importance of genome sequencing on the biological studies, like he said:
2
“…[A] knowledge of sequences could contribute much to our understanding of living matter.” [Frederick Sanger] (Heather & Chain, 2016)
Next-Generation Sequencing refers to the deep, high-throughput DNA sequencing technologies developed after the Sanger sequencing method first emerged in 1977 (Sanger et al., 1977a).
Also referred as the Sanger DNA chain-termination method or dideoxy method, it has remained the most frequently used DNA sequencing technology for 30 years (McGinn & Gut, 2013).
1.1.1 The Sanger Sequencing: the first sequencing method
The chain-termination method (see Figure
1.1
) is based on the DNA polymerase-dependent synthesis of a complementary DNA strand in the presence of natural deoxynucleotide triphosphates (dNTPs) and dideoxynucleotide triphosphates (ddNTPs) (Sanger et al., 1977a).The ddNTPs are modified nucleotides that lack the 3’- OH group that is required for the establishment of the phosphodiester bonds between nucleotides (Chidgeavadze et al., 1984) during strand elongation. Hence, the lack of it makes them, during the elongation process, being responsible for the DNA synthesis termination, once one is incorporated by the DNA polymerase (Morozova & Marra, 2008).
By performing four parallel reactions, the products are then separated by size using a polyacrylamide gel electrophoresis and the DNA sequence of the template strand is revealed with the use/principle of autoradiography (Heather & Chain, 2016; Morozova & Marra, 2008).
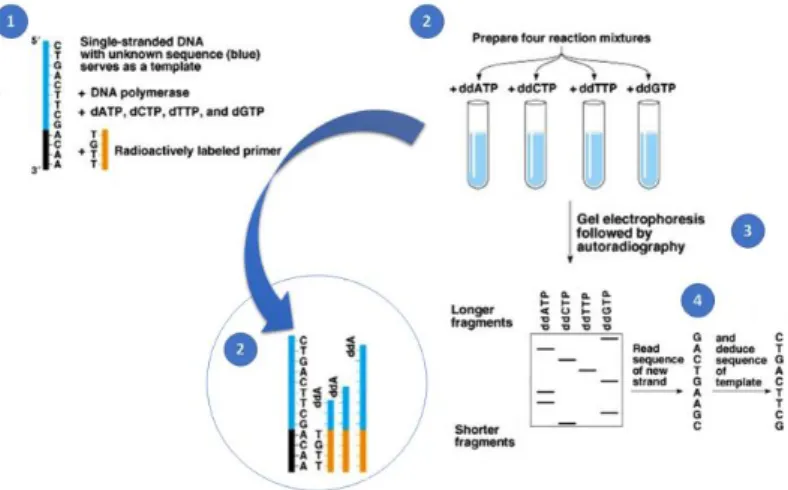
Figure 1.1 Sanger Sequencing
(1) Single-stranded DNA with an unknown sequence (blue) serves as a template. (2) Four reaction mixtures are prepared, one for each nucleotide, in the presence of a DNA polymerase, a radioactively labelled primer, dNTPs (“normal” nucleotides) and ddNTPs (modified nucleotides), which allows the DNA synthesis in vitro of the complementary strand. (3) After the DNA synthesis, a gel electrophoresis is performed followed by autoradiography. (4) The new strand sequence is read from the gel electrophoresis, and the sequence of the template is deduced from the previous one. Adapted from https://www.onlinebiologynotes.com/sangers-method-gene-sequencing/ in March 2019.
A number of improvements throughout the years were made to the classical Sanger sequencing technique. The most relevant improvements made to the classical Sanger sequencing method were incrementing the read length of the sequences, lower error rates of sequencing (Heather & Chain, 2016;
3
Morozova & Marra, 2008) and improving detection with the use of capillary gel electrophoresis and the use of fluorescent dyes of different colours (Smith et al., 1986). Hence, those improvements made the accuracy, the simplicity and robustness of the classical Sanger’s method made it the pioneer technology for DNA sequencing (Heather & Chain, 2016).
1.1.2 Human Genome Project
The Sanger sequencing method was used to complete Human Genome Sequencing initiatives led by the International Human Genome Sequencing Consortium and Celera Genomics (Consortium, 2004; Venter et al., 2001).
The Human Genome Project (HGP) was initiated in 1990 and required 13 years until the sequence was published. (Consortium, 2001). This project was the proof that sequencing an entire genome is achievable but at in high cost level and with limitations in the throughput (McGinn & Gut, 2013). Sanger’s method limitations and the associated Human Genome Project have aroused the need of better sequencing technologies not only for sequencing human genomes but also other genomes (Barba, Czosnek, & Hadidi, 2013). Following the publication in 2004 of the human genome sequence (Consortium, 2004), the National Human Genome Research Institute have invested 70 million in a DNA sequencing initiative with the goal of having a human genome sequence in 10 years possible at a most reducible cost (Reuter, Spacek, & Snyder, 2015). This triggered in 2005 the rise of the beginning of the revolutionary Next-Generation Sequencing technologies (McGinn & Gut, 2013).
1.1.3 Next-Generation Sequencing technologies
The Next-Generation Sequencing technologies refer to all the technologies that followed the first-generation of sequencing – the Sanger Sequencing technique.
Hence, both 2nd generation of sequencing and 3rd generation of sequencing technologies refers to
technologies that belong to the next-generation technologies. In the 2nd generation of sequencing, the
main technologies are 454 pyrosequencing technology, Illumina sequencing technology, SOLiD sequencing technology, Ion Torrent sequencing technology and Single Molecule Real Time (SMRT) sequencing technology. For the 3rd generation of sequencing, the most notable technology of this
generation is the Oxford Nanopore sequencing technology.
Here, it will be described not only an overall review of the chemistry of the sequencing method for each technology, the improvements that were made to the methods, but also their advantages/disadvantages. The aim of these sequencing methods of the Next-Generation of Sequencing technologies was producing big volume of data (large amounts of DNA reads) and deliver fast and accurate genome information at a low cost (Barba et al., 2013; McGinn & Gut, 2013) which would have a dramatic impact on genomic research. Each technology associated with the platforms available determines the quality, quantity and
4
biases of the output generated which is essential to be able to know which platform to use depending with the type of output data pretended (Reuter et al., 2015). Since, the platform applications will be later discussed, after understanding, first of all, the sequencing principles of each technology.
2nd Generation Sequencing
There are several High-Throughput Sequencing platforms available in the market that used second generation sequencing methods (McGinn & Gut, 2013). This generation methods’ workflow are similar: library preparation, amplification and several rounds of enormously parallel sequencing (Reuter et al., 2015).
However, the main characteristics of this generation of sequencing is the use of many clonal templates in parallel and the use of enzymatic replication system to determine the sequence (McGinn & Gut, 2013).
Roche/454 pyrosequencing technology
The previous presented Sanger sequencing method had the limitation of requiring in vivo amplification of the DNA fragments to be sequenced, which were performed in bacterial hosts. However, this cloning process is labour intensive, lengthy and have error biases associated (Hall, 2007).
In the 454-pyrosequencing technology, the first of the next-generation sequencing technologies released at the market, there is no need of cloning amplification in a host like on Sanger’s sequencing (Tawfik & Griffiths, 1998). Furthermore, the nucleotide inference is in real-time and there is no use of modified dNTPs (Nyrén, 1987; Ronaghi et al., 1996; Ronaghi, Uhlén, & Nyrén, 1998).
Despite the differences, both Sanger and pyrosequencing methods are sequence-by-synthesis techniques because both of them require action of DNA polymerase (Heather & Chain, 2016). Furthermore, pyrosequencing provides intermediate read lengths and price per base compared to Sanger sequencing in one hand, and Illumina and SOLid platforms on the other hand (Barba et al., 2013).
In pyrosequencing sequencing (see
Figure
1.2
) technologies, after the library preparation, the DNA amplification is done in vitro in a method called Emulsion PCR (EmPCR) (Tawfik & Griffiths, 1998). In EmPCR, a huge number of copies of a unique template DNA per bead is obtained (Morozova & Marra, 2008). The clonal templates are then sequenced using the pyrosequencing method, at which dNTPs are added one at time. Whenever a nucleotide is incorporated, the release of pyrophosphate (PPi) occurs and it’s detectable by light produced by a chemiluminescent enzyme present in the reaction. The sequence of the DNA template is then taken (Morozova & Marra, 2008).5 Figure 1.2 454 pyrosequencing
(1) Preparation of Adapter ligated single-stranded DNA Library (A-[insert]-B). (2) In vitro Emulsion PCR (EmPCR) in beads in water-in-oil microreactors that allows DNA amplification. Each bead contains clonal sequences of a unique template. (3) Beads with clonally amplified template DNAs are deposited in a picotiter plate with sequencing enzymes. (4) The pyrosequencing starts with the sequential addition of dNTPs. The release of PPi detectable by light, once a dNTP is incorporated, allows the determination of the template sequence. Adapted from (Leong, Skinner, & Love, 2014; Margulies et al., 2005; Metzker, 2009; Voelkerding, Dames, & Durtschi, 2009).
The first high-throughput sequencing device to be available in the market was from 454 Corporation, was in 2005-2006. It was called the GS 20 and was capable of producing 20 Mbp. The 454 Corporation was later bought by Roche and the technology evolved in 2007 to the Roche GS FLX, which offered greater number of reads because of the increment of the number of wells in the picotiter plate as well as better quality data. In 2008 the upgraded 454 GS-FLX+ Titanium was available which was capable of producing over 600 Mbp of sequence data in a single run (Barba et al., 2013).
The Roche technology have then demonstrated that mass parallelisation of reactions to sequence data is possible in only one run (Margulies et al., 2005).
Illumina/Sequencing by synthesis with reversible terminators technology
Following the success of 454 pyrosequencing, a several number of parallel sequencing techniques sprung up (Voelkerding et al., 2009). The most important among them was the Solexa method of sequencing that released the Genome Analyzer in 2005, and which was later, in 2007, acquired by Illumina (Barba et al., 2013).
In Illumina sequencing method (see Figure
1.3
), instead of parallelising by performing bead-based emulsion PCR, adapter linked DNA molecules are passed over a lawn of complementary oligonucleotides bound to a flow cell. Following a solid phase PCR, it produces neighbouring clusters of clonal populations from each of the individual original flow cell binding DNA strands (Bentley et al., 2008; Fedurco et al., 2006), a process called bridge amplification. This name is due to the replicating DNA strands have to arch over to prime the next round of polymerisation of neighbouring surface-bound oligonucleotides (Voelkerding et al., 2009).The sequencing is achieved using a sequencing-by-synthesis (SBS) approach using fluorescent reversible-terminator dNTPs, which can not immediately bind further nucleotides as the fluorophore occupies the 3’ hydroxyl position; this must be cleaved away before polymerisation can continue, which
6
allows the sequencing to occur in a synchronous way (Turcatti et al., 2008). The modified dNTPs and the DNA polymerase are washed over the primed, single stranded flow-cell bound clusters in cycles. At each cycle, the identity of the incorporating nucleotide can be monitored with a charge-coupled device (CCD) camera by exciting the fluorophores with appropriate lasers, before enzymatic removal of the blocking fluorescent moieties and continuation to the next position (Heather & Chain, 2016).
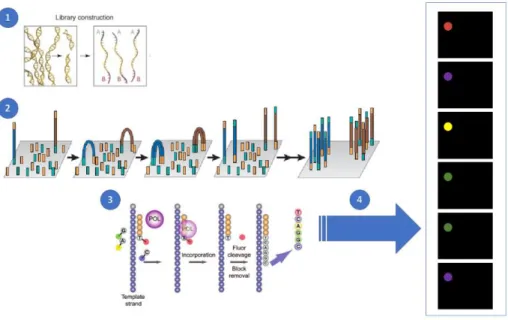
Figure 1.3 Illumina sequencing
(1) DNA fragmentation and in vitro adaptor ligation. (2) Solid-phase bridge amplification. (3) Sequencing obtained with the use of fluorescent reversible-terminators nucleotides (labelled nucleotides), primers and DNA polymerase. (4) After laser excitation, an image per cycle is obtained by a CCD camera allowing the identification of the base incorporated by the emitted fluorescence. The sequence cycles are repeated to determine the sequence of the templates, one base at time. Adapted from (Leong et al., 2014; Margulies et al., 2005; Voelkerding et al., 2009).
The first Genome Analyzer machines were initially only capable of producing very short reads (up to 35 bp long) but they had an advantage in that they could produce paired-end data, in which the sequence at both ends of each DNA cluster is recorded. Having paired-end data, it provides a greater amount of information, which improves the accuracy when mapping reads to reference genomes, especially across repetitive sequences and aids detection of spliced exons and rearranged DNA or fused genes (Heather & Chain, 2016).
The standard Genome Analyzer was latter followed by the HiSeq, a machine capable of even greater read length and depth, and then the MiSeq, which was a lower-throughput but lower cost machine with faster turnaround and longer read lengths (Balasubramanian, 2011; Quail et al., 2012). HiSeq 2500 series platform has a particular capacity that allow sequencing a human genome in 24 hours, the namely “Genome in a day” (Barba et al., 2013).
Across all Illumina models the overall error rates are bellow 1% and the most common type of error is substitution (Dohm et al., 2008), however they currently dominated the High-Throughput Sequencing market (Reuter et al., 2015).
7
ABI/SOLiD sequencing by ligation technology
The SOLiD technology was released by Applied Biosystems, which became Life Technologies following a merger with Invitrogen (McKernan et al., 2009) .
In 2007, the first SOLiD sequencing system was released, followed by the SOLiD 5500w and 5500 xlw sequencing systems in 2010. The last has read lengths of 85 bps with 99,99% of accuracy and a data output of 30 Gb per run. Applications of SOLid include analysis of whole genome clusters with runs being finished in a week (Barba et al., 2013). The results of sequencing in terms of quantities and length are comparable to Illumina sequencing described before (Barba et al., 2013).
In the Sequencing by Oligonucleotide Ligation and detection (SOLiD) system, as it name suggests the sequencing process does not occurs by synthesis (with a polymerase) but by ligation, using a DNA ligase (Shendure et al., 2005).
Libraries preparation begin with an emulsion PCR, the amplification step similar to that one used in the 454 technology. The PCR products are then sequenced in sequential rounds of hybridization and ligation of 16 dinucleotide combinations labelled by four fluorescent dyes (each dye is used to label 4 dinucleotides) on a glass surface. Using the four-dye encoding scheme, each position is probed twice and the identification of the nucleotide is determined by analysing the colour that results from two successive ligation reactions (Morozova & Marra, 2008).
Due to this two-base encoding system, an inherent accuracy check is built into the technology which allows 99,99% of accuracy. The chemistry of the system also means that it is not hindered by homopolymers unlike the Roche 454 FLX system, then large and difficult homopolymer repeats are no longer a problem to sequence. The technology is then used to sequence DNA but the particular feature of high parallelisation nature makes it also applicable in transcriptomics and epigenomics (Morozova & Marra, 2008).
Life Technologies/Ion Torrent sequencing technology
Ion Torrent is the first so-called “post-light” sequencing method as it uses neither fluoresce nor luminescence, which speeds sequencing and reduces costs (Rothberg et al., 2011).
The template preparation and sequencing are similar to the 454-pyrosequencing method (Mellmann et al., 2011). An emulsion PCR is used to clonally amplify adaptor-ligated DNA fragments on beads. The beads are distributed on wells where sequencing-by-synthesis occurs. The difference is that, instead of base incorporation with production of light, the Ion torrent sequencing measures pH changes induced by the release of H+ during DNA extension. Those pH changes, with the sequential addition of individual
nucleotides during each sequencing cycle, are detected by a sensor and converted into a voltage signal. Since it is proportional to the number of bases incorporated it allows fast base discrimination (Reuter et al., 2015; Rothberg et al., 2011).
In 2010, Life Technologies released the Ion Torrent sequencing technology in the form of a benchtop Ion Personal Genome Machine (PGM) sequencer. A second machine was released in 2012, the Ion Proton with its increments of the output generated (10 Gb) over the PGM (1 Gb). However, Ion Proton
8
sequencer features a maximum of 200 bp read lengths as opposed to 400 bp for the PGM (Reuter et al., 2015).
In what refers to their applications, Proton is more useful for exome sequencing and whole-transcriptome analysis, and PGM for targeted resequencing projects and small genome analysis (Reuter et al., 2015). The speed of sequencing, two to eight hours depending of the machine and chip used, make these sequencers particularly useful for clinical applications (Mellmann et al., 2011). Error rates, instead, emerge by the presence of homopolymer repeats longer than six bp (Rothberg et al., 2011), insertions and deletions (Liu et al., 2012) on the data to be sequenced.
PacBio/SMRT sequencing technology
The Single Molecule Real Time (SMRT) sequencing technology commercialized by Pacific Biosciences is sometimes referred as a 3rd generation technology because it allows sequencing single
molecules in real-time with no need of previous amplification (Reuter et al., 2015), however it satisfies the 2nd generation characteristic of using an enzymatic replication system to sequence the data (Schadt,
Turner, & Kasarskis, 2010). Because of this duality, it was stablished that this sequencing technology is an intermediate state of the 2nd and 3rd generations, because in fact, it goes beyond the 2nd generation
characteristics (McGinn & Gut, 2013).
In PacBio technology, the SMRT sequencing is a parallelized sequencing method that utilizes SMRT cells with a lot of zero-mode waveguides. Each zero mode waveguides (ZMW) have a single DNA polymerase that is affixed at its bottom with a single molecule of DNA as the template (Levene et al., 2003). Throughout this complex, light can penetrate and create a visualization chamber that allows monitoring the activity in real-time of the polymerase enzyme at a single molecule level (Eid et al., 2008). Each of the four bases are labelled with fluorescent dyes and added simultaneously, and whenever a nucleotide is incorporated into the growing strand, the fluorescent tag is cleaved off providing detectable fluorescence signals by a sensor which results in DNA sequencing in real-time. The speed of sequencing is much faster compared to the technologies where individual nucleotides are flushed sequentially (Kulski, 2016; McGinn & Gut, 2013).
The commercially available device from Pacific Biosciences, the PacBio RS II, was released in 2010, which evolved through the years with improvements in the number of zero mode waveguides with a performance of an average of more than 14 kb of read lengths but it can be until 60 kb, generating then 1 Gb of data in 4 hours (McGinn & Gut, 2013). There are errors also associated with the method and the fact of avoiding the amplification step turns it is less sensitive to GC content, comparing to other platforms (Loomis et al., 2013).
However, SMRT sequencing characteristics makes it particularly useful for producing kinetic data and applied in projects involving de novo assemblies (English et al., 2012).
9
3rd Generation Sequencing
The third-generation sequencing technologies have emerged in a continuously effort to reduce the price of sequencing and became preparatory procedures and sequencing methods even more simpler (Metzker, 2009; Schadt et al., 2010).
There is a discussion about what is the “line” that separates second-generation sequencing methods and the third-generation sequencing methods. However, there are arguments that allowed a division between them, namely the fact that the third-generation is characterized by the possibility of sequencing single molecules (single molecule sequencing – SMS), sequencing in real-time and the most remarkable characteristic, the absence of a replication enzymatic system which means there is no requirement for DNA amplification in those methods (Gut, 2013; Niedringhaus et al., 2011; Schadt et al., 2010).
Oxford Nanopore Technology and its sequencing method
Nanopore sequencing method is a typical example of a third-generation sequencing method that was led by the Oxford Nanopore Technologies, the first company that released in the market the first commercially nanopore based platforms like GridION and MinION. The last one is an USB portable sequencer device that was available at the market in 2014 (Clarke et al., 2009; Eisenstein, 2012; Loman & Quinlan, 2014).
The principle of nanopore sequencing is simple and essentially consists of a synthetic or biological bilayer membrane immersed in salt solution and perforated by biologic nanopores (Bayley, 2006; Reuter et al., 2015).
The library preparation of the biomolecules to be sequenced is reduced only with DNA fragmentation and with ligation by enzyme proteins of adapters being then unwinded and guided to the nanopore with the help of a protein on the top of the nanopore. This library preparation doesn’t require PCR amplification, and it’s designed to allow sequencing of both strands of the DNA which improves accuracy (Ashton et al., 2014; Quick, Quinlan, & Loman, 2014; Reuter et al., 2015).
An application of an electrical current to this system drives ions through the nanopore, and the arrival of a biomolecule such as DNA base create resistance in the flow of the ions which causes changes in the electrical current that can be measured. The distinct four DNA bases when passing through the nanopore promote different changes in the electrical current and, because of that, DNA sequencing is accomplished. (Bayley, 2006)
Although this method has error rates quite high (Jain et al., 2015), it makes possible, comparing to the previous next-sequencing methods, sequencing at faster rates and at low costs of long DNA reads bigger than two kilobases (kb), even RNAs and allows also parallelization (Branton et al., 2008; Derrington et al., 2010).
The MinIon device which technology of sequencing is the nanopore sequencing (deals with long reads length) was, in one of its first applications, used in combination with the short-read sequencing methods (high read depth and accuracy) to generate position and structure of a bacterial genome sequence. This
10
proved that combination of sequencing methods is plausible and very effective to get the best characteristics of both methods used (Loman, Quick, & Simpson, 2015; Quick et al., 2014).
1.2 Platform selection and RAD-Seq applications
There are important factors to be considered before choosing an adequate sequencing platform. The choice depends on the size or expected size of the genome being studied, its complexity like GC content and the depth of coverage and accuracy needed (Barba et al., 2013).
For de novo genome sequencing which is our case of the data to be treated and analysed, longer read length may be appropriate; for fast turnover times and limited throughput, smaller laboratory bench top platforms may offer greater flexibility (Loman et al., 2012); for amplicon sequencing, Roche 454 platform is suitable because of its longer reads, however its currently expensive. Recently, platforms like Illumina MiSeq and Ion PGM platforms are suitable for sequencing amplicons; for RNA-Sequencing and projects that require high depths of coverage, Illumina and SOLiD platforms offer the best cost, accuracy and throughput (Radford et al., 2012).
Summarizing, the Roche 454 has the longest read length, Illumina HiSeq 2500 features the biggest output and lowest sequencing cost and SOLiD 5500 xlw the highest accuracy (Liu et al., 2012). Biologists have always dreamed of a day when perfect genetic knowledge would be available for almost any organism (Etter et al., 2011a).
The current Next-Generation Sequencing (NGS) technologies are fulfilling that promise and revolutionizing the fields of evolutionary biology (Rokas & Abbot, 2009) and biomedical sciences (Asmann, Wallace, & Thompson, 2008; Marguerat, Wilhelm, & Bähler, 2008; Mortazavi et al., 2008), opening the possibility for genetic analysis at scales not previously possible. Furthermore, researches related to population genomics (Hohenlohe et al., 2010), quantitative trait mapping (Baird et al., 2008), comparative genomics and phylogeography (Emerson et al., 2010; Gompert et al., 2010) that were unthinkable even a few years ago, are now possible. Perhaps the most critical aspect of these breakthroughs is the unshackling of genetic analysis from traditional model organisms, allowing genomic studies to be performed in organisms for which few genomic resources presently exist (Mardis, 2008; Van Tassell et al., 2008).
1.2.1 Restriction-site Associated DNA (RAD) sequencing
We present here one sequencing technique approach, the Restriction-site Associated DNA (RAD) sequencing, a focused reduced-representation methodology that makes use of the Next-Generation Sequencing technologies and that speed up this revolution in evolutionary biology.
1.2.1.1 Methodology of RAD-Seq
RAD sequencing uses Illumina next-generation sequencing method to generate sequence data adjacent to restriction cut sites (RAD tags), which allows simultaneously discovering and scoring of tens to
11
hundreds of thousands of single-nucleotide polymorphism (SNP) markers (RAD markers) spread throughout the genome (of any size) in hundreds of individuals and for any model or non-model organism of choice (Baird et al., 2008; Davey et al., 2011; Luikart et al., 2008).
In the original RAD-seq method (Baird et al., 2008), genomic DNA is digested with one restriction enzyme and numerous modifications can be made to the protocol (similar methods) to suit a diversity of evolutionary genetic questions, like inferring marker loci and genotypes de novo from RAD tags sequences for an organism with no sequenced genome, distinguish SNPs from error and inferring heterozygoty in the face of sampling variance (Etter et al., 2011a; Marguerat et al., 2008).
Although the choice of the appropriate method is
important because it can severally influence all steps of a genomic study (Andrews et al., 2016), in general, all the RAD-Seq techniques share basic steps. All of them need a high-molecular-weight genomic DNA, which is digested with one or more restriction enzymes depending of the method chosen. As seen on Figure 1.4, an adaptor (P1) is ligated to the fragment’s overhanging ends. This adapter contains forward amplification and Illumina sequencing primer sites, as well as a nucleotide barcode 4 or 5 base pair (bp) long for sample identification (Baird et al., 2008). These barcodes are used to identify individual samples that are sequenced together (multiplexed) in a single library (Andrews et al., 2016), and differ by at least two nucleotides in order to reduce erroneous sample assignment (Baird et al., 2008). As soon as barcoded adaptors are ligated to each sample, the samples can be multiplexed, which can greatly reduce the expense and time of the subsequent steps in studies with large numbers of samples (Andrews et al., 2016). The adapter-ligated fragments are then pooled, randomly sheared and size-selected. A second adapter (P2) with divergent ends is then ligated. The reverse amplification primer is unable to P2 unless the complementary sequence is filled in during the first round of forward elongation originated from the P1 amplification primer. The structure of this adapter ensures that only P1 adapter-ligated RAD tags are amplified during the final PCR amplification step (Baird et al., 2008). In the original RAD-Seq protocol each RAD tag has one end defined by the restriction enzyme
recognition site and the other end defined by random shearing.
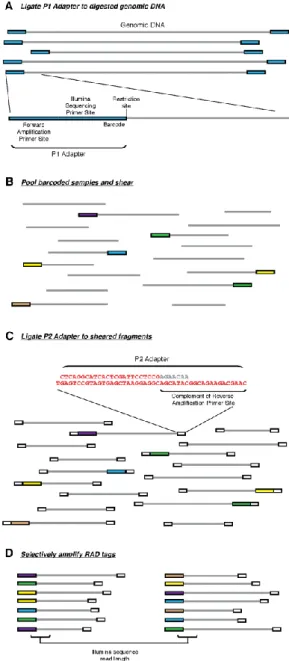
Figure 1.4 RAD marker library generation
(A) Genomic DNA was digested with a restriction enzyme and the P1 adapter was ligated to the fragments. The P1 adapter contains a forward amplification primer site, an Illumina sequencing primer site, and a barcode (coloured boxes represent P1 adapters with different barcodes). (B) Adapter-ligated fragments were combined (if multiplexing), sheared and (C) ligated to a second adapter (P2, white boxes). The P2 adapter is a divergent “Y” adapter, containing the reverse complement of the reverse amplification primer site preventing amplification of genomic fragments lacking a P1 adapter. (D) RAD tags, which have a P1 adapter, will be selectively and robustly enriched. Reproduced from (Baird et al., 2008).
12
Thereafter, Etter et al., (2011b) adapted the original protocol to used paired-end reads, in which the two ends of a DNA fragment are sequenced and are known to belong to the same fragment. In order to do so, the authors altered two keys aspects of the RAD-seq protocol: 1) a wider size range of fragments (300-800 bp) was isolated after shearing; 2) a longer, divergent P2 adapter that contains the reverse sequencing primer sequence was ligated to the variable end of the RAD tags before amplification, allowing the randomly sheared end of the RAD fragments to be sequenced by the second read. This small set of sheared-end sequences can be assembled into a larger contig, hence the quality of the entire data set improves with a paired-end approach (Etter et al., 2011b).
As RAD-seq is a reduced-representation sequencing approach, it targets a subset of the genome and, because of that, it is clear that it provides advantages over whole-genome sequencing. The advantages are including a greater depth of cover per locus, which improves confidence in genotype calls; and sequencing of greater numbers of samples for a given budget.
Consequently, because of these advantages RAD-seq has become the most widely used genomic approach for high-throughput SNP discovery and genotyping in evolutionary and phylogenetic studies of non-model organisms (Andrews et al., 2016).
Despite the applicability and ease of use of RAD and other NGS protocols, a significant continuously challenge facing biologists is developing the appropriate analytical and bioinformatics tools for these type of data (Etter et al., 2011a).
1.2.1.2 Applications of RAD-Seq
There are various examples of studies in different groups of organisms like birds, plants, molluscs and insects where the RAD-seq genomic approach was conducted. They aimed to resolve, not always in a straightforward way, some evolutionary questions and phylogenetic relationships, some of them the same of ours.
For example, in birds Ng et al., (2017) were worried about understanding the impact of trade on the population genomic patterns of connectivity and differentiation under the study organism, a threatened songbird – the white-rumped shama Copsychus malabaricus. Previous studies done based on a single locus approach (a mitochondrial gene) of the songbird (Lim et al., 2010, 2011), have obtained results that were not conclusive and a lot of questions still unresolved. For that purpose, a reduced-representation library of the bird genome with a reference genome was prepared using a double digest restriction-site associated DNA sequencing (ddRAD-seq) protocol (multilocus approach). This successful methodology fully solved the questions that were previously not answered yet.
In plants, Deng et al. (2018) have used the de novo RAD-sequencing genomic approach to resolve the phylogenetic relationships’ questions that remained under East Asian evergreen oaks under the genus, section Cyclobalanopsis. This genus is phylogenetically challenging due to high intraspecific genetic variation, low interspecific differentiation and frequent interspecific gene flow (Denk & Grimm, 2010; Hipp, 2015; Kremer et al., 2012; Simeone et al., 2013). The reason why this genomic approach was chosen to resolve the genus was because previous studies of application of RAD-sequencing, have demonstrated that this genomic approach robustly estimated phylogenetic relationships among older oak
13
clades (Hipp et al., 2014), contrarily to the use of plastid DNA (Manos, Cannon, & Oh, 2008; Pham et al., 2017; Simeone et al., 2013; Xing et al., 2014) and ribosomal nuclear markers (Deng, Zhou, & Li, 2013) where the resolution of the phylogenetic relationships among the genus was not fully resolved. The RAD-seq approach results obtained have successfully corroborated previous results by supporting the separation the Eurasian and American clades and also provided a valuable framework and the best-resolved topology to date for understanding the phylogeny of the East Asian evergreen oaks in Eurasian clade.
Besides, Curto et al., (2018) performed a study interested in obtaining a more comprehensive picture of the evolutionary history of a plant genus Micromeria. The species from this genus are morphologically similar but ecologically diverse on each Canary Island, constituting a great model to investigate niche shifts and adaptation within the Canary Archipelago. Previous attempts to reconstruct the phylogenetic relationships among the genus did not led to robust phylogenies, presumably due to introgression and/or incomplete lineage sorting (Curto, Puppo, Kratschmer, & Meimberg, 2017; Puppo, Curto, & Meimberg, 2016). Because no genomic information is available for Micromeria to date, the most common reduced-representation sequencing technique, the RAD-sequencing method (Baird et al., 2008; Cronn et al., 2012; Elshire et al., 2011) was used. The results obtained corroborated the current reclassification of Micromeria and suggested that introgression have played a role in the evolution of the genus as suggested previously (Curto et al., 2017; Puppo et al., 2016). However, they recommended, for a more detailed understanding the history of the genus, more studies to be performed, since there was a lack of outgroups which led to misinterpretations.
In molluscs, Razkin et al., (2016) applied the de novo RAD-Seq approach to assess the phylogenetic relationships, interspecific hybridization and species delimitation in the cryptic, non-model land snail complex of the genus Pyramidula. Previous phylogenies based on mitochondrial COI and 16S and nuclear markers showed several unsupported branches and incongruent topologies (Razkin et al., 2016). This latter observation was tentatively interpreted as the result of incomplete lineage sorting. Hence, further work was needed involving more molecular markers to assess whether, and to what extent, processes like interspecific gene flow or incomplete lineage sorting have shaped the phylogenetic relationships among Pyramidula species. The RAD-Seq results obtained helped to fully resolved the phylogenetic relationships between species. In fact, the tests for intraspecific hybridization have successfully revealed that, the incongruences between the mtDNA and nDNA gene trees regarding two of the genus’ species, were due to incomplete lineage sorting, which have been also documented in other molluscs (Wilding, Grahame, & Mill, 2000). Furthermore, as the two species didn’t live in sympatry, the hypothesis of the incongruences being caused by gene flow were less plausible (Ballard & Whitlock, 2004).
In what refers to insects, Suchan et al., (2017) were interested in disentangling the phylogeny of the fly genus Chiastocheta at which there is no reference genome. Previous studies relying on a single, non-recombinant marker and ignoring potential incongruences between mitochondrial and nuclear loci provided an incomplete account of the lineage history of the genus (Després et al., 2002; Espíndola, Buerki, & Alvarez, 2012). Suchan et al., (2017) has proven that despite the higher performance of RAD-seq in terms of species trees resolution compared to cytoplasmic markers, reconstruction of inter-specific relationships among recent diverged lineages may lie beyond the possibilities offered by large data sets of RAD-sequencing markers in cases of strong gene tree incongruence due to incomplete lineage sorting.
14
1.2.1.3 A bioinformatics tool for RAD datasets analysis: Ipyrad
RAD-sequencing technique generates thousands of reads per individual, hence the process of analysing the data requires high computational tools and takes much more time than the time needed to generate the RAD sequence reads (Andrews et al., 2016).
There are several programs designed to analyse RAD-seq data like Stacks (Catchen et al., 2011) and Rainbow (Chong, Ruan, & Wu, 2012), however, most of the studies based on assembly of de novo RAD-seq loci (without reference genome) like (Curto et al., 2018; Deng et al., 2018; Razkin et al., 2016; Suchan et al., 2017) for phylogenetic analysis and population genetics used the pyRAD or ipyrad program tools.
Ipyrad (Eaton, 2015) is a toolkit specially used for assembly and analysis of genomic RAD-Seq data sets. It offers powerful methods to generate output files (assembled data) for forward downstream genomic analysis for both population genetics and phylogenetic studies.
Any type of data generated with restriction digest methods like RAD (Baird et al., 2008), double-digest RAD (Peterson, Weber, Kay, Fisher, & Hoekstra, 2012) and Genotyping-By-Sequencing; or amplification-based processes like Next-RAD and RAPture can be so assembled with this tool in four modes of assembly. Both approaches yield data that is anchored on at least one side, so that, reads are expected to align fairly close. However, it’s important to have in mind that ipyrad is not intended for constructing long contigs from partially overlapping sequences but can accommodate paired-end reads and has particular methods for detecting and merging overlaps. For last, it can combine reads of various lengths what makes possible the combination of older data with newer data with different lengths. This tool is very similar to pyRAD (D. Eaton, 2014), being a complete re-write of it but with a different approach. Besides ipyrad retains an easy-to-use command-line interface, the notorious power of ipyrad comes from its implementation through a Python API, which allows users to write scripts that detail complex assemblies able to construct multiple data sets under multiple parameters settings (D. Eaton, 2015).
Other improvements include:
• de novo, reference alignments and hybrid modes of assembly (four assembly methods); • Parallel implementation using ipyparallel which utilizes MPI allowing use of HPC clusters; • Possibility of restarting a script from the point of a job at which an interruption occurred; • Faster code and no external installations;
• Writhe highly reproducible documented code with Jupyter Notebooks.
The typical workflow to move from Fastq formatted input data (dataset) to assembled output files, in ipyrad pipeline involves seven sequential steps (assembly steps) under a single set of parameters defined in a .txt params file (D. Eaton, 2015).
❖ The RAD sequence data as our dataset, can be received as one giant file or in many smaller files. The files may contain data from all of our individuals mixed up together, or as separate files for each sample. When mixed up together, the case that the data is not sorted among
15
individuals/samples (raw sequence files), then our data need to be first of all demultiplexed based on barcodes or indices. The .txt barcodes file, is then very important in the demultiplexing step (D. Eaton, 2014). This file is a simple table linking barcodes to samples. Each line of this file should have one name of the sample and then the respective barcode sequence, separated by a whitespace. The barcodes can be of varying lengths.
❖ The parameters input file needs to be created on ipyrad and its name includes the prefix “params-assembly_name.txt”. It lists all of the 29 parameters settings (assembly parameters) that could be and should be modified to create assemblies under different combinations of parameter settings, on the basis of the recommendations (D. Eaton, 2015). It is crucial to vary the parameters used in all steps of the analysis to critically evaluate the sensitivity of the results and to optimize the analysis (Andrews et al., 2016), since several publications (Ilut, Nydam, & Hare, 2014; Mastretta‐Yanes et al., 2015) emphasized the fact that the analytical results can be considerably affected by the parameters settings used in de novo assemblies.
The Seven Sequential Steps
The assembly process is separated in steps which is very advantageous, because it allows the process to be restarted at any point if interrupted and can be easily branched at different points to create assemblies under the different combinations of the parameter settings in the params file (D. Eaton, 2014, 2015).
The seven steps are:
1. Demultiplexing (separate by barcodes);
2. Quality filtering and removal of barcodes, cut sites and adapters; 3. Clustering within samples and alignment;
4. Joint estimation of heterozygosity and error rate; 5. Consensus base calling and filtering;
6. Clustering across samples and alignment; 7. Filtering and formatting output files.
1.3 The cicada group model in evolutionary studies
Cicadas are a group of insects, belonging to the family Cicadidae, super-family Cicadoidea and the order Hemiptera, with more than 2500 species described around the world (Sun et al., 2009). Cicadas have long larval stages underground which can be seen on Figure 1.5, which is the case of the periodical cicadas, Magicicada spp. that have up to 13 or 17 years synchronized nymph cycles (Cooley et al., 2001b; Yoshimura, 1997). In the case of the European cicadas, they mostly have a life cycle of two to six years. The advantage of having long larval stages underground is that it reduces losses by starving their predators and allows their emergence in huge numbers that overwhelms any predators (Williams & Simon, 1995).
16 Figure 1.5 Maturation stages of a periodical cicada
Transformation of the periodical cicada from the mature nymph to the adult. Figure 118. from “Insects, their way and means of living”, R. E. Snodgrass (1930).
They are well-known for the male ability to produce loud sounds during summer time by means of a tymbal mechanism (Claridge, 1985; Quartau & Boulard, 1995). The tymbal is the sound-specialized organ responsible for the production of a variety of calls. As presented on Figure 1.6, the cicada tymbal consists on an abdominal membrane attached to the tymbalic muscles which, with each round of contraction and relaxation, are able to vibrate on frequencies between 35 and 100 Hz producing sounds with frequencies up to 25 kHz, past the human audible frequency (Wessel et al., 2014).
17 Figure 1.6 Morphology of a cicada tymbal
(A) Ventral view of a male cicada showing the fan-shaped opercula covering the tympana, which the cicada uses to hear. (B) Dorsal view of a male cicada showing the tymbals (drums) between the thorax and abdomen. (C) Abdominal cross-section of the male cicada showing the tymbalic muscles connected to the tymbals and anchored to the sternal cuticle. (D) Tymbal membrane, a convex layer of the cuticle, and often possessing several thin and resilin-coated portions intercalated by thickened ribs, as shown. Adapted from Carpenter (1911).
Different types of sounds can be produced, and each has a different function (Boulard & Mondon 1996):
▪ Calling song: the most common call of male cicadas, is used to call the females for pair formation and courtship;
▪ Courtship call: is emitted when the singing male is approached by an interested female; ▪ Alarm call: produced when a cicada senses something unusual in its environment; ▪ Protest calls: can be subdivided in:
Opposition calls: when multiple males of same species are present in the same area or tree;
Distress calls: when a male cicada is caught.
The calling songs are specific (Boulard, 2006; Cooley & Marshall, 2001a). Being a species-specific character, it can be used to distinguish different species even between closely-related ones. This makes it a taxonomical valuable character (Boulard, 1982, 2006; Claridge, 1985; Sueur, 2006) for cicadas’ species discrimination.
The Iberian Peninsula have been identified as an area of high diversity and endemism (García‐Barros et al., 2002; Jong, 1998), not only for plants (García‐Barros et al., 2002; Medail & Quezel, 1997; Moreno Saiz et al., 1998; Mota et al., 2002), amphibians and fishes (Vargas et al., 1998) but also for a lot of insects including the cicadas (Jong, 1998; Ribera, 2000). Among the Mediterranean countries, Portugal