COMPANY VALUATION IN A PRIVATIZATION
SCENARIO
– CTT - Correios de Portugal, S.A. –
Vanessa Filipa Geraldes Brasil
Project Report
Master in Finance
Supervisor:
Prof. Pedro Manuel de Sousa Leite Inácio, ISCTE Business School, Finance Department
I
Agradecimentos
Gostaria de aproveitar este espaço para agradecer a todos aqueles que me ajudaram na elaboração desta dissertação de mestrado.
Assim, começo por agradecer ao Prof. Pedro Inácio pela disponibilidade mostrada, e pelas sugestões e conselhos úteis que me deu.
Por fim, agradecimentos muito especiais à minha família, namorado e amigos pelo constante apoio dado desde sempre.
II
Sumário
No actual contexto do elevado endividamento do Estado Português e consequente pedido de ajuda financeira externa, encontra-se actualmente em curso o processo de privatização de diversas participações do Estado em empresas nacionais. Entre estas salienta-se os CTT - Correios de Portugal, S.A., player número 1 a actuar no sector postal nacional, detida a 100% pelo Estado Português e a qual poderá vir a ser privatizada num futuro próximo.
Assim, e de forma a que a empresa possa ser vendida pelo seu justo valor, torna-se indispensável efectuar uma avaliação económico-financeira desta, o que, ao longo das próximas páginas, será realizado de acordo com três dos mais famosos métodos de avaliação empresarial, nomeadamente a técnica dos Múltiplos e o método dos Fluxos de Caixa Descontados, quer pela óptica dos Fluxos de Caixa Livres para a Empresa, quer pela óptica dos Fluxos de Caixa Livres para os Accionistas.
Palavras – Chave: Privatização; Avaliação Empresarial; Múltiplos; Fluxos de Caixa Descontados
III
Abstract
Considering the current high levels of Portuguese Public Debt and the external financial help to Portugal, the privatization process of state-owned companies might soon begin. Within these businesses, we can think about CTT - Correios de Portugal, S.A., number 1 player in the national postal sector and 100% owned by the Portuguese State.
This way, in order to sell the business at its fair value, it is crucial to perform a financial valuation, which, in the next pages, is going to be completed according to three of the most famous corporate valuation techniques, namely the Multiples and the Discounted Cash Flow method, using both the Free Cash Flow for the Firm and the Free Cash Flow for the Equity approaches’.
IV
Sumário Executivo
Detida integralmente pelo Estado Português, a empresa CTT – Correios de Portugal, S.A. encabeça o maior grupo empresarial a actuar no sector postal nacional, sendo de salientar que, a breve prazo, poderá vir a ser alvo de um processo de privatização à semelhança do já sucedido com outras empresas congéneres noutros países Europeus, nomeadamente na Alemanha, Holanda, Bélgica, Dinamarca e Áustria. Tal facto justifica-se, essencialmente, pelo elevado endividamento do Estado Português e consequente necessidade de financiamento. Assim, e de acordo com o memorando de entendimento assinado em Maio de 2011 entre a Troika (formada pelo Fundo Monetário Internacional, Comissão Europeia e Banco Central Europeu) e o Estado Português no âmbito do programa de ajuda financeira externa a Portugal, foi deliberado o início do processo de privatização de diversas Empresas Públicas, bem como a alienação de participações minoritárias em Empresas Privadas.
Desta forma, e tendo em consideração que o Grupo CTT é actualmente detido em 100% pelo Estado Português, este poderá brevemente vir a ser objecto de um processo de privatização, sendo ainda de referir que, para além desta indefinição, a Empresa atravessa ainda alguns dos mais complexos desafios desde a sua constituição, cujas origens remontam ao início do séc. XVI. Entre estes, destaca-se a liberalização total do sector postal ocorrida a 1 de Janeiro de 2011 (não só em Portugal, mas na generalidade dos países da União Europeia), o que poderá conduzir a uma erosão do seu market share, numa altura em que o correio tradicional, o core business do Grupo, está a ser progressivamente substituído por novos meios de comunicação, nomeadamente o e-mail, a internet e os SMS.
Assim, no quadro traçado, considerou-se fazer todo o sentido que o presente trabalho tivesse por objecto a avaliação económico-financeira do Grupo CTT, em que se procurará determinar uma estimativa daquele que poderia vir a ser considerado um justo valor de privatização. Para o efeito, de entre os vários métodos existentes, utilizar-se-ão três dos mais usados na vida real das empresas, ou seja, a técnica dos Múltiplos e o método dos Fluxos de Caixa Descontados, quer pela óptica dos Fluxos de Caixa Livres para a Empresa, quer pela óptica dos Fluxos de Caixa Livres para os Accionistas.
O primeiro baseia-se no valor de empresas comparáveis cotadas em Bolsa, sendo que o segundo e terceiro métodos têm como base e consideram a performance
económico-V
financeira passada para a estimação da capacidade de geração de cash flows futuros, os quais serão, posteriormente, descontados à taxa do custo de capital apropriada (WACC aquando do uso de FCFF e taxa de retorno requirada pelos accionistas aquando da utilização de FCFE).
Tal como à frente se explicará, não existe um método absolutamente correcto para produzir um valor exacto para uma Empresa, pelo que os métodos usados forneceram estimativas ligeiramente diferentes para o valor dos CTT, mais concretamente 525, 654 e 666 Milhões de Euros, de acordo com o discounted FCFF, Multiplos e discounted FCFE, respectivamente, concluindo-se que o justo valor do Grupo deverá situar-se entre os montantes mencionados.
VI
Index of Tables
Table 1 – Trailing PER of CTT’s comparable companies
Table 2 – CTT’s market value of Equity (Multiples valuation approach)
Table 3 – Past values of FCFF necessary inputs (net fixed assets, Ebit x (1-t) and NWCN)
Table 4 – CTT’s historical revenues
Table 5 – CTT’s estimated revenues
Table 6 – Historical ratios of net fixed assets, Ebit x (1-t) and NWCN as % sales
Table 7 – Estimated Net Fixed Assets, Ebit x (1-t) and NWCN
Table 8 – Estimated Free Cash Flow for the Firm
Table 9 – Results of a research performed to Corporations, Financial Advisers and Textbooks/trade books regarding the cost of equity
Table 10 – CTT’s estimated levered beta
Table 11 – CTT’s estimated cost of equity
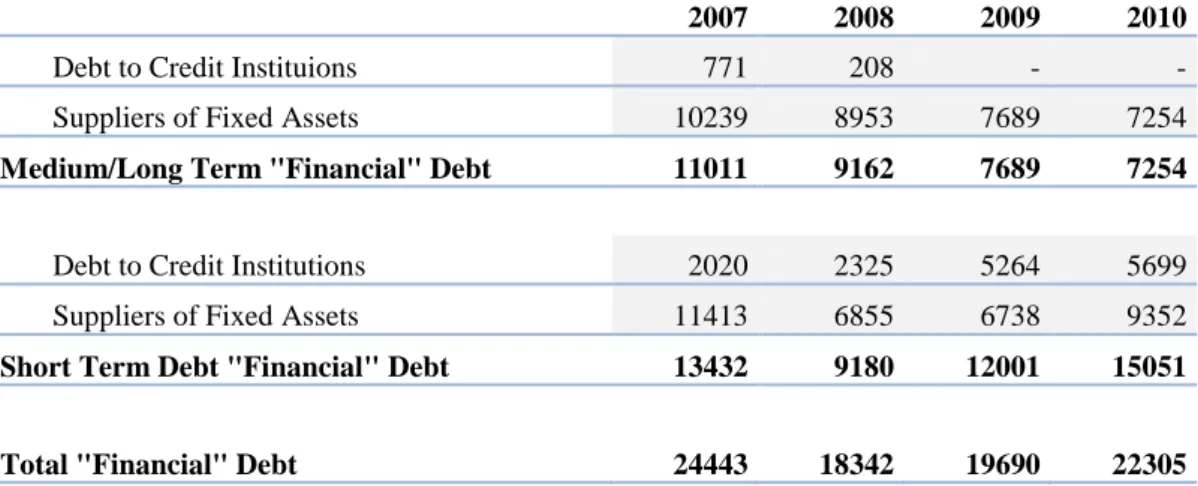
Table 12 – CTT’s historical “financial debt”
Table 13 – CTT’s historical interest expense
Table 14 – CTT’s historical cost of debt
Table 15 – CTT’s estimated Weighted Average Cost of Capital
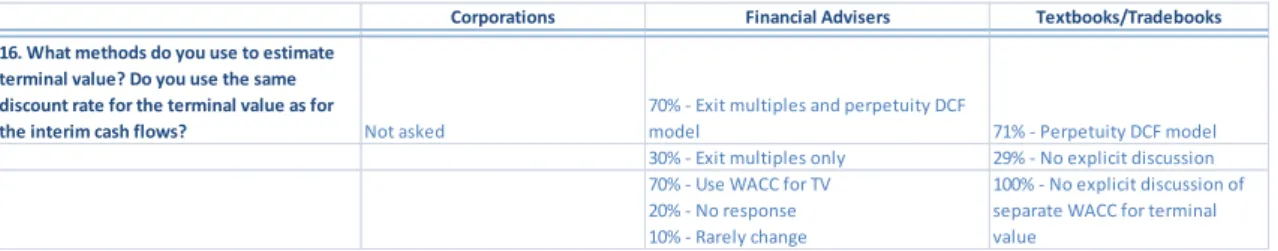
Table 16 – Results of a research performed to Corporations, Financial Advisers and Textbooks/trade books regarding the terminal value of a company
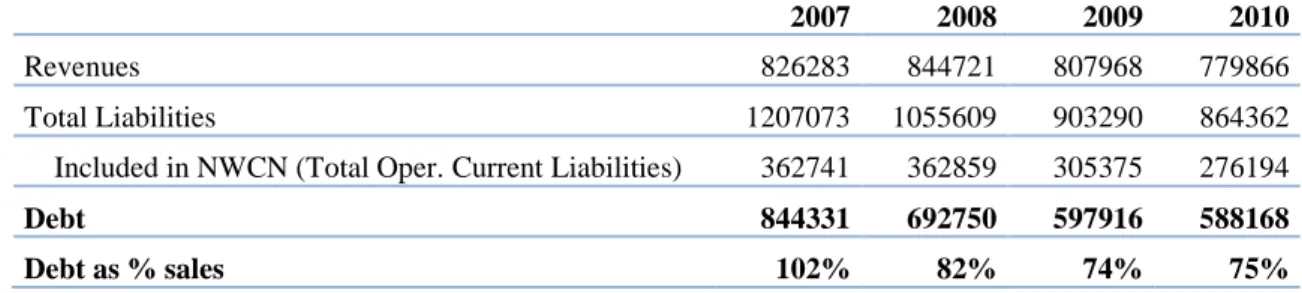
Table 17 – Historical ratio of Debt as % of sales
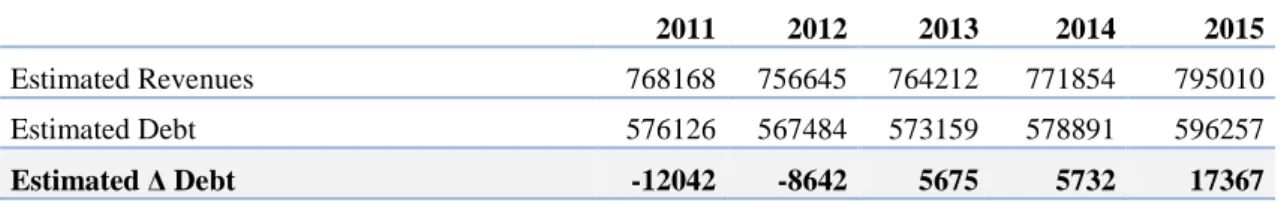
Table 18 – Estimated Δ Debt
Table 19 – CTT’s estimated after tax interest expense
Table 20 – Estimated Free Cash Flow for the Equity
Table 21 – Market Value of CTT’s Equity according to the valuation methods used
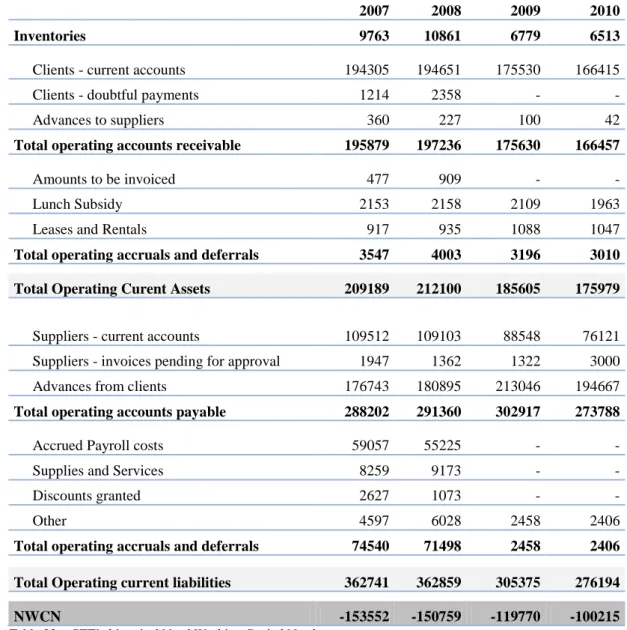
Table 22 – CTT’s historical Need Working Capital Needs
VII
List of Acronyms
AMEX – American Stock Exchange
APT – Arbitrage Pricing Theory
CAPM – Capital Asset Pricing model
CEO – Chief Executive Officer
CF – Cash Flow
CGD – Caixa Geral de Depósitos
DCF – Discounting cash flow
EBIT – Earnings before interest and taxes
EC – European Commission
EU – European Union
FCF – Free Cash Flow
FCFE – Free Cash Flow for the Equity
FCFF – Free Cash Flow for the Firm
GDP – Gross Domestic Product
IPO – Initial public offering
MM – Modigliani and Miller
NASDAQ – National Association of Security Dealers Quotations
NWC – Net Working Capital
NWCN – Net Working Capital Needs
NYSE – New York Stock Exchange
PER – Price/Earnings ratio
PV – Present Value
SMS – Short Message Service
TV – Terminal Value
USA – United States of America
VIII
Index
Agradecimentos ...I Sumário ...II Abstract ...III Sumário Executivo ……...IV Index of Tables ...VI List of Acronyms ...VII Index ...VIII1. General Context about CTT, SA ...1
1.1 Description of the Group ...1
1.2 History ...2
1.3 Future of CTT ...3
2. Objective of the master thesis ...6
3. Revision of existing literature ...7
3.1 Introduction to corporate Valuation ...7
3.2 Multiples Valuation Method ...12
3.3 Discounted Cash Flow Valuation Method ...13
4. Company Valuation – CTT, Correios de Portugal, SA ...17
4.1 Multiples valuation method ...17
4.2 Discounted Cash Flow valuation method ...18
4.2.1 FCFF approach ...18
4.2.1.1 Calculation of FCFF ...18
4.2.1.2 Estimation of the Discounting Rate ...22
4.2.1.2.1 Contextual introduction to WACC...22
4.2.1.2.2 Cost of equity ...23
4.2.1.2.3 Cost of Debt ...30
4.2.1.2.4 Cost of Capital ...32
4.2.1.3 Calculation of CTT’s fair value ………..33
4.2.2 FCFE approach ...34
4.2.2.1 Calculation of FCFE ...34
4.2.2.2 Calculation of CTT’s fair value ………..36
5. Conclusions ...37
6. Bibliography ...38
- 1 -
1. General Context about CTT, SA
1.1 Description of the Group
CTT – Correios de Portugal, S.A. is the holding company of a powerful and multiservice group, 100% owned by the Portuguese State. The most important functions it provides to its clients are related with the establishment, management and exploration of all infra-structures concerning Public Postal services. Moreover, it also intends to provide services related to the Information Society, networks and electronic communication services. Therefore, the mission of the company is to establish physic and electronic connections between citizens, State, companies and organizations in general. Present in all national territory, arriving even at the most remote places, the company has a high weight in national job creation, as well as national economic wealth.
As described below, the CTT group is composed of several companies1:
CTT Expresso – specialized in urgent delivery of all kinds of mail and goods, around all the world;
EAD - Gestão Documental – focused on the custodian and management of archives. The usual operational procedures of the company are as follows:
o Preserves the clients’ archives in its installations in Palmela and allows them to consult it every time they wish so, and finally, upon request, the company destroys the archives. This service is also available for digital support archives;
o Transforms data from a physical support into a digital one;
Grupo MAILTEC – specialized in the mass production of documents both in digital and physical formats, such as electronic invoices or postal paper;
Payshop – a service that allows its clients paying their bills (like telephone, water or gas bills), charging their mobile phones, paying online shopping or even making donatives. Everything in an easy way, using a network composed of more than 3.800 agents (like supermarkets or kiosks) and 1.000 post offices;
1
- 2 -
PostContact – specialized in the distribution of advertising mail, such as brochures in houses’ mail boxes or leaflets in hand at a pre-specified place and time;
Tourline Express – with headquarters in Spain, it is focused on the distribution of urgent mail.
1.2 History
The history of CTT goes back very further into the past. In fact, we can date the foundation of the first Portuguese State Postal Service into the year of 1520, by the hands of King D. Manuel I. At that time, Vasco da Gama had already reached Calecule (May of 1498) and Pedro Álvares Cabral had already arrived into Terras de Vera Cruz, that later would be named Brazil (April of 1500). However, even though Portugal was enjoying the apogee of the discoveries, mail was still being distributed by foot, carriage or horse.
Of course, a lot of restructuration occurred from that first institution until the company that exists today. The first one took place in 1880, when “Direcção-Geral dos Correios” and Geral dos Telégrafos” merged together forming “Direcção-Geral dos Correios, Telégrafos e Faróis”. Then, in 1911, the institution gained administrative and financial autonomy becoming “Administração-Geral dos Correios, Telégrafos e Telefones" and adopting the acronym CTT. After that, in 1969, CTT was transformed into a state-owned company, denominated “CTT – Correios e Telecomunicações de Portugal, EP”. Finally, in 1992, the company was transformed into corporation, denominated “CTT – Correios de Portugal, SA”, as it is currently known.
Throughout this long history, CTT has revolutionized the way communications were made in Portugal. For example, 1821 was the year in which the distribution of mail in Lisbon houses began, while the year of 1957 marked the beginning of telex communications between Lisbon – Hamburg and Lisbon – New York. Moreover, in 1978, CTT created the Portuguese Postal code list and in 1998 it was the Official brand of the event EXPO, which took place in Lisbon.
- 3 -
1.3 Future of CTT
Initially, in almost every country around the world, postal services were state-owned monopolies. The main advantage is that governments could keep guard on what kind of mail was circulating around people, which was especially important in countries with oppressive political regimes and where censure played an important role. That was exactly the situation that Portugal lived from 1928 until 1974.
More recently, as communication around countries increased, people have begun to question if the existence of a monopoly in postal services, implying small and geographically-bound post offices, really made sense and it was in this context that the European Commission created several directives regulating the liberalization of the postal market in all Member States. At 20 February, 2008, with the approval of the third European Postal Directive (Directive 2008/6/EC), the full liberalization of the postal market (for countries belonging to the European Union) was set to occur, at the latest, at 31 December, 2010. However, it is important to refer that it contemplates the possibility to postpone the liberalization for two years, which is until 31 December, 2012, in some countries: Cyprus, Czech Republic, Greece, Hungary, Latvia, Lithuania, Luxembourg, Malta, Poland, Romania and Slovakia. This allows countries with difficult topography, that adhered to the EU more recently and that are delayed in the liberalization process, to have more time to adapt to this new concept.
In Portugal, this full liberalization started very recently, i.e. at 1 January, 2011. Even though some services that once belonged to the monopoly of CTT, like the correspondence of letters with more than 50 g, books or express mail, had already been liberalized at 1 January, 2006 (according “Decreto-Lei” nr. 116/2003 from 12 of June), the full liberalization of the postal market occurred only at 1 January, 2011, which is likely to represent a major challenge for CTT from now on.
Currently, CTT is the nr.1 player in the Portuguese Postal service market, at a great distance from the competition. However, the opening of the market might soon generate an erosion in the market share of the company, at a time that physic mail, the core business of CTT, is being progressively replaced by new ways of communication, like e-mail, internet or SMS. The liberalization of the postal sector is thus seen as a way to open up the market to free competition, developing the quality of the service and, at the
- 4 -
same time, decreasing the prices and improving the service to the clients. This was the end of the state-owned monopoly of postal service in Portugal.
A different concept, but that tends to come together with that of liberalization, is the idea of privatization, which is traditionally associated to the divesture of state assets. Indeed, after the huge nationalization programs that took place in Western Europe after World War II, a massive change in the way states regulate economy took place in 1980s in Great Britain, when Margaret Thatcher, at that time the British Prime Minister, decided to privatize the largest state-owned British companies.
Since that time, a lot of debate has been going on regarding which kind of ownership, either state or private, brings more benefits for the companies and for the society as a whole. For some, privatization is a way to combat the poor economic performance of state-owned enterprises, since private ownership gives better incentives to invest and to reduce costs. For others, this increase in efficiency is not worthy since it might imply a reduction in the quality of the service provided and it comes at the cost of other socially valuable goals.
According to Gérard Roland (2008: 3), privatization is many times initiated as a method to fight high levels of public debt and low economic growth rates, as “Findings suggest that concerns for fiscal imbalances and deterioration of economic performance might have played an important role in triggering privatization programs”.
At the moment, and in order to contextualize the company under analysis in this concept of privatization, it is important to mention that the short-term future of CTT is kind of unknown, as the Portuguese State, who currently owns the group, is thinking about privatizing the company. That news appeared recently, at 8 March, 2010, when Teixeira dos Santos, the Portuguese Minister of Finance at that time, said in a telephonic interview to the financial agency “Bloomberg” that the government expects to come with a significant number of privatizations (and to get revenues of about 6 thousand million Euros on those), in order to control the rising Portuguese Public Debt. Therefore, companies that the Portuguese State owns 100% like CTT – Correios de Portugal, SA or RTP – Rádio e Televisão de Portugal, SA, but also the minority positions on enterprises like EDP – Energias de Portugal, SA (25,05% owned by Parpública plus 0,64% owned by Caixa Geral de Depósitos2), REN – Rede Eléctrica
- 5 -
Nacional, SA (51,1% through Capitalpor, Parpública and Caixa Geral de Depósitos3) or GALP (7% owned by Parpública plus 1% owned by Caixa Geral de Depósitos4) are likely to be sold soon5.
More recently, with the increase of bankruptcy risk and the arrival of external help to Portugal (by International Monetary Fund, European Commission and European Central Bank), the privatization of CTT seems even closer. According to the Memorandum Of Understanding between those 3 parties and the Portuguese Government, to gain access to €78bn bail-out, Portugal will have to, within an extensive list of other measures, reduce the weight of the State in the economy, by rushing the privatization process of state-owned companies.
This concept of privatization, even though being much advertised today, is not a new idea for CTT. In fact, this suggestion has been defended for a long time ago. For example, one CTT ex-CEO, Carlos Horta e Costa, has defended the idea, saying, at October, 2003, that CTT has made everything so that the Government could privatize the company when it wishes so. On the other side, and comparing with what happened in Europe, we conclude that the Portuguese Government is not the first one thinking about privatizing the Postal Services. Indeed, another 5 countries have already done the same: Germany, Holland, Belgium, Denmark and Austria. However, it is important to refer that the German Government is the only one that does not hold the majority of the outstanding shares.
For example, in Germany, the ex-state owned postal company Deutsche Bundespost was privatized in 1995 and is currently named Deutsche Post. Moreover, it seems that the privatization of the company was successful. Indeed, the threat of competition has led the company to improve its productivity and to provide its customers a better service. Furthermore, Deutsche Post has significantly expanded its business area through acquisitions. For instance, the company bought several postal businesses worldwide; founded eVita, a web-based virtual shopping mart; and acquired the USA's largest airfreight carrier (DHL). Regarding the company shareholders’ structure6, 30.5% of the shares are held by the state-owned KfW bank and the remaining 69.5% are free floating.
3
Participation on REN as of 20 July, 2011;
4 Participation on Galp as of 30 July, 2011;
5 Note that Capitalpor, Parpública and CGD are 100% owned by the Portuguese State; 6 As of May, 2011.
- 6 -
2. Objective of the master thesis
It is precisely in this context of uncertainty regarding the future of CTT that this master thesis is developed. In fact, if the company is about to be privatized soon, it is crucial to analyze what its fair value is, so that the enterprise is sold by the government by what it is really worth.
From now on, the objective of this thesis is to determine the fair value of the company using 2 different methods. First of all, it is going to be used the Multiples (or Relative) Valuation approach, which values a company by looking at the market prices of similar firms. Then, the analysis is complemented by using a totally different approach, called Discounted Cash Flow Valuation, that is, as referred further on, the most common approach to find the fair value of a business, and for many experts the most correct one. Nevertheless, it is important to refer that valuing a company, like valuing anything else, is a very individual process that depends on subjective factors like the characteristics of the appraiser (Is he more conservative or less about the future evolution of the company?); the purpose of the valuation (for example, the liquidation value of a company is likely to be lower than the value of the same enterprise on a going concern basis); the economic, social and political context in which the valuation is done; as well as on the valuation method used. Therefore, as presented later on, for the specific case of CTT, the value obtained using different valuation techniques is going to be slightly different, so that the fair value should be somehow in between them.
In the next section, and considering the goal of this master thesis, a brief literature review on what corporate valuation is and why it is used is presented, as well as on the methodologies that are going to be used throughout the valuation of CTT: the multiples valuation technique and the discounted cash flow approach.
- 7 -
3. Revision of existing literature
3.1 Introduction to Corporate Valuation
The study of corporate valuation has always attracted the interest of many academics and it is pretty easy to understand why. In fact, when we talk about companies, the area of corporate valuation plays the decisive role of defining the fair value of an enterprise. For Damodaran (2006: 1) “A postulate of sound investing is that an investor does not pay more for an asset than it is worth”, which remains true for the case of a company’s transaction. This is why it is so important to try to get an appropriate value for a company: to ensure that the investor does not spend more than its value. And this fair value is, ultimately, the initial price that will be the basis for negotiation between buyers and sellers of companies; which happens so frequently on processes of mergers, acquisitions, privatizations and other IPO’s of enterprises.
Perez and Famá (2003) tried to explain this difference between price and value of a company. According to them, the value of a corporation is a reflection of its utility to the appraiser, and since utility and preferences for human beings are not clearly measurable, then, there is a degree of subjectivity in the determination of the company’s fair value. On the other hand, they define price as being the unique, exact and precise amount of money that is involved in the financial transaction of the company. It comes only at the end of the negotiations and results from the wishes of buyers and the expectations of sellers. This way, sellers will take the fair value of the company as a starting “price” in the negotiation, but then other factors, like emotional and speculative ones, will also be embedded in the final price.
It is important to refer that corporate valuation plays other roles apart from valuing mergers, acquisitions and privatizations. According to Fernandez (2007: 2), corporate valuation is also important because “the process of valuing the company and its business units helps identify sources of economic value creation and destruction within the company”. Knowing this, managers can develop strategies, like expanding the units that are creating more value and extinct those that destroy it, aimed at maximizing the value of the company for its shareholders. Furthermore, for Fernandez (2007), managers can be evaluated and monetarily compensated according to the value creation of their strategies. The author adds that for the case of listed corporations, company valuation is useful for management portfolio purposes: knowing that an investor should hold in his
- 8 -
portfolio shares that are undervalued, then company valuation can be used to compare the fair value of a company with its current share price on the market, and then decide whether to sell, buy or hold shares of that enterprise. Finally, for the case of Public offerings, “The valuation is used to justify the price at which the shares are offered to the public” [Fernandez (2007: 3)].
Other authors dedicated their work to the study of corporate valuation, but with an emphasis on the effect of certain policies on the value of the company. Here, it is important to refer that Merton H. Miller and Franco Modigliani (1961) examined the impact of dividend policy on shares’ prices. First of all, they conclude that under the assumptions of perfect markets, rational behaviour and perfect certainty, dividend policy is irrelevant, that is, it will affect neither the current share price, nor the total return for the shareholders or the company’s cost of capital, independently of the valuation method used (discounted cash flow technique; current earnings plus future investment opportunities approach; stream of dividends method or finally, stream of earnings technique). Moreover, they prove with a symbolic example that, even under presence of uncertainty (regarding the future amount of profits and investments), dividend policy is still irrelevant.
Now that it was already understood what corporate valuation is and why it is relevant, it is important to refer that there are different models to access the value of a company. Regarding this topic, Damodaran (2006: 9) refers that:
“Analysts use a wide spectrum of models, ranging from the simple to the sophisticated.
These models often make very different assumptions about the fundamentals that determine value, but they do share some common characteristics and can be classified in broader terms.”
Fernandez (2007) classifies the various valuation techniques into six broad categories: Balance sheet-based methods – intend to value a company by looking at the balance sheet’s assets’ value. Since the balance sheet only gives a static viewpoint, it works like a “photo” of the company, and then these methods do not take into account the possible future evolution of the enterprise. Moreover, they do not look at the industry future situation, or at organizational problems of the company; that is, they look at nothing except what is on the balance sheet. This way, the company is being valued by how it performed on the past, not by what it is expected to be able to do in the future.
- 9 -
Income statement-based methods – the process is to value a company based on its income statement, that is, by looking at the amount of current earnings, sales or other indicators. For illustration purposes, a common approach is to calculate equity value by looking at the net present value of dividends, which is the regular cash flow that accrues to shareholders. Using the perpetuity formula, i.e. if the dividend paid by the company is expected to grow indefinitely at a constant annual growth rate g, the value of equity is calculated as follows:
7 (1)
Goodwill-based methods – Goodwill represents the surplus of the company’s value above its book value, that is, it corresponds to the value of the intangible assets, such as the quality of the customer portfolio or the strategic alliances, which are not represented on the balance sheet, but that, undoubtedly, represent a value for the company. There are different methods to calculate the goodwill, but basically, they work using a mixed approach. First of all, they perform a static valuation of the company’s assets and secondly, they add the value related with predicted future earnings. For example, according the “classic” valuation method, goodwill is calculated as n times the value of the company’s net income (for the case of industrial companies) or as a percentage of the company’s turnover (for the case of retail trade companies).
Discounted Cash Flow-based methods – these techniques are going to be used throughout the valuation of CTT, therefore they will be explained in more detail in a further sub-section.
Value Creation-based methods – intend to determine a firm’s value creation for its shareholders using measures such as Economic Value Added, Economic profit, Market Value added, Cash Value added, Cash Flow Return on Investment and Total Shareholders Return.
7 A complete explanation regarding what the cost of equity is and how it can be computed will be
- 10 -
Options – The usage of option pricing models has recently been adapted to value assets, businesses and equity stakes in enterprises, which are valued using the same methodologies applied in the valuation of financial options, such as the binomial or the Black and Scholes model. This way, Real Options’ analysis is very useful to value projects/businesses when the company is living in an uncertainty context, since these models capture some sort of flexibility within the operations of the company, while the previous ones do not.
Just to give an example, note that this model is very practical to value projects when, at a certain point in time, it is possible to either expand the size of the operations (which is advisable under an up economic scenario) or keep the size at its original scale (which usually happens if the economy is facing a down scenario). That is, at the decision year and for each economic scenario, the manager chooses between the maximum of two alternatives: either the project remains at its original scale, or the project is expanded by paying an expansion investment fee. In mathematical terms:
)
(2)
Where, is the expansion factor and is the expansion investment fee.
Using real options’ analysis it is possible to value this flexibility, which is going to increase the Net Present Value of the project (that is obtained by discounting, at the risk free rate, the Expected Values of the project under risk neutral probabilities). According to Osvaldo Lauer (2006: 86) “by ignoring any existing real options, the discounting free cash flow will underestimate projects and imply a wrong decision”. Regarding this topic, Damodaran (2006: 18) adds that:
“The understatement occurs because DCF models value assets based upon a set of
expected cash flows and do not fully consider the possibility that firms can learn from real time developments and respond to that learning”.
One of the first authors defending the usage of real options’ analysis in corporate valuation was Stewart Myers (1976: 32). He picked the proposition of Modigliani and Miller in which they say that the market value of the firm is made of two components:
- 11 -
the present value of the assets in place and the present value of growth opportunities, and restated the sentence at the light of options theory:
“At any point in time the firm is a collection of tangible and intangible assets. Assume the tangible assets are accumulated units of productive capacity -- i.e. real assets -- all drawn from the same risk class. The intangible assets are options to purchase additional units in future periods. The sum of these values is clearly what MM mean by the present value of growth.”
Since Myers considers options a part of the company, it makes sense to use real options’ analysis in company valuation.
Even though these 6 methods are the ones considered by Fernandez, there is at least one more valuation technique, which is the Relative or Multiples valuation approach. As already explained, this is one of the techniques that is going to be used throughout the valuation of CTT, therefore it will be better explained in a further subsection.
According to Fernanda Holanda, Lúcia Albuquerque, José Carvalho and Paulo Cavalcante (2007) the company appraiser should be able to pick, within the several company valuation methodologies available, the one that better suits the characteristics of the enterprise under valuation. However, different methods might be used at the same time and the result can be more successful than using only one technique. Moreover, they conclude that a method that can be considered the correct, unquestionable and exact to value a company does not exist. Therefore, there is no absolutely correct value for an enterprise, since each method only produces referential values that will work as a first price reference for the negotiation between buyers and sellers of companies.
Furthermore, Damodaran (2006: 24) refers that valuing a company is a subjective process, which depends on the opinions and expectations of the appraisers, thus “any preconceptions and biases that an analyst brings to the process will find their way into the value”.
- 12 -
3.2 Multiples valuation method
According to Damodaran (2006: 233) “In relative valuation, the objective is to value an asset, based upon how similar assets are currently priced by the market”. Without the extensive list of assumptions needed in the Discounted Cash Flow method, the usage of multiples in equity valuation becomes much straightforward, especially when there are a large number of comparable companies listed on financial markets.
According to a research conducted by Juliana S. Trizi, André S. Pacheco, Roy Martelanc and Rodrigo M. Pasin (2004) to 29 experts who work in the area of mergers and acquisitions in investment banks and consulting companies in Brazil, the discounted Cash Flow is the most used company valuation method, closely followed by multiples valuation and at a far distance from all other valuation techniques. Furthermore, regarding the importance of multiples’ valuation, the investigators concluded that 87% of the experts that prefer to use DCF consider, at least, two other different methodologies to value a company, most of them mentioning Relative valuation. For Pablo Fernandez (2002: 4) there are a lot of different multiples to use, such as the Price/Sales, the Price/Book value, the Enterprise Value/Ebitda and the most used one, the PER – Price/Earnings ratio. Additionally, he concludes that “depending on the industry being analyzed, certain multiples are more appropriate than others”.
Note that the PER ratio gives a measure of how much investors are paying for each unit of net income, therefore the higher the PER, the more expensive the stock. The formula for this ratio is as follows:
- 13 -
3.3 Discounted Cash Flow valuation method
The Discounted Cash Flow methodology is one of the most used valuation techniques to access the value of a company, project, or investment opportunity, and for many academics it is the most correct way to do it. For Modigliani and Miller (2001) (apud Andréa Monteiro) the DCF is the most useful methodology to value assets and companies, and it is possible to be applied for all enterprises. Furthermore, Fernandez (2007: 2) adds that:
“The [valuation] methods that are becoming increasingly popular (and are conceptually
“correct”) are those based on discounting cash flow. These methods view the company as a cash flow generator and, therefore, assessable as a financial asset.”
Moreover, for Brealey and Myers (2003: 75) “Value today always equals future cash flow discounted at the opportunity cost of capital”.
The way to apply the method seems pretty straightforward at the first sight. For Brealey and Myers (2003) the appraiser simply has to estimate what the future free cash flows during the valuation horizon are, discount them at a rate that reflects their risk, and finally add the forecasted value of the business at the horizon, also discounted back to present value. Thus, the Discounting Cash Flow Model is generically calculated as follows:
(4) where,
Present value today (time 0)
Free Cash Flow in year 1
Appropriate discounting rate (cost of capital) Valuation Horizon
Free Cash Flow in periods H+1, H+2, etc8.
Therefore, and according to Damodaran (2006: 10), using the DCF valuation method “the value of an asset is not what someone perceives it to be worth, but rather it is a function of the expected cash flows on that asset.”
8
However, since it is not practical to forecast free cash flows year by year to infinity, the perpetuity formula is applied to find the terminal value of the company.
- 14 -
However, there are many variations when it comes to applying this general formula, making the application of the model much more complex:
First of all, there are different types of Cash Flows that can be used on the formula’s numerator. For example, we can think of CF as being either the free cash flow for the firm “FCFF” (amount of cash that is available in the company after paying all expenses and reinvestments) or the free cash flow for the equity “FCFE” (amount of cash that is available to be distributed to the shareholders, after paying all expenses, inclusive due to debt contracts, and making all reinvestments). This way:
(5) (6)
Secondly, depending on the Cash Flow used, the discounting rate to apply should be different. This way, if we are using the FCFF, we have to apply a discounting rate that reflects the overall risk of the firm or project under valuation. Since the most common situation is that a company is financed using both equity and debt sources, then the appropriate discounting rate to use is the weighted average cost of capital (WACC).
(7)
However, if we are using FCFE, the discounting rate does not have to reflect the risk of debt, only the risk of equity; thus, the discounting rate becomes the rate of return that shareholders demand9.
According to Esty (1999: 9), another complexity related with discounting rates comes out when the company’s leverage changes over time, like usually happens in reality. According to the author:
9 A more detailed explanation regarding how to calculate the cost of capital is going to be provided in a
- 15 -
“For the typical project, the ratio of debt to total capitalization starts at 0%, rises to somewhere in the neighbourhood of 60%-85%, and then falls back down to 0% in later years”.
Since the WACC is a function of the company’s capital structure, then every time that the leverage ratio changes, it should imply an adjustment in WACC. Therefore, according to Esty, the usage of a unique discounting rate throughout the entire life of the company is a simplifying assumption and appraisers should use multiple discounting rates for a more accurate valuation.
Moreover, depending on the CF used, the meaning for the final value of equation 4 changes. In fact, when we use FCFF, we obtain the market value of the whole company (that includes the sum of the value of equity and debt); while when we use FCFE, we only obtain the value of the equity. Therefore, using these two different CF we can decompose equation 4 into two different ones:
(8)
(9)
Furthermore, it is important to mention that small changes in inputs can result in large changes in the final values obtained, thus, to get a realistic value for the company or project, what we use as inputs (CF’s and discounting rates) should be carefully estimated. Since it becomes harder and harder to come with realistic estimates for the cash flows as time goes by, then, instead of trying to estimate cash flows to infinity, terminal value techniques, such as annuities and perpetuities, are used.
Finally, note that the Discounted Cash Flow valuation technique has advantages and drawbacks. Regarding that issue, Damodaran (2006: 15) refers that DCF when “done right, requires analysts to understand the businesses that they are valuing and ask searching questions about the sustainability of cash flows and risk”. Moreover, he
- 16 -
mentions that DCF “forces analysts to look for the fundamentals that drive value rather than what market perceptions are”. On the negative side, Damodaran states that “In the hands of sloppy analysts, discounted cash flow valuations can be manipulated to generate estimates of value that have no relationship to intrinsic value” and that “We also need substantially more information to value a company with discounted cash flow models, since we have to estimate cash flows, growth rates and discount rates”.
- 17 -
4. Company Valuation – CTT, Correios de Portugal, S.A.
4.1 Multiples valuation method
As discussed in the previous section, the Multiples (or Relative) valuation method is one of the most common approaches to find the fair value of a company.
Throughout the valuation of CTT’s Equity, we are going to use a very well-known “multiple”, reason why it is very easy to find it for every listed company in almost any financial website: the Price Earnings Ratio.
Furthermore, it is important to refer that the choice of comparable companies is crucial on multiples valuation, as depending on this selection the results may vary a lot. For the purpose of valuing CTT the comparable companies chosen were: Deutsche Post AG (Germany), Post NL NV (Netherlands), Oesterreichische Post Ag (Austria) and UK Mail Group PLC (United Kingdom). Note that CTT and all of these European companies share a similar market, offering logistic services and delivering packages, freight and mail all over the world. The following table summarizes the Trailing PER ratio of these companies, as of 1 July, 2011:
Price/Earnings ratio (Trailing)
Deutsche Post AG 14,258
Post NL N.V. 6,779
Oesterreichische Post AG 12,102
UK Mail Group PLC 13,349
Average P/E ratio (trailing) 11,622
Table 1 – Trailing PER of CTT’s comparable companies
The average P/E ratio is 11,622, which means that, on average, a company that operates in the postal sector has a market value of equity that is 11,622x its last year earnings. Applying this reasoning, the market value of Equity can be computed as follows:
(10)
The next table summarizes the CTT’s market value of Equity (654,4 Million Euros):
Average P/E ratio (trailing) 11,622
2010 CTT’s Earnings 56305
CTT’s market value of
Equity 654376
- 18 -
4.2 Discounted Cash Flow valuation method
4.2.1 FCFF approach
As explained in the last chapter, the discounted cash flow model is one of the available ways to calculate the fair value of a business. Throughout the valuation process, the appraiser has to estimate what the future free cash flows during the valuation horizon are, discount them at a rate that reflects their risk, and finally add the forecasted value of the business at the horizon, also discounted back to present value. This is the same as applying equation 4.
CTT’s valuation starts by applying the discounted CF model using as “cash flow input” the free cash flow for the firm (amount of cash that is available in the company after paying all expenses and reinvestments). After that, the obtained FCFF are used as a first step to calculate the FCFE and value the business using the Discounted FCFE procedure.
Before going straight to the estimation of future FCFF, it is important to refer that we are interested in calculating the fair value of all CTT group, not only of the holding company or a specific enterprise within the group, therefore, we will only use values from CTT’s consolidated financial statements.
4.2.1.1 Calculation of FCFF
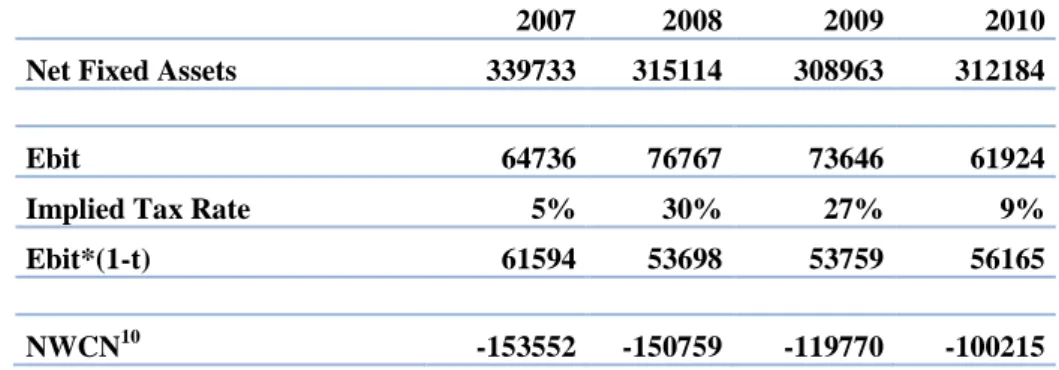
Therefore, and valuing CTT using the Discounted FCFF method (by applying equation 8), we start by calculating the past values of all necessary inputs (net fixed assets, Ebit x (1-t) and net working capital needs), which can be seen in the following table:
2007 2008 2009 2010
Net Fixed Assets 339733 315114 308963 312184
Ebit 64736 76767 73646 61924
Implied Tax Rate 5% 30% 27% 9%
Ebit*(1-t) 61594 53698 53759 56165
NWCN10 -153552 -150759 -119770 -100215
Source: Adapted from the company reports
Table 3 – Past values of FCFF necessary inputs (net fixed assets, Ebit x (1-t) and NWCN) Unit: 000’€
- 19 -
Net Fixed Assets
A company’s net fixed assets are those that are supposed to be part of the balance sheet for the long run, namely tangible or intangible fixed assets and long term financial investments. For the case of CTT, the net fixed assets are mainly composed of tangible fixed assets, more specifically, buildings and other constructions.
EBIT means “Earnings before Interest and Taxes” and it is commonly known in the finance world as “Operational Results”. This is a very important indicator of the company’s operational performance, since it measures the business’ results without taking into consideration the financing strategy and the interests associated with it, as well as the taxes paid. Therefore, this measure is concerned with the operations of the enterprise, meaning the volume of sales and the operational costs carried to generate production, such as costs with employees, costs of the goods sold, supplies and services and amortizations. Due to the usefulness of this indicator, EBIT is already calculated in the CTT’s reports, under the name “Operational Results”.
However, FCFF formula uses as input not EBIT, but . Therefore, and using the following formula, we still have to calculate the implied income tax rate ( .
(11)
Net working capital needs
The Net Working Capital Needs represent the operating liquidity (possibility of assets to be readily converted into cash) available to a business and, along with net fixed assets, they are considered a part of Operating Capital. Note that Positive Working Capital Needs (Operating Current Assets higher than Operating Current Liabilities) are required for a firm to finance its operations and have sufficient funds to satisfy both maturing short-term debt and upcoming operational expenses.
A company’s net working capital needs can be computed using the following formula:
- 20 -
After that, the second step towards the calculation of FCFF is to analyze the evolution of sales. According to the consolidated income statements, the Group’s revenues showed an undefined trend throughout the period under analysis, increasing in 2007 and 2008 and decreasing in the last two years, leading to an average growth rate of -0,1%.
2006 2007 2008 2009 2010
Revenues 786564 826283 844721 807968 779866
g(Revenues) - 5,0% 2,2% -4,4% -3,5%
Source: Adapted from the company reports Table 4 – CTT’s historical revenues Unit: 000’€
However, for conservative purposes, we are going to assume that sales will decrease at 1,5% for the next two years, and then, for 2013 and 1014, as the Portuguese economy should start to recover, we will assume a 1% growth rate. Moreover, for the terminal year (2015), we are going to use a terminal growth rate of 3%. A final mention to say that we are going to use a recursive method throughout the estimation of sales, i.e.:
(13)
Using the assumptions previously explained, the next table shows the estimated sales for the period 2011-2015:
2011 2012 2013 2014 2015
Assumed Revenues 768168 756645 764212 771854 795010
Table 5 – CTT’s estimated revenues Unit: 000’€
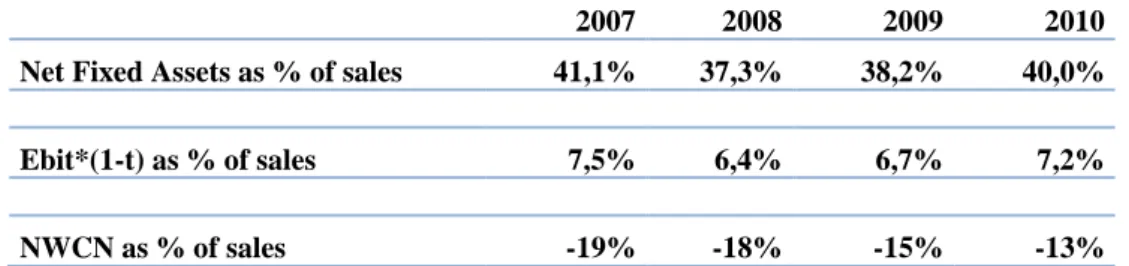
At this point, note that future investments and operational results are likely to grow in accordance with the evolution of sales, therefore, to get the estimated values of Ebit x (1-t), NWCN and Net Fixed Assets we have to multiply the historical ratios of those inputs as % of sales by the estimated sales.
2007 2008 2009 2010
Net Fixed Assets as % of sales 41,1% 37,3% 38,2% 40,0%
Ebit*(1-t) as % of sales 7,5% 6,4% 6,7% 7,2%
NWCN as % of sales -19% -18% -15% -13%
- 21 -
The average Net Fixed Assets as percentage of sales was 39,1%, while the average ratio for the case of the Ebit x (1-t) was 6,9%. Due to the undefined trend and lower variance between the historical ratios within the period under analysis, these values are the ones that are going to be used in the estimation of the future amounts of Net fixed assets and Ebit x (1-t).
However, for the case of NWCN, the historical ratio showed an increasing trend (even though remaining negative) throughout the analyzed period. Therefore, the assumed ratio to apply in the estimation of future NWCN is going to be the average of the last two years (-14%), instead of the average between 2007 and 2010 (-16%).
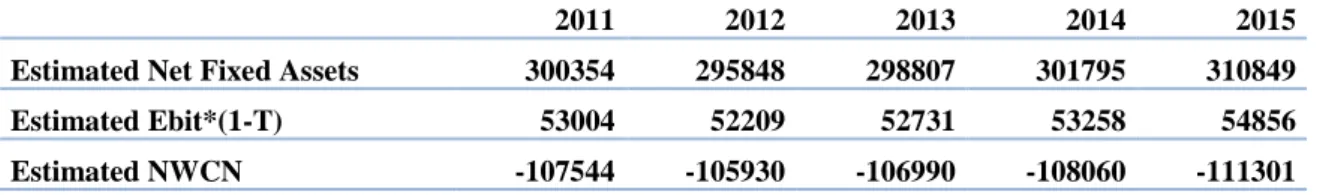
As already explained, by multiplying the assumed ratios of NWCN, Ebit x (1-t) and Net Fixed Assets as % of sales by the amount of future sales, we get their estimated values:
2011 2012 2013 2014 2015
Estimated Net Fixed Assets 300354 295848 298807 301795 310849
Estimated Ebit*(1-T) 53004 52209 52731 53258 54856
Estimated NWCN -107544 -105930 -106990 -108060 -111301
Table 7 – Estimated Net Fixed Assets, Ebit x (1-t) and NWCN Unit: 000’€
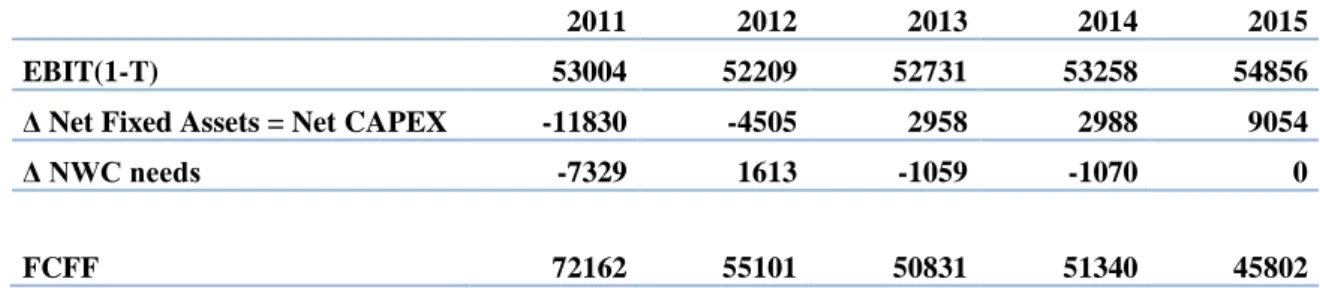
At this point, to compute the estimated FCFF, we only need to calculate the variation of Net Fixed Assets and of Net Working Capital Needs:
(14)
(15)
Net Capex is related with the investment in fixed assets, either acquisition of new ones or fixing existing assets. Therefore, Net Capex represents an outflow of money, appearing in the FCFF formula with a minus sign.
The variation of Net Working Capital Needs also represents an investment, thus, entering in the FCFF formula with a negative sign. Furthermore, we conclude that, except for year 2012, CTT has not invested in NWC, which leaves more money available for other strategic decisions, consequently increasing FCFF. However, for the
- 22 -
terminal year and for conservative purposes, it is common to assume that the variation of NWCN is 0, whenever, by applying formula 15, we get a negative value.
Now that , Net Capex and variation of NWCN were already estimated for the period 2011-2015, to get the FCFF we just have to apply formula 5:
2011 2012 2013 2014 2015
EBIT(1-T) 53004 52209 52731 53258 54856
Δ Net Fixed Assets = Net CAPEX -11830 -4505 2958 2988 9054
Δ NWC needs -7329 1613 -1059 -1070 0
FCFF 72162 55101 50831 51340 45802
Table 8 – Estimated Free Cash Flow for the Firm Unit: 000’€
4.2.1.2 Estimation of the Discounting Rate 4.2.1.2.1 Contextual Introduction to WACC
As already discussed, now that the future FCFF of CTT were estimated, the next step is to get the appropriate discounting rate, which, for the case of FCFF, has to be a rate that reflects the overall company’s cost of capital.
In modern financial theory, a standard means of expressing a company’s cost of capital is the WACC: the weighted-average of the cost of the different types of capital financing the company (usually equity and debt). For example, Bierman (1993) surveyed 74 companies listed on “Fortune 100 companies” and 93% of them said that they use the weighted-average cost of capital (WACC) as the discounting rate for capital budgeting purposes. In mathematical terms, the WACC’s formula is:
(16)
According to Michael S. Pagano and David E. Stout (2004) a firm's cost of capital is the investor's opportunity cost of investing his capital in the company, and therefore, an estimate of the firm's WACC quantifies the average return expected by all investors in the enterprise, such as creditors of short-term and long-term interest-bearing debt and stockholders. This way, the firm's cost of capital is a weighted average where the weights are determined by the market value of the various sources of capital.
- 23 -
Therefore, the next important problem to solve towards CTT’s valuation is finding out the company’s WACC. As seen in the previous formula, the WACC is dependent on two very important components: the cost of equity and the cost of debt. Let’s first explore the cost of equity.
4.2.1.2.2 Cost of Equity
According to Michael S. Pagano and David E. Stout (2004: 13) the cost of equity is the most difficult component to estimate within a firm's WACC, as it depends on various assumptions and practical choices. For them:
“Conventional methods for estimating WACC, therefore, can yield substantially different approximations depending on the assumptions used in estimating Ks [the cost of equity], so good judgment and sensitivity analysis are required when attempting to estimate a firm's cost of capital for applications in accounting and finance”.
The cost of equity is the return, composed by dividends and capital gains, which stockholders require to invest in a company. Therefore, it represents the compensation that shareholders demand in exchange for owning the asset and bearing the risk of owning an enterprise. The formula for the cost of equity under the “traditional” dividend capitalization model is:
(17)
However, there are many other ways of calculating the cost of equity. One of the most famous models used for that purpose is the Capital Asset Pricing Model, worldwide known by CAPM. This model was first developed by Sharpe (1964), incorporating assumptions about investors’ utility functions (they are assumed to prefer a higher level of wealth to a lower one and to exhibit risk aversion, choosing an investment offering a lower value of standard deviation to one with a greater level, given the same expected return) and assuming a market with a large number of participants, each of whom having access to the same set of information. Under this context, and according to Sharpe, by using a diversified portfolio, the investor can avoid part of the risk inherent to an asset, being non-sense to use the asset’s total risk as the determinant key influencing its price. According to Sharpe’s words (1964: 441):
- 24 -
“(…) diversification enables the investor to escape all but the risk resulting from swings in economic activity – this type of risk remains even in the efficient combinations. And, since all other types can be avoided by diversification, only the responsiveness of an asset’s rate of return to the level of activity is relevant in assessing its risk. Prices will adjust until there is a linear relationship between the magnitude of such responsiveness and expected return. Assets which are unaffected by changes in economic activity will return the pure interest rate; those which move with the economic activity will promise appropriately higher expected rates of return.”
Therefore, according to the CAPM, the required rate of return ( ) on any asset can be expressed as follows:
(18)
Where:
= risk-free interest rate of return, i.e., interest rate available on a risk-free bond. = required return for investors to hold the broad market portfolio of risky assets. = relative risk of a particular asset.
However, since 1960s, when the usage of Capital Asset Pricing Model became very popular, some practitioners started making extensions in the initial version of CAPM, being the Arbitrage Pricing Theory and the Fama & French model the most famous ones.
The Arbitrage Pricing Theory (APT), developed by Ross in 1976, is a generalization of the previously described single-factor CAPM model in order to take into account multiple systematic risk factors (and not only the market portfolio risk factor, as in the CAPM). The main problem of this newer approach is that it does not spell out what those extra factors should be, which, even though being more efficient than CAPM, makes it much more difficult to apply in real life. This way, researchers have conducted extensive empirical testing on macroeconomic and financial variables to find out additional factors that might improve the explanatory power of CAPM, and the growth rates of GDP, inflation and interest rates were some of the risk factors found.
Another extension to the Capital Asset Pricing Model is the Fama and French three factors model, after having concluded about the empirical failures of CAPM. According
- 25 -
to Fama and French (1992: 438) “regressions show that market does not help explain average stock returns for 1963-1990” for USA stocks listed on NASDAQ, NYSE and AMEX. Moreover, they confirm that stock risks are multidimensional and that other variables such as size and book-to-market equity ratios help explain stock returns. This way, Fama and French (1993) developed a three-factor model, which according to them would be much more successful in the description of average stock returns than the simple CAPM. The first risk factor is the excess return on the market portfolio (exactly like in the original CAPM), adding as factors, as well, the spread in returns between small and large-sized firms (referred as "Small Minus Big" factor, which is based on the company's market capitalization) and the spread in returns between value (with high book-to-market equity ratios) and growth stocks (with low book-to-market equity ratios) (referred as "High Minus Low" factor, which is related to the relative valuation of the company).
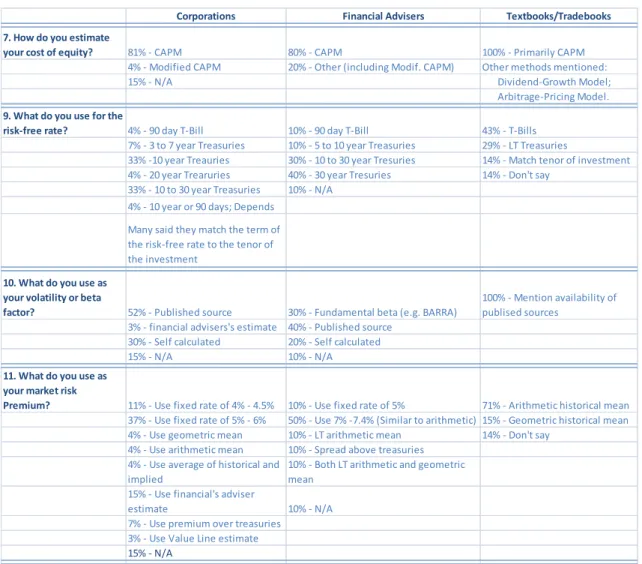
Now, after having presented a brief revision about the cost of equity, the next crucial problem is to find out what the most used model in company’s real life is, which, ultimately, should be the one used to compute CTT’s cost of equity. Regarding this topic, let’s take a look at a research conducted by Bruner, Eades, Harris and Higgins (1998) within 27 highly regarded corporations, ten leading financial advisers and seven best selling textbooks/trade books. The next table shows some of the most relevant questions they made and the correspondent answers they got.
- 26 -
Source: Adapted from the research conducted by Bruner, Eades, Harris and Higgins
Table 9 – Results of a research performed to Corporations, Financial Advisers and Textbooks/trade books regarding the cost of equity
One of the main conclusions that the interviewers arrived is that the CAPM is the dominant model for estimating the cost of equity, therefore, and considering this, we are going to use this method throughout the estimation of CTT’s cost of equity.
Risk free interest rate
The first input in the CAPM formula is the risk free interest rate, which is the theoretical rate of return for an investment which has no risk. Now, thinking about the risk free interest rate to apply in the CAPM formula for the purpose of valuing CTT, the first thought that comes to mind is: There are so many risk free interest rates. Which one should we pick? Well, this is an interesting question and here comes one of the many subjective choices that has to be done in a valuation process.
Corporations Financial Advisers Textbooks/Tradebooks
7. How do you estimate
your cost of equity? 81% - CAPM 80% - CAPM 100% - Primarily CAPM
4% - Modified CAPM 20% - Other (including Modif. CAPM) Other methods mentioned:
15% - N/A Dividend-Growth Model;
Arbitrage-Pricing Model.
9. What do you use for the
risk-free rate? 4% - 90 day T-Bill 10% - 90 day T-Bill 43% - T-Bills
7% - 3 to 7 year Treasuries 10% - 5 to 10 year Treasuries 29% - LT Treasuries
33% -10 year Treauries 30% - 10 to 30 year Tresuries 14% - Match tenor of investment 4% - 20 year Trearuries 40% - 30 year Tresuries 14% - Don't say
33% - 10 to 30 year Treasuries 10% - N/A 4% - 10 year or 90 days; Depends
Many said they match the term of the risk-free rate to the tenor of the investment
10. What do you use as your volatility or beta
factor? 52% - Published source 30% - Fundamental beta (e.g. BARRA)
100% - Mention availability of publised sources
3% - financial advisers's estimate 40% - Published source 30% - Self calculated 20% - Self calculated
15% - N/A 10% - N/A
11. What do you use as your market risk
Premium? 11% - Use fixed rate of 4% - 4.5% 10% - Use fixed rate of 5% 71% - Arithmetic historical mean 37% - Use fixed rate of 5% - 6% 50% - Use 7% -7.4% (Similar to arithmetic) 15% - Geometric historical mean 4% - Use geometric mean 10% - LT arithmetic mean 14% - Don't say
4% - Use arithmetic mean 10% - Spread above treasuries 4% - Use average of historical and
implied
10% - Both LT arithmetic and geometric mean
15% - Use financial's adviser
estimate 10% - N/A
7% - Use premium over treasuries 3% - Use Value Line estimate
- 27 -
The first issue is from where to pick the interest rate. Since CTT is a Portuguese company, it makes sense to use an European risk free interest rate. Consequently, the common practice is to pick the interest rate on a German government bond (AAA rating according S&P, therefore, with almost no default risk).
After solving this problem, the second issue is from which maturity to pick the interest rate. By looking at table 9, the common approach is to match the maturity of the investment with the maturity of the risk free interest rate. Since this master thesis’ goal is to get a forward looking measure of the value of CTT (i.e. to perform a long term valuation), it makes sense to get a long term interest rate, let’s say a 20 years interest rate.
Looking at Bloomberg market data, as of 24 June, 2011, the 20-years maturity on German Government Bonds had an yield of 3,47%, which is going to be the risk free interest rate used on the CAPM formula.
BETA of CTT
The beta coefficient is a key parameter in the CAPM model, measuring the security’s volatility relative to the market in which it is traded; therefore, the beta of a stock is a number describing the relation of its returns with those of the financial market as a whole. This way, assets with higher beta have higher non-diversifiable risk and investors require a higher rate of return to hold them.
The traditional way to compute the company’s beta is to use a regression of the enterprise’s quotations against those of the stock market and it is precisely here that the problem to find CTT’s beta begins. Since CTT is a 100% state owned company, it is not listed in any market. Therefore, how is it possible to get the beta of CTT?
According to Damodaran (2006), one useful way to solve this trouble is to look at the betas of publicly comparable companies. The main steps for this process are as follows:
1. Find some traded comparable companies that operate in the same industry; 2. Estimate the beta of each of those companies;
3. Compute the average beta using either a simple or a weighted average (using as weights the market capitalization of each company);
4. Estimate the unlevered average beta, using the debt to equity ratio and the tax rate of the sector.