R E S E A R C H A R T I C L E
Open Access
Predicting participation of people with
impaired vision in epidemiological studies
Pedro Lima Ramos
1,2, Rui Santana
3, Laura Hernandez Moreno
1, Ana Patricia Marques
3, Cristina Freitas
4,
Amandio Rocha-Sousa
5,6, Antonio Filipe Macedo
1,2*and The Portuguese visual impairment study group
Abstract
Background:The characteristics of the target group and the design of an epidemiologic study, in particular the recruiting methods, can influence participation. People with vision impairment have unique characteristics because those invited are often elderly and totally or partially dependent on help to complete daily activities such as travelling to study sites. Therefore, participation of people with impaired vision in studies is less predictable than predicting participation for the general population.
Methods:Participants were recruited in the context of a study of prevalence and costs of visual impairment in Portugal (PCVIP-study). Participants were recruited from 4 Portuguese public hospitals. Inclusion criteria were: acuity in the better eye from 0.5 decimal (0.30logMAR) or worse and/or visual field of less than 20 degrees. Recruitment involved sending invitation letters and follow-up phone calls. A multiple logistic regression model was used to assess determinants of participation. The J48 classifier, chi-square and Fisher’s exact tests were applied to investigate the possible differences between subjects in our sample.
Results: Individual cases were divided into 3 groups: immediate, late and non-participants. A participation rate of 20% was obtained (15% immediate, 5% late). Factors positively associated with participation included years of education, annual hospital attendance, and intermediate visual acuity. Females and greater distance to the hospital were inversely associated with participation.
Conclusion:In our study, a letter followed by a phone call was efficient to recruit a significant number of participants from a larger group of people with impaired vision. However, the improvement in participation observed after the phone call might not be cost-effective. People with low levels of education and women were more difficult to recruit. These findings need to be considered to avoid studies whose results are biased by gender or socio-economic inequalities of their participants. Young subjects and those at intermediate stages of vision impairment, or equivalent conditions, may need more persuasion than other profiles.
Keywords:Study participation, Epidemiologic studies, Study design, Vision impairment, Recruitment strategies
Background
Epidemiologic studies involve collecting data from large number of individuals. However, participation rates in such studies, particularly in industrialised countries, have been falling in the past 3 or 4 decades. A study in Finland showed a decline in response rates from 84% (men) and 85% (women) in 1978 to 59% (men) and 71% (women) in
2002 [1]. High participation is necessary to ensure, for example, that the participating group is a representative sample of the population. When recruiting fails, statistical power of the results is reduced and conclusions may be distorted [2–5]. In order to produce reliable outcomes, researchers need to consider possible problems arising during the recruitment process and, if possible, control for factors that lead to reduced participation.
During recruitment general and study-specific challenges arise according with the topic and the target population. Some studies have shown that participation rates are
* Correspondence:[email protected]
1Low Vision and Visual Rehabilitation Lab, Department and Center of Physics –Optometry and Vision Science, University of Minho, Braga, Portugal 2Department of Medicine and Optometry, Linnaeus University, 39182 Kalmar, Sweden
Full list of author information is available at the end of the article
influenced by: education (participation increasing with the level of education [6–8]), gender (women tend to participate more than men [9–11]) and marital status (married people participating more than others [12]). Another factor that has been found to influence partici-pation is general health, as given by the index of co-morbidities [8]. There are other aspects such as age in which results are less consistent, with some studies showing that older people are more likely to participate [9, 10], whilst others found higher participation rates among young people [6]. Less commonly reported de-terminants include, for example, ethnicity. In a study by Patel et al. black, asian and other ethnic minorities were less likely to participate [8]. However, in addition to the characteristics of the target group, recruiting strategies can also influence rates of participation.
Previous studies have shown that researchers, when contacting prospective participants, must sound trust-worthy and must take into account the motivations of the subject. Slegers and Glass recommend the use of public phone numbers and clear references stating that the study is being carried out by a public institution (when this is the case), in order to increase credibility [13]. They also recommend emphasizing that others in-vited have already responded to the study call and to provide open, clear and honest information from the onset (e.g. regarding monetary compensation or possible expenses). Personalised letters and reply paid envelopes are also known to improve response rates [14]. Other researchers investigated the primary reasons to take part in epidemiologic studies and concluded that participation is, amongst others, driven by moral reasons [13, 15]. In contrast, the actual effort required to participate has been identified has a barrier. Participation rates are expected to have a negative correlation with the amount of effort that participation requires [16].
The findings mentioned so far have been reported for studies in general; however, there is a lack of information about the profile of people with eye diseases and/or vision impairment (VI) who participate in epidemiological studies. Although, there is one study by Rahi et al. which investi-gated the engagement of families with children with VI [17]. However, this group was more interested in health ser-vice barriers for parents with children with VI [17].
Studies involving directly people with VI have unique characteristics because those invited are often elderly and totally or partially dependent on help to complete daily activities such as travelling to study sites. This makes participation more unpredictable than for many of the studies referred. The purpose of the project from where this study originates was to determine the causes of vision impairment amongst patients attending outpatient eye clinics. In parallel we also wanted to conduct a cross-sectional study
about the impact of VI and other clinical and social aspects [18–21].
Our goal with this study was to determine the prob-ability of participation as a function of personal charac-teristics, including severity of vision loss. We conducted a detailed investigation to distinguish between those who accepted the invitation to take part immediately from those who needed further contact before agreeing to participate. According to the “continuum of resist-ance” model, the more contacts a subject requires in order to take part in a study, the more similarities he/ she shares with non-participants [16,22]. The participa-tion model was tested in our sample by comparing those that agreed to participate with non-participants.
We hypothesized that: i) the lower the acuity is the less likely participation is; ii) participation is independent of the cause of VI; iii) participation is affected by the distance residence-hospital; iv) education increases participation; v) age and gender affect participation; vi) annual hospital at-tendance increases participation.
To our knowledge this is the first study to investigate participation rates and its determinants in research involv-ing people with VI. By studyinvolv-ing participant’s profiles, we hope to provide a significant contribution to the scientific community when planning studies involving people with VI and similar conditions.
Methods
Study design
Participants
Letters were posted using the hospital mail service, the logo of the hospital was printed on the envelope and letters were sent directly to the patients’address. All documents were printed in font Arial- 16 point. The mail envelope included a letter of invitation signed by a physician from the local hospital (1 page), an information booklet (3 pages), a consent form (1 page) and a reply-paid envelope addressed to Escola Nacional de Saúde Publica, Lisboa (National School of Public Health, Lisbon). Information was printed on both sides of the paper; consent forms were printed on the reverse side of the invitation letter. In addition to infor-mation about investigators, institutions, contact details and clinicians involved in the study the letter contained a clear and isolated sentence (in Portuguese) with the instruction:
“If you agree to take part in this study, please tick the boxes in the flipside of this sheet, sign at the bottom of the page and provide a valid contact number for us to book your appointment at the hospital”.
If a response was not received within 2 weeks, a follow-up phone call was made. Calls were made by an ex-perienced hospital staff member trained and informed about the study with instructions to ask the following ques-tions: i)did you receive our letter?ii) If yes, can I provide any further information about the study and the letter?iii) Would you be interested in taking part in this study?If the person declined the invitation to participate, they were asked questions about: 1) years of education; 2) marital status; 3) annual hospital attendance.
For positive respondents, an appointment was booked at the hospital where they normally receive eye care and the same information was obtained. Those that agreed to take part in the study are defined as “ partici-pants” and those that declined after all attempts are de-fined as“non-participants”. Those that dropped out after initially agreeing were not included in either of these cat-egories. Participants were divided into 2 sub-grougps:“ im-mediate participants” - those who sent the reply paid envelope with the consent form without being contacted by phone, and “late participants” - those who agreed to take part in the study only after they were contacted by telephone.
Data analysis
A database was built with information about: age, gen-der, distance between residence and hospital where the participant was recruited (DISTH), years of educa-tion (EDU), marital status (MST), visual acuity in the better eye (VA), annual hospital attendance (AHAT-TEND), cause of vision impairment (CAUSE-VI), Charl-son comorbidities index (CCI). Information about causes of vision impairment and comorbidities to compute CCI was retrieved from medical records. The CCI
measures to which extent an individual is affected by comorbidities [24].
Univariate differences in participation rates according to the independent categorical variables were assessed using chi-square tests. DISTH, EDU and CCI are, un-less otherwise stated, continuous variables and the remainder are categorical. Multiple logistic regression (R data analysis software, v3.2.4 for Windows) was used to determine the effect of independent variables in participation rates. The final model was built upon a database with 600 individuals and the fit quality was firstly measured also within such database. That is, the sample was both the training data and the testing data. In addition, an internal validation of this model was performed, a 10-fold cross-validation using the logistic classifier of Weka 3.8.
Results
For the current study a group of 2130 individuals were contacted by letter. Of the initial 2130 letters sent, 31 were returned to sender and 349 individuals agreed to participate immediately (17% of 2099). Of these, 49 individuals eventually dropped out of the study for health reasons or transportation difficulties (the study only covered travel expenses up to 15 euro), this resulted in 300 immediate participants (15% of 2050).
Phone calls were made to 1750 non-respondents in order to invite them to participate; 89 were unreachable by phone. From the 1661 contacted by telephone 84 (5%) agreed to take part. Therefore, the final number of partici-pants was 384 (20%) out of 1961 that could be successful reached by letter and/or phone call.
In total, 600 individuals (260 females or 43%) with a mean age of 66 years (SD = 16.7) were included in this sam-ple. In our analysis 325 (54%) were participants and 275 (46%) were non-participants. Non-participants analysed are a random sample of the total (1577) selected from succes-sive cases in our list with all the required information. From the 384 participants only 325 were included in this report because the remaining 59 were waiting for the interview.
The median CCI for the entire sample was 0.6 (IQR = 1.8), amongst participants was 0.8 (IQR = 1.75), for non-participants was 0.5 (IQR = 1.5); this differ-ence was not statistically significant (Mann-Whitney, U = 1110, p= 0.45).
The median DISTH (in kilometres) for the complete sample was 9.6 km (IQR = 24.2), for participants was 1 km (IQR = 15.1) and for non-participants was 19.4 km (IQR = 38.7); this difference was statistically significant (Mann-Whitney, U = 24,416, p< 0.001). Other socio-demographic and VI-related data are sum-marized in Tables1and2.
Factors predicting participation using a logistic regression model
All the results reported in this section compare participants (the group who agreed to take part in the study after an in-vitation letter or letter and a follow-up phone call) with the cases of non-participants (the group of cases that declined after both contacts). We used a diagnostic test for the
Table 1Summary of the distribution of 600 subjects included in the analysis. Among 600, 325 are participantsa(immediate or late) and 275 non-participants randomly selected from 1577 total non-participants
Characteristic n(%) Participation YES/NO Participation (%) p-value (χ2)
Gender < 0.001
Male 339 (56.6) 225/114 66.4
Female 261 (43.4) 100/161 38.3
Age group 0.00535
< 20 yrs 14 (2.3) 12/2 85.7
20 to < 30 yrs 8 (1.3) 6/2 75.0
30 to < 40 yrs 28 (4.7) 27/1 96.4
40 to < 50 yrs 43 (7.2) 34/9 79.1
50 to < 60 yrs 82 (13.7) 52/30 63.4
60 to < 70 yrs 137 (22.8) 80/57 58.4
≥70 yrs 288 (48.0) 114/174 39.6
Number of Hospital Appointments per year (AHATTEND) < 0.001
Low - AHA (≤4×/yr) 173 (28.8) 52/121 30.1
Medium - AHA (5 to 9×/yr) 178 (29.7) 86/92 48.3
High–AHA (≥10×/yr) 249 (41.5) 187/62 75.1
Marital Status (MST) < 0.001
Married 261 (43.5) 110/151 42.1
Living together 85 (14.2) 76/9 89.4
Single 82 (13.7) 56/26 68.3
Widow 131 (21.8) 48/83 36.6
Divorced 41 (6.8) 35/6 85.4
Visual Acuity- decimal scale (VA) < 0.001
0 42 (7.0) 26/16 61.9
0.1 80 (13.3) 51/29 63.8
0.2 105 (17.5) 43/62 40.9
0.3 87 (14.5) 35/52 40.2
0.4 129 (21.5) 63/66 48.8
0.5 157 (26.2) 107/50 68.1
Aetiology of visual impairment (CAUSE-VI) 0.4336
Adult Macular Degeneration 76 (16.0) 31/45 40.8
Diabetic retinopathy 191 (40.1) 110/81 57.6
Glaucoma 60 (12.6) 26/34 43.3
Other 149 (31.3) 81/68 54.4
Multiple or undefined 124
multicollinearity of predictors, the variance inflation factor, calculated for each predictor. The highest inflation factor was 1.67 for AHATTEND. Which means that AHAT-TEND was slightly correlated with the other predic-tors; nevertheless, this value was below the critical value of 2.5 reported in the literature as the tolerable upper limit [26].
In an initial model, with a binary dependent variable that assigned a value of 1 to “participants” and 0 to “non-participants”, some variables were independent pre-dictors of participation (see Additional file1: Table S1).
Amongst categorical predictors we found an effect for gender (males participated more,p< 0.001), AHATTEND (participation for AHA-high was different from
Table 2Summary of the distribution of all cases (n= 600) according to participation
Characteristic Participants (n= 325) Non-participants
(n= 275) n(%)
p-value (χ2)
Immediate (n= 241)n(%) Late (n= 84)n(%)
Gender < 0.001
Male 183 (75.9) 42 (50) 114 (41.4)
Female 58 (24.1) 42 (50) 161 (58.6)
Age group 0.00535
< 20 yrs 10 (4.1) 2 (2.4) 2 (0.7)
20 to < 30 yrs 2 (0.8) 4 (4.8) 2 (0.7)
30 to < 40 yrs 14 (5.8) 13 (15.5) 1 (0.4)
40 to < 50 yrs 27 (11.2) 7 (8.3) 9 (3.3)
50 to < 60 yrs 43 (17.8) 9 (10.7) 30 (10.9)
60 to < 70 yrs 64 (26.6) 16 (19) 57 (20.7)
≥70 yrs 81 (33.7) 33 (39.3) 174 (63.3)
Number of Hospital Appointments per year < 0.001
Low - AHA (≤4×/yr) 42 (17.4) 10 (11.9) 121 (44)
Medium - AHA (5 to 9×/yr) 70 (29) 16 (19) 92 (33.5)
High–AHA (≥10×/yr) 129 (53.6) 58 (69) 62 (22.5)
Marital Status < 0.001
Married 75 (31.1) 35 (41.7) 151 (54.9)
Living together 76 (31.5) 0 (0) 9 (3.3)
Single 35 (14.5) 21 (25) 26 (9.5)
Widow 25 (10.4) 23 (27.3) 83 (30.2)
Divorced 30 (12.4) 5 (6) 6 (2.1)
Visual Acuity (decimal scale) < 0.001
0 18 (7.5) 8 (9.5) 16 (5.8)
0.1 28 (11.6) 23 (27.4) 29 (10.5)
0.2 33 (13.7) 10 (11.9) 62 (22.5)
0.3 31 (12.9) 4 (4.8) 52 (18.9)
0.4 47 (19.5) 16 (19) 66 (24)
0.5 84 (34.8) 23 (27.4) 50 (18.3)
Aetiology of visual impairment(*) 0.4336
Age-related Macular Degeneration 18 (7.5) 13 (15.5) 45 (16.4)
Diabetic retinopathy 87 (36.1) 23 (27.4) 81 (29.5)
Glaucoma 17 (7.1) 9 (10.7) 34 (12.4)
Other 58 (24.1) 23 (27.4) 68 (24.7)
participation for AHA-low,p< 0.001), MST (co-habiting, single or divorced individuals were more likely to partici-pate than married individuals, p< 0.001), VA (individ-uals with VA of 0.2 or 0.3 were less likely to participate than blind individuals,p< 0.001) and CAUSE- VI (individ-uals with diabetic retinopathy were more likely to partici-pate than individuals with AMD,p= 0.03).
Amongst continuous predictors we found statistically significant effects for DISTH (participation reduced with increasing distance,p< 0.001) and EDU (participation in-creased with the number of years of education,p< 0.001).
The initial set of levels for each categorical variable were based on authors’experience (see Additional file1: Table S1). For the final model, non-significant variables were removed and other levels or categories were defined as summarized in Additional file 2: Table S2. We now give an example to explain the rational. In the initial model, Additional file1: Table S1, we observed that the effect of“Medium-AHA”in participation was not sta-tistically different (p= 0.075) from the reference category “Low-AHA”, therefore we merged these 2 categories and re-classified cases as “AHA-rare”, Additional file 2: Table S2. Cases classified as“High-AHA”in the first model were kept separately because there was a statistically significant effect of this category in the model (p< 0.001). This cat-egory was renamed“AHA-frequent” to be consistent with the other category of the variable AHATTEND.
The variance inflation factor was recalculated for each predictor. The highest value obtained was 1.079 for MST, which means that multicollinearity can be ignored. Results for the final model are summarized in Table 3. All independent variables considered had a significant effect on the dependent variable. The de-viance chi-squared goodness of fit test confirmed an excellent fit of the model to the data (p-value = 0.99).
The likelihood of participation increased if individ-uals were male, had AHA-frequent, had VA-extreme, if they were co-habiting or were divorced, with more EDU and less DISTH. Formula 1 and Formula 2 summarize these results:
Linear predictor¼−1:71−1:27 If Gender¼
}female}
−0:02DISTH þ0:21EDU
þ1:64 If AHATTEND¼
}frequent}
þ3:26 If MST¼
}co
−habiting}
þ2:74 If MST¼
}divorced}
þ1:1 If VA¼
}extreme}
ð1Þ
Participation probability¼ e
linear predictor
1þelinear predictor ð2Þ
A 10-fold (10 iterations) cross-validation of the predic-tion model was performed. Before the iterapredic-tion the Weka 3.8 software splits the 600 cases into 10 subsam-ples (60 cases each). For each iteration, during the valid-ation process, each sample was chosen, at random, once as“testing data”. The remainder 9 (540 cases) were used to generate temporary models. The 10 temporary models were then averaged to generated the final theoretical model which was tested against the real participation re-sults for the 600 cases. The coefficients of the resulting theoretical model were very similar to those summarized in Table3. The theoretical model classified correctly 484 out of 600 cases, with a weighted average precision of 0.809, a weighted average F-Measure of 0.808 and a weighted average ROC area of 0.872. If taken together the results of the internal validation and the deviance chi-squared goodness of fit, we can say that the model fits the real data accurately.
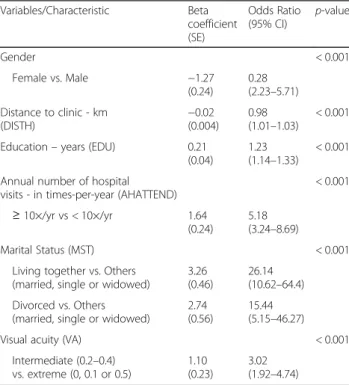
Table 3 provides the odds ratios (ORs) for study par-ticipation. It can be observed that, for example, the odds of a man participating in the study was 3.57 times higher than the odds of a woman.
The model expressed in Formula1and Formula2was simulated using Matlab (v2014b, Matworks inc.). The simulation allows the visualization of the probability of participation estimated by the model for extreme cases.
Table 3Multivariable logistic regression model used to predict the probability of participation
Variables/Characteristic Beta coefficient (SE) Odds Ratio (95% CI) p-value
Gender < 0.001
Female vs. Male −1.27 (0.24)
0.28 (2.23–5.71) Distance to clinic - km
(DISTH)
−0.02 (0.004)
0.98 (1.01–1.03)
< 0.001
Education–years (EDU) 0.21 (0.04)
1.23 (1.14–1.33)
< 0.001
Annual number of hospital visits - in times-per-year (AHATTEND)
< 0.001
≥10×/yr vs < 10×/yr 1.64 (0.24)
5.18 (3.24–8.69)
Marital Status (MST) < 0.001
Living together vs. Others (married, single or widowed)
3.26 (0.46)
26.14 (10.62–64.4) Divorced vs. Others
(married, single or widowed)
2.74 (0.56)
15.44 (5.15–46.27)
Visual acuity (VA) < 0.001
Intermediate (0.2–0.4) vs. extreme (0, 0.1 or 0.5)
1.10 (0.23)
3.02 (1.92–4.74)
According with the final model, the worst profile regard-ing the probability of participation, was beregard-ing female at-tending the hospital 10× or less a year, married, single or widowed, with VA 0.2–0.4. The best profile was being male; attending the hospital 10× or more a year, living in a non-marital partnership, and VA ≤0.1 or 0.5. The model was implemented for these two situations as a function of the continuous variables distance residence-hospital
(DISTH) and education in years (EDU), the results are shown in Fig.1.
In both cases the probability of participation increases when the distance residence-hospital decreases and educa-tion increases.
For the best profile and for distances 0-150 km, the par-ticipation probability reduces slowly. That is, the distance residence-hospital is almost irrelevant within the range 0-150 km. For distance values greater than 150 km the probability of participation decreases sharply. When living over 150 km away from the hospital, distance would be a big barrier for participation, in particular for those with less than 10 years of education.
Amongst individuals with the worst profile for partici-pation, the distance residence-hospital had little impact for those with less than 10 years of EDU; for EDU greater than 10 years the distance residence-hospital is an important factor for participation when is below 100 km.
The group with the best profile would always have a minimum participation probability of approximately 40% and the worst profile group a maximum participation probability of approximately 60%.
Comparison between immediate participants (Ipar) and late participants (Lpar)
Here we report results of a comparison between two sub-groups of participants (participants = Ipar+Lpar). Ipar = accepted to participate when invited by letter only; Lpar = accepted to participate after letter followed by a phone call.
We found that the percentage of Lpar+Ipar was signifi-cantly higher than Ipar only (McNemar’s test, p< 0.001). This shows that the number of participants increased sig-nificantly after the follow-up phone call. We investigated if there was a difference between Ipar and Lpar for the demographic aspects summarized in Table4.
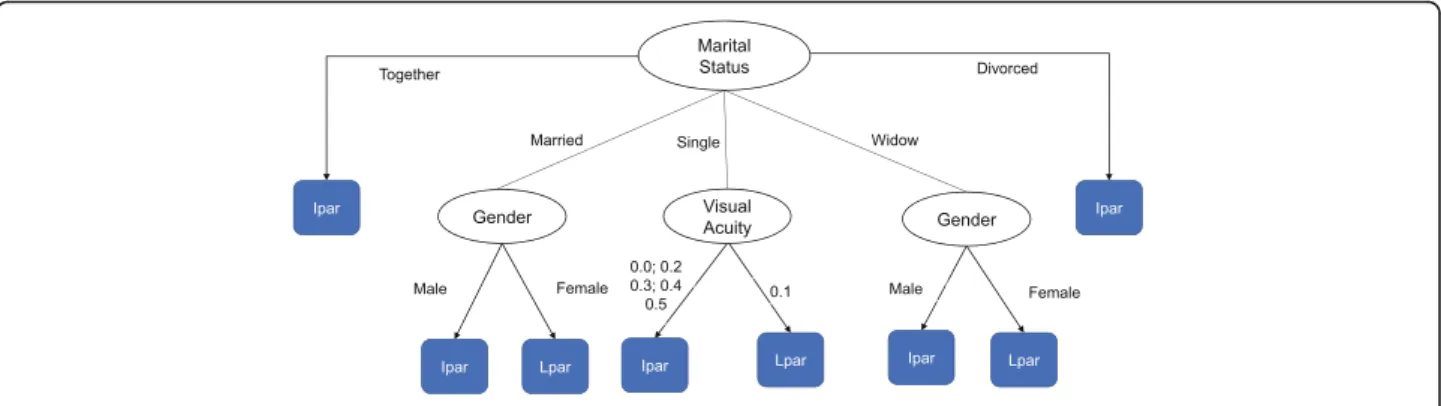
To build the categories defined in Table4, first we in-vestigated the existence of optimal cut points for the variables using the J48 classifier (Weka 3.8). The result-ant decision tree is shown in Fig. 2 - in which the oval nodes represent random variables and rectangular nodes represent decisions or predictions. This classification model has a weighted average precision of 0.821, a weighted average F-Measure of 0.813 and a weighted average ROC area of 0.792. With this method we can predict, for example, that a widow man will be an imme-diate (Ipar) instead of a late (Lpar) participant. It also predicts that an individual that is single and has VA of 0.1 will be a Lpar instead of an Ipar.
The decision about which demographic aspects would be compared was based on 3 criteria applied according with the sequence presented here: (1) specific hypothesis
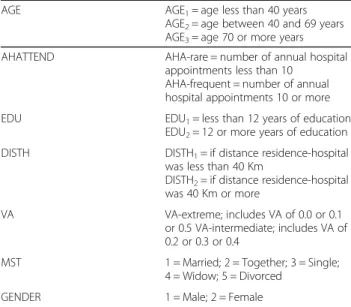
Table 4Categories used to analyse differences between immediate (Ipar) and late participants (Lpar) and between late and non-participants (Npar)
AGE AGE1= age less than 40 years AGE2= age between 40 and 69 years AGE3= age 70 or more years AHATTEND AHA-rare = number of annual hospital
appointments less than 10 AHA-frequent = number of annual hospital appointments 10 or more EDU EDU1= less than 12 years of education
EDU2= 12 or more years of education DISTH DISTH1= if distance residence-hospital
was less than 40 Km
DISTH2= if distance residence-hospital was 40 Km or more
VA VA-extreme; includes VA of 0.0 or 0.1 or 0.5 VA-intermediate; includes VA of 0.2 or 0.3 or 0.4
MST 1 = Married; 2 = Together; 3 = Single; 4 = Widow; 5 = Divorced
GENDER 1 = Male; 2 = Female
that the researchers wanted to test, (2) the cut-off points resulting from the J48 classifier analysis and (3) the number of subjects in each category.
The percentage of males in the Ipar was 76% (183 of 241) and in the Lpar was 50% (42 of 84); the distribution by gen-der was different in both groups (chi-square = 20.21, df = 1, p< 0.001).
The percentage of males in the AGE1group was 12%
(22 of 183) amongst Ipar and 40% (17 of 42) amongst Lpar (chi-square = 19.3, df = 1, p< 0.001, after Bonfer-roni adjustment). For males with AGE2, the percentage
was 56% (102 of 183) amongst Ipar and 31% (13 of 42) amongst Lpar (chi-square = 7.3, df = 1, p= 0.006, after Bonferroni adjustment).
The percentage of participants with AHA-rare within the group of those who are males and AGE2was 46% (47 of
102) amongst Ipar and 15% (2 of 13) amongst Lpar (Fisher’s exact test,p= 0.04).
The percentage of participants with EDU1 within the
group of those who are females, AGE2and AHA-frequent
was 95% (18 of 19) amongst Ipar and 60% (6 of 10) amongst Lpar (Fisher’s exact test,p= 0.036).
Comparison between late participants (Lpar) and non-participants (Npar)
Here we report an analysis comparing Lpar with Npar (Npar = those decline participation after two invitations). We wanted to investigate if the the profile of Npar and Lpar was similar. If that was true the percentage of cases in each demographic category should be similar in both sub-groups. This analysis is similar to the one performed in the previous section. The J48 classifier originated the decision tree shown in Fig.3.
This classification model has a weighted average pre-cision of 0.801, a weighted average F-Measure of 0.803 and a weighted average ROC area of 0.688. The classi-fier predicts that someone younger than 40 years that is not an Ipar will be a late participant (LPar) instead of a non-participant (NPar).The classification tree was used to define the levels summarized in Table4. It was upon these levels that differences between Lpar and Npar were formally investigated.
The first finding was a difference in age between Lpar and Npar. The percentage of individuals with AGE1 was
20% (17 of 84) amongst Lpar and was 2% (5 of 275) Fig. 2Classification tree originated by the C4.5 / J48 algorithm predicting immediate and late participation
amongst Npar (Fisher’s exact test, p< 0.001). For those in the group AGE3 the proportion was 39% (33 of 84)
amongst Lpar and 63% (174 of 275) amongst Npar (chi-square = 12.82, df = 1,p< 0.001). The percentage of DISTH1 subjects within the group of those who are
AGE2was 97% (32 of 33) in Lpar and 78% (76 of 98) in
Npar (Fisher’s exact test,p= 0.009).
The percentage of individuals with EDU1 within the group AGE2was 73% (24 of 33) in Lpar and 98% (96 of 98)
in Npar (Fisher’s exact test, p< 0.001). The percentage of individuals with EDU1within the group of those who are
AGE3was 88% (29 of 33) in Lpar and 96% (167 of 174)
amongst Npar (Fisher’s exact test,p= 0.013).
The percentage of AHA-rare subjects within the group of those who are AGE2 was 9% (3 of 33) in the Lpar
group and 45% (44 of 98) in the Npar group (Fisher’s exact test,p< 0.001).
The percentage of individuals AGE3 and AHA-rare
was 18% (6 of 34) in the Lpar group and 45% (77 of 172) in the Npar group. (Fisher’s exact test,p= 0.004).
The percentage of VA-extreme subjects within the group of those who are AGE1was 76% (13 of 17) in Lpar and 20%
(1 of 5) in Npar (Fisher’s exact test,p= 0.039). The percent-age of VA-extreme subjects within the group of those who are AGE2was 61% (20 of 33) in Lpar and 35% (34 of 98) in
Npar (chi-square = 6.84, df = 1, p= 0.009). The percentage of VA-extreme subjects within the group of those who are AGE3was 64% (21 of 33) in Lpar and 33% (58 of 174) in
Npar (chi-square = 9.44, df = 1,p= 0.002).
Non-participants were asked to specify reasons for non-participation and the most commonly mentioned reasons were:
“I am too debilitated to participate”
“It is far away from my home”
“There are no benefits in participating”
“I have no one to go with me”
Discussion
In this study we investigated participation rates in the PCVIP study and its determinants. We obtained an overall participation rate of 20%, low participation was anticipated given that the target group of the population were people with impaired vision. Some that were willing to take part in interviews were not able to participate because travel arrangements were too expensive compared with the compensation offered by our study. Despite this, the par-ticipation rate was comparable to other studies involving participation in phone interviews in the Portuguese popu-lation [27]. Correia et al. were only able to interview 21.7% of those eligible for their study. When we analysed factors or determinants that are likely to affect participation rates in our study, we found that people at the extremes of VA (≤0.1 or less and 0.5) were more likely to participate than
those with intermediate acuities (0.2–0.4). Participation was independent of age and cause of VI but influenced by gen-der (males were more likely to participate). People living to-gether or divorced were more likely to participate than those in other categories of marital status. Participation re-duced with increasing traveling distances to the hospital but increased with the number of years of education. A high frequency of hospital appointments was also favourable to participation. A decision to participate was in-dependent of the Charlson comorbidities index.
The initial hypothesis regarding the effect of acuity was partially confirmed and we were also able to con-firm that the cause of VI was not a determinant of par-ticipation. Other results are in line with our initial hypotheses, specifically, we confirmed an effect of edu-cation, distance to the hospital and frequency of hospital attendance as determinants of participation in our study. Our model predicts that, for individuals with the best profile favouring participation, a minimum of 4 in 10 contacted would participate. For the worst profile, the maximum participation would be 6 out of 10. These profiles need to be considered when designing studies and planning recruitment.
Surprisingly subjects with severe vision loss, acuity 0.1 or less, were more likely to participate than those with better acuity, VA in the range 0.2–0.4. This finding seems to contradict the idea that the sustained willing-ness of individuals to participate can be inferred from the effort that participation requires [16]. It would be ex-pected, from the effort perspective, that someone with a worse acuity would have more difficulties participating than someone with better acuity. A possible explanation is that individuals at more advanced stages of their con-ditions may perceive a greater benefit in responding to study participation than those at less advanced stages. People at more advanced may have a stronger moral drive to help others in a similar situation [28]. Another explanation for this result can be the level of adjustment to vision loss. Individuals with worse acuity might be better adjusted to vision loss whilst those in the medium range may still be in the process of adjusting and; there-fore, less inclined to participate [29,30].
could be related to the spectrum of relationships of the target group of the population.
Factors such as distance to the hospital, education or annual hospital attendance are important when planning recruitment. Individuals living further away from the hos-pital were less likely to participate. This result seems to be explained by the“principle of the effort”that predicts an inverse relationship between effort and participation prob-ability [16]. In line with our results for education status, increased participation with the number of years of educa-tion has been reported in other studies [6–8]. The most likely reason for this is the ability to understand the pur-pose of the study and the contribution that studies can provide to the progress of knowledge. The participation odds for people visiting the hospital 10 or more times per year were higher than the participation odds of those who attend the hospital less than 10 times per year. Differences are likely to be due to the development of an acute civic awareness and/or familiarity with the hospital environ-ment amongst those visiting the hospital more frequently.
In this study we also looked at systematic differences between immediate and late participants. This analysis provides information regarding the spectrum of individ-uals in which a follow-up phone call can be effective. Overall, we can say that the phone call, as others have found, seems to be important in increasing the moral obligation to participate [13, 15]. Our operators noted that a substantial number of individuals changed their minds and eventually decided to take part in the study after the importance of their participation has been em-phasized. Compared with the initial letter, the follow-up call captured more women, more males younger than 40 years but fewer males within the age 40–69 years. Groups in which participation increased need more in-centives or clarification than the groups that did not change in participation. Our results are in agreement with other studies showing that Lpar tend to be younger than Ipar [31, 32]. Other differences between Ipar and Lpar that we found involve very small groups with spe-cific characteristics that seem to show only scattered combinations of patterns of participation.
By comparing late participants (Lpar) with non-partici-pants (Npar), we investigated if the model of“continuum of resistance” was valid in our sample. According with the “continuum of resistance”model the more contacts an indi-vidual requires to participate in a study the more similar he/she is to Npar [16, 22]. However, similar to results in other studies [33,34], we found many differences between the structure of the group of Lpar and Npar. In particular, the age distribution was different, Lpar were younger than Npar [31, 32]. Overall, there were several differences be-tween the structure of the group Lpar and Npar which somewhat contradicts what would be expected from the model“continuum of resistance”[31–33,35].
A limitation of our study was the lack of information concerning the economic status of the subjects that could potentially clarify some of the unexplained find-ings. Another aspect that we believe would strengthen our results would be the inclusion of responses from more subjects in both groups. Amongst others reasons, some non-participants were excluded from the analysis because they were unable to answer our questions by telephone (for example due to dementia, staying in nurs-ing homes, hospitalization) or the clinical information was of poor quality (to determine, for example, the Charlson comorbidities index). Therefore, the included cases may be slightly different from the general popula-tion of interest.
Conclusion
In conclusion, participation rates in our study were in-fluenced by gender, distance to the hospital, number of years of education, annual hospital attendance, marital status and visual acuity. There were considerable differ-ences between immediate participants and late partici-pants and between late participartici-pants and non-participartici-pants. Individuals with low levels of education and women were more difficult to recruit. These facts need to be taken in consideration in order to avoid studies that are biased by gender or socio-economic inequalities of the participants. Young subjects and those at intermediate stages of vision impairment, or equivalent conditions, might need more persuasion than other profiles.
Additional files
Additional file 1:Table S1.Initial regression model used. (DOCX 20 kb)
Additional file 2:Table S2.The table summarizes new categories that were defined after having run the first logistic regression. The categories were used for our final model. (DOCX 17 kb)
Additional file 3:Data used and analysed in this study. (XLSX 101 kb)
Abbreviations
AGE1:Age less than 40 years; AGE2: age between 40 and 69 years; AGE3: age
70 or more years; AHA-frequent: number of annual hospital appointments 10 or more; AHA-rare: number of annual hospital appointments less than 10; AHATTEND: annual hospital attendance; AMD: age-related macular degeneration; CAUSE-VI: cause of visual impairment; CCI: Charlson comorbidities index; DISTH: distance from the residence to the hospital; DISTH1: distance residence-hospital was less than 40 km; DISTH2: distance
residence-hospital was 40 km or more; VA: extreme includes VA of 0.0 or 0.1 or 0.5; VA: intermediate includes VA of 0.2 or 0.3 or 0.4; EDU: number of years of education; EDU1: less than 12 years of education; EDU2: 12 or more years of
education; Ipar: immediate participants; Lpar: late participants; MST: marital status; Npar: non-participants; PCVIP-study: Prevalence and Costs of Visual Impairment in Portugal: a hospital based study; SD: standard deviation; SE: standard error; VA: visual acuity in the better eye; VI: vision impairment
Acknowledgements
We would like to acknowledge Graham Brown and Peter Lewis for proofreading the manuscript.
– Amandio Rocha-Sousa (i)
– Marta Silva (i) – Sara Perestrelo (i) – João Tavares-Ferreira (i) – Ana Marta Oliveira (i) – Cristina Freitas (ii) – Keissy Sousa (ii) – Ricardo Leite (ii) – José C Mendes (ii) – Andreia B Soares (ii) – Rui C Freitas (ii) – Pedro Reimão (iii) – Marco Vieira (iii) – Joel Monteiro (iii) – Natacha Moreno (iv) – Gary Rubin (v) – -Ana P Marques (vi) – Rui Santana (vi) – Laura Moreno (vii) – Pedro L Ramos (vii) – Antonio F Macedo (vii)
(i) From the Department of Surgery and Physiology; Faculty of Medicine; University of Porto and Department of Ophthalmology and Centro Hospitalar São João, Portugal
(ii) From the Department of Ophthalmology, Hospital de Braga, Portugal
(iii)From the Department of Ophthalmology, Centro Hospitalar de Alto Ave, Portugal
(iv)From the Department of Ophthalmology, Hospital Sta Maria Maior, Portugal
(v) From the UCL-Institute of Ophthalmology, United Kingdom
(vi)From the National School of Public Health, NOVA University of Lisbon, Portugal
(vii)From the Low Vision and Visual Rehabilitation Lab, Department and Center of Physics–Optometry and Vision Science, University of Minho, Portugal and Linnaeus University, Department of Medicine and Optometry, Sweden
Funding
This study was supported by FCT (COMPETE/QREN) grant reference PTDC/ DPT-EPI/0412/2012 in the context of the Prevalence and Costs of Visual Impairment in Portugal: a hospital based study (PCVIP-study). PLR is funded by FCT (COMPETE/QREN) grant reference SFRH/BD/119420/2016.
Availability of data and materials
All data used and analysed in this study are provide in Additional file3.
Authors’contributions
AFM, RS, CF, ARS, designed the study; PLR, LHM, APM, CF, AFM, PORVIS group collected data and PLR, LHM, APM, AFM analyzed the results; all authors participated in reporting and evaluating the results. PLR and AFM wrote the first draft of the manuscript and all authors contributed to subsequent writing. All authors approved the current version of the manuscript.
Ethics approval and consent to participate
The study protocol was reviewed by the ethics committee for Life Sciences and Health of the University of Minho (REF: SECVS-084/2013) and was conducted in accordance with the principles of the Declaration of Helsinki. Written informed consent was obtained from individuals that agreed to participate in face-to-face interviews. The study was registered with the Portuguese data protection authority with the reference 9936/ 2013 and received approval number 5982/2014.
Consent for publication
Not applicable.
Competing interests
The authors declare that they have no competing interests.
Publisher’s Note
Springer Nature remains neutral with regard to jurisdictional claims in published maps and institutional affiliations.
Author details
1Low Vision and Visual Rehabilitation Lab, Department and Center of Physics –Optometry and Vision Science, University of Minho, Braga, Portugal. 2Department of Medicine and Optometry, Linnaeus University, 39182 Kalmar, Sweden.3Centro de Investigação em Saúde Pública, Escola Nacional de Saúde Pública, Universidade NOVA de Lisboa, Lisbon, Portugal.4Department of Ophthalmology, Hospital de Braga, Braga, Portugal.5Department of Surgery and Physiology, Faculty of Medicine, University of Porto, Porto, Portugal.6Department of Ophthalmology, Centro Hospitalar São João, Porto, Portugal.
Received: 8 January 2018 Accepted: 17 August 2018
References
1. Tolonen H, Helakorpi S, Talala K, Helasoja V, Martelin T, Prattala R. 25-year trends and socio-demographic differences in response rates: Finnish adult health behaviour survey. Eur J Epidemiol. 2006;21(6):409–15.
2. Galea S, Tracy M. Participation rates in epidemiologic studies. Ann Epidemiol. 2007;17(9):643–53.
3. Moorman PG, Newman B, Millikan RC, Tse CK, Sandler DP. Participation rates in a case-control study: the impact of age, race,and race of interviewer. Ann Epidemiol. 1999;9(3):188–95.
4. Morton LM, Cahill J, Hartge P. Reporting participation in epidemiologic studies: a survey of practice. Am J Epidemiol. 2006;163(3):197–203. 5. Van Loon AJ, Tijhuis M, Picavet HS, Surtees PG, Ormel J. Survey non-response
in the Netherlands: effects on prevalence estimates and associations. Ann Epidemiol. 2003;13(2):105–10.
6. O'Neil MJ. Estimating the nonresponse BiasDue to refusals in telephone surveys. Public Opin Q. 1979;43(2):218–32.
7. Partin MR, Malone M, Winnett M, Slater J, Bar-Cohen A, Caplan L. The impact of survey nonresponse bias on conclusions drawn from a mammography intervention trial. J Clin Epidemiol. 2003;56(9):867–73. 8. Patel MX, Doku V, Tennakoon L. Challenges in recruitment of research
participants. Adv Psychiatr Treat. 2003;9(3):229–38.
9. Burg JA, Allred SL, Sapp JH 2nd. The potential for bias due to attrition in the National Exposure Registry: an examination of reasons for nonresponse, nonrespondent characteristics,and the response rate. Toxicol Ind Health. 1997;13(1):1–13.
10. Eagan TM, Eide GE, Gulsvik A, Bakke PS. Nonresponse in a community cohort study: predictors and consequences for exposure-disease associations. J Clin Epidemiol. 2002;55(8):775–81.
11. Wild TC, Cunningham J, Adlaf E. Nonresponse in a follow-up to a representative telephone survey of adult drinkers. J Stud Alcohol. 2001; 62(2):257–61.
12. Shahar E, Folsom AR, Jackson R. The effect of nonresponse on prevalence estimates for a referent population: insights from a population-based cohort study. Atherosclerosis risk in communities (ARIC) study investigators. Ann Epidemiol. 1996;6(6):498–506.
13. Slegers C, Zion D, Glass D, Kelsall H, Fritschi L, Brown N, Loff B. Why do people participate in epidemiological research? J Bioeth Inq. 2015;12(2): 227–37.
14. Edwards P, Roberts I, Clarke M, DiGuiseppi C, Pratap S, Wentz R, Kwan I. Increasing response rates to postal questionnaires: systematic review. BMJ (Clinical research ed). 2002;324(7347):1183.
15. Arfken CL, Balon R. Declining participation in research studies. Psychother Psychosom. 2011;80(6):325–8.
16. Lin IF, Schaeffer NC. Using survey participants to estimate the impact of nonparticipation. Public Opin Q. 1995;59(2):236–58.
17. Rahi JS, Manaras I, Tuomainen H, Lewando Hundt G. Health services experiences of parents of recently diagnosed visually impaired children. Br J Ophthalmol. 2005;89(2):213–8.
19. Marques AP, Macedo AF, Perelman J, Aguiar P, Rocha-Sousa A, Santana R. Diffusion of anti-VEGF injections in the Portuguese National Health System. BMJ Open. 2015;5(11):e009006.
20. Gordon K, Crewe J, Ramos P, Macedo A, Morgan W. Capture-recapture: a method for determining the prevalence of vision impairment in the population. Clin Exp Ophthalmol. 2017;45:98.
21. Marques AP, Macedo AF, Hernandez-Moreno L, Ramos PL, Butt T, Rubin G, Santana R. The use of informal care by people with vision impairment. PLoS One. 2018;13(6):e0198631.
22. Fitzgerald R, Fuller L. I hear you knocking but you Can't come in: the effects of reluctant respondents and refusers on sample survey estimates. Sociol Methods Res. 1982;11(1):3–32.
23. Frick KD, Kymes SM, Lee PP, Matchar DB, Pezzullo ML, Rein DB, Taylor HR. The cost of visual impairment: purposes, perspectives, and guidance. Invest Ophthalmol Vis Sci. 2010;51(4):1801–5.
24. Quan H, Li B, Couris CM, Fushimi K, Graham P, Hider P, Januel JM, Sundararajan V. Updating and validating the Charlson comorbidity index and score for risk adjustment in hospital discharge abstracts using data from 6 countries. Am J Epidemiol. 2011;173(6):676–82.
25. Portugal - Census2011 [http://censos.ine.pt/xportal/xmain?xpid= CENSOS&xpgid=censos_quadros_populacao].
26. O'Brien RM. A caution regarding rules of thumb for variance inflation factors. Qual Quan. 2007;41(5):673–90.
27. Correia SDP, Rolo F, Lunet N. Sampling procedures and sample representativeness in a national telephone survey: a Portuguese example. Int J Public Health. 2010;55(4):261–9.
28. Kypri K, Samaranayaka A, Connor J, Langley JD, Maclennan B. Non-response bias in a web-based health behaviour survey of New Zealand tertiary students. Prev Med. 2011;53(4–5):274–7.
29. Senra H, Barbosa F, Ferreira P, Vieira CR, Perrin PB, Rogers H, Rivera D, Leal I. Psychologic adjustment to irreversible vision loss in adults: a systematic review. Ophthalmol. 2015;122(4):851–61.
30. Senra H, Oliveira RA, Leal I. From self-awareness to self-identification with visual impairment: a qualitative study with working age adults at a rehabilitation setting. Clin Rehabil. 2011;25(12):1140–51. 31. Brogger J, Bakke P, Eide GE, Gulsvik A. Contribution of follow-up of
nonresponders to prevalence and risk estimates: a Norwegian respiratory health survey. Am J Epidemiol. 2003;157(6):558–66.
32. Voigt LF, Koepsell TD, Daling JR. Characteristics of telephone survey respondents according to willingness to participate. Am J Epidemiol. 2003; 157(1):66–73.
33. Friedman EM, Clusen NA, Hartzell M. Better late: Characteristics of late respondents to a health care survey. ASA Proc Jt Stat Meet. 2003:992–8. 34. Stinchcombe AL, Jones C, Sheatsley P. Nonresponse bias for attitude
questions. Public Opin Q. 1981;45(3):359–75.