Caminhos de Geografia Uberlândia-MG v. 20, n. 80 Junho/2019 p. 448–461 Página 448 GEOMORPHOLOGICAL MAPPING AND LAND USE AND LAND COVER IN VALE DOS
VINHEDOS DESIGNATION OF ORIGIN - RIO GRANDE DO SUL STATE, BRAZIL BY GEOTECHNOLOGIES
Jorge Antônio Viel Federal University of Rio Grande do Sul – UFRGS Post-Graduation in Remote Sensing, Porto Alegre, RS, Brazil ja-viel89@hotmail.com Kátia Kellem da Rosa Federal University of Rio Grande do Sul – UFRGS
Geography Department, Porto Alegre, RS, Brazil
katiakellem@gmail.com
Rosemary Hoff Embrapa Grape and Wine Laboratory of Remote Sensing and Geoprocessing Sensoriamento Remoto, Bento Gonçalves, RS, Brazilrose.hoff@embrapa.br Nina Simone Vilaverde Moura Federal University of Rio Grande do Sul – UFRGS Geography Department, Porto Alegre, RS, Brazil
moura@ufrgs.br
ABSTRACT
The objective of this study was to investigate the land use and land cover patterns in the region Vale dos Vinhedos designation of origin and to relate them to the geomorphological mapping aiming to contribute to the implementation, monitoring and management of the areas intended to Geographical Indications for wines and sparkling wines. For this purpose, the geomorphology and the classes of land cover and land use were mapped. Both mappings were carried out using geotechnologies techniques. The shape pattern similar to high Hills is the most representative in the study area, occupying 77.13%. In the mapping of land use and land cover, the most representative class is forests (native or not), occupying 36% of the study area. The intersection between of the geomorphological mapping with land use and land cover classes resulted in the identification of morpho-environmental units.
Keywords: Geographical indications. Space occupation. Management of the areas. Vineyards.
MAPEAMENTO GEOMORFOLÓGICO E DE USO E COBERTURA DA TERRA POR MEIO DE SENSORIAMENTO REMOTO E
GEOPROCESSAMENTO RESUMO
O objetivo deste estudo foi investigar os padrões de uso e cobertura da terra na região da denominação de origem Vale dos Vinhedos e relaciona-los com o mapeamento geomorfológico, visando contribuir para a implantação, monitoramento e gestão das áreas de indicações geográficas para vinhos e espumantes. Para esse estudo, mapeou-se a geomorfologia e as classes de uso e cobertura da terra. Ambos os mapeamentos foram realizados utilizando técnicas de sensoriamento remoto e geoprocessamento. O padrão de relevo em forma de morros, na área de estudo, possui maior representatividade, ocupando 77,13% da mesma. No mapeamento de uso e cobertura da terra a classe Floresta (nativa ou não) ocupou cerca de 36% da mesma. O cruzamento entre o mapeamento geomorfológico e as classes de uso cobertura da terra permitiu identificar 35 classes de unidades morfoambientais.
Palavras-chave: Indicações geográficas. Ocupação do espaço. Gerenciamento de áreas. Vinhedos.
Caminhos de Geografia Uberlândia-MG v. 20, n. 80 Junho/2019 p. 448–449 Página 449 INTRODUCTION
The understanding of space occupation involves the comprehension of the physical and social variables that occur in a given area. In this way, geomorphology, integrated with the land use and land cover patterns, provides a better understanding of the dynamics of occupation and evolution of the geographical space. It should be noted that the tool framework provided by geotechnologies enables the mapping to be more accurate and quicker, reducing the operational cost of projects. Geomorphological studies and land use and land cover mapping are continually improved by several experts worldwide, a fact that received contribution from the development of geotechnologies such as Remote Sensing and Geographical Information System (GIS). The development of analysis tools in addition to the improvement of the techniques and representation tools of the phenomena enable the representation of the genesis of landforms, and also, the dynamics of space occupation and its relations with the structure and processes (ROBAINA et al., 2010).
Digital Elevation Models (DEMs) enables the definition of morphometric parameters of the relief, in this way reducing the subjectivity of the geomorphological mappings. Therefore, "the technological advances of new remote sensors, [...] allow geomorphologists to map, measure and study a variety of geomorphological phenomena more quickly and accurately." (FLORENZANO 2008, 33-34). Thus, the most recent studies of geomorphological cartography have included the digital analysis of the relief based on DEMs and the automation of the classification process of relief forms (TINÓS 2016, 67).
Automated geomorphological mappings are produced as an attempt to reduce their subjectivity. The precision of the delimitation of relief units depends greatly on the experience of the photo interpreter, showing a high degree of subjectivity in the mappings (TINÓS 2016, 67). A study carried out by Van Westen (1993) pointed out that in a geomorphological mapping performed by volunteer interpreters through photointerpretation, only 10% of the area was classified as being the same geomorphological unit by the photo interpreters.
This work intends to investigated the land use and land cover classes of the Vale dos Vinhedos designation of origen (DO) for quality wines and relate them to the geomorphological mapping in order to contribute to the implementation, monitoring and management of areas destined to Geographical Indications (GIs) for quality wines.
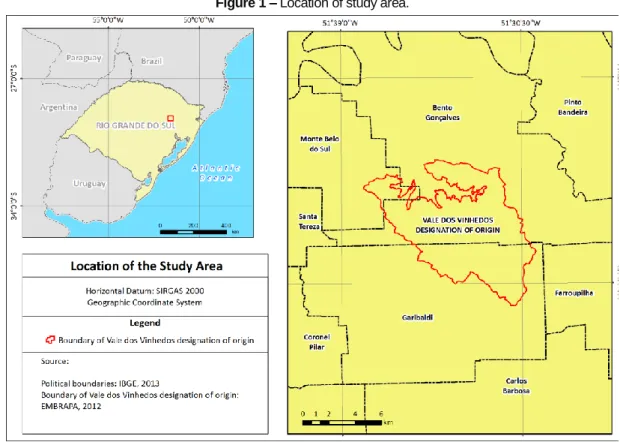
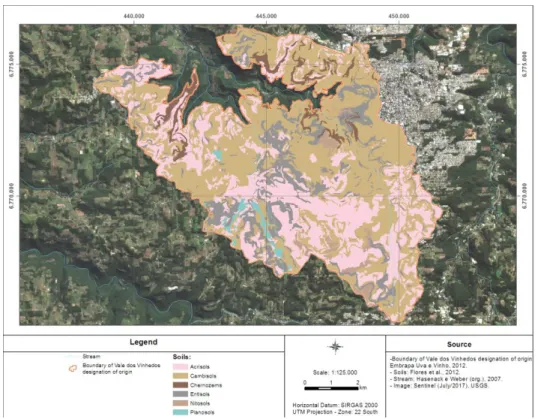
The Vale dos Vinhedos DO region for quality wines is located in the northeastern portion of Rio Grande do Sul State, covering a part of the municipalities of Bento Gonçalves, Garibaldi and Monte Belo do Sul (Figure 1). The geographical area of the DO for quality wines totals 72.45 km² (TONIETTO et al., 2013).
The wine industry based in this region, known as "Serra Gaúcha" and colonized in the late nineteenth century, mainly by Italian immigrants, is an important source of income. Ecotourism and wine tourism are on the rise. In the northeast of Rio Grande do Sul, in the region of Serra Gaúcha, was where the grape and wine production had its highest growth, with economic importance for thousands of producers (FALCADE 2011, 25-26).
The study area is in the Taquari-Antas Hydrographic Basin, which is located in the Atlantic Forest Biome, with fragments of preserved vegetation due to a descending slope in some areas, making agricultural practices impossible. The vegetation cover on the hillsides consists of deciduous seasonal forest and the tops of the hills are covered with mixed ombrophilous forest. The region has a Cfb climate, it is characterized by well defined seasons of the year with mild summer and evenly distributed rains, according to Koppen classification. Based on data from the meteorological station located at Embrapa Grape and Wine, the climate normals in the municipality of Bento Gonçalves (RS) show an average annual temperature of 17.8 ºC and average annual rainfall of 1889 mm. The geology of the study area is part of the São Bento Group, Serra Geral formation, and its highest altitudes have acid rocks such as Riodacitos and Riolitos and in the lowest altitudes, basic rocks such as Basalt are found. The Serra Geral is formed by a succession of fissural spills that occurred during the Lower Cretaceous period of the Mesozoic era (248.2 to 65 million years ago). The study area has the Paraná Sedimentary Basin as the morphostructure and the Southern Plateau as the morphosculture (SUERTEGARAY and FUJIMOTO, 2004). The hydrography flows into V-shaped
Caminhos de Geografia Uberlândia-MG v. 20, n. 80 Junho/2019 p. 448–450 Página 450 valleys over failures. The landform consists of V-shaped valleys and corrugated tops, presenting diverse topography with relative altimetric gradient varying from 376 to 724 meters. The lithologies more resistant to the dissecting processes work as water dividers.
Figure 1 – Location of study area.
DATA AND METHODS
The steps developed for the progress of the work included: a) identification of land use and land cover classes, b) geomorphological mapping, and c) intersection between geomorphological map with land use and land cover maps. The data collected had the system of coordinate systems and references standardized, and the SIRGAS 2000 reference system was chosen as it is the official reference system in Brazil and the Universal Transverse Mercator plane coordinate system (UTM). This work was carried out using a DEM with a spatial resolution of 5 meters and vertical accuracy of 50 centimeters. The DEM was generated from the interpolation of the contour lines, made available by Embrapa Grape and Wine, through an Irregular Triangular Network (TIN). The final result of the interpolation was converted into a matrix format, thus generating a DEM the same spatial resolution of the original data with 1:5000 scale.
The generation of the land cover and land use map was based on an image from the multispectral instrument (MSI) - Sentinel-2A satellite, acquired on July 27, 2017. The MSI has 13 spectral bands, and this work used three bands in the visible region (Blue 490 nm - Green 560 nm and Red 665 nm) and one band of the infrared region (NIR 842 nm), with a spatial resolution of 10 meters. The radiometric resolution is 12 bits. It was obtained free of charge from the Earth Explorer site, which had already been orthorectified (MSI level 1-C). Georeferenced polygons of the vineyards (Mello et al., 2017) were also used, with data generated by Vineyard Register and supplied by Embrapa Grape and Wine with the information of the vineyards. The soil mapping (Flores et al. 2012) was used to obtain the soil data, where the authors performed a detailed soil scale mapping of 1:10,000 for the Vale dos Vinhedos DO region.
The SPRING software version 5.5.1 (CÂMARA et al., 1996) was used for mapping the land cover and the land use. This program was made available free of charge by the National Institute for
Caminhos de Geografia Uberlândia-MG v. 20, n. 80 Junho/2019 p. 448–451 Página 451 Space Research (INPE). The classification by region was chosen not only because of the spectral response of the targets but also because it uses the object shape pattern.
The algorithm for regions growth was used as a segmenter in the SPRING software. This algorithm groups adjacent regions by similarity threshold and an area threshold, applying hypothesis tests using the average as a parameter (Câmara et al., 1996). Based on studies such as Dalla Corte et al. (2008) and Oliveira and Mataveli (2013), in addition to tests carried out in the study area, the value of 30 was defined for the similarity threshold and 50 for the area threshold.
The mapping of land cover and land use was divided into 6 classes: a) Espalier Vineyards, b) Trellis Vineyards, c) Water bodies, d) Agricultural land e) Urban or built-up land, f) Forests (native or not), g) Exposed soil. The composition of bands 4 (red), 8 (infrared) and 3 (green) was used to classify the image. This composition allowed for a better identification of the targets present in the study area. The Battacharya classifier was used for the classification, also available in the SPRING software. For the Trellis Vineyard and Espalier Vineyard classes, a mask with the polygons of the georeferenced vineyards was created. The mask enabled to exclude them from the classification process avoiding errors in land use and land cover mapping.
The mapping of the pattern with similar relief shape followed the methodology proposed by Hammond (1954, 1964) and improved by Dikau et al. (1991), Morgan and Lesh (2005), Tinós et al. (2014) and Tinós (2016). The methodology developed by Hammond (1954, 1964) seeks to reduce the subjectivity of the geomorphological mapping of parameters that can be quantified and measured. It is based on three parameters the slope, range and profile of the relief. The methodology is based on moving windows and their size depends on the spatial resolution of the DEM and the scale of the study
A tool developed and made available by Tinós et al. (2014) and Tinós (2016) was used for the geomorphological mapping. This tool, developed by the above-mentioned author to be used in ArcGis software, combines the following tools: Slope, Reclassify, Focal Statistic, Raster Calculator, Majority Filter, Region Group, Nibble and Raster to Polygon in the Modelbuilder interface.
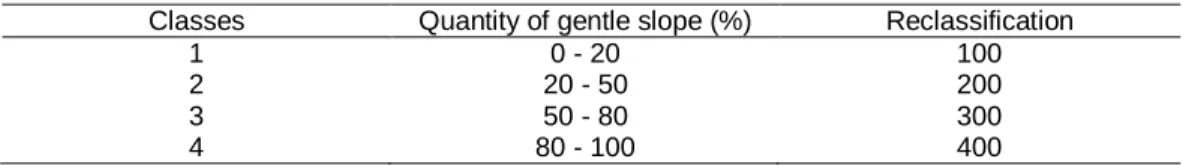
Several moving windows were tested, and a 150X150 pixels moving window showed the best result. The tool uses the DEM chosen to develop the work as input data, the slope in percentage is generated from the model, after that the slope is divided into two classes: the first class <8% and the second class > 8%. Then, using the moving window, the amount of gentle slope, i.e. less than 8% in its surroundings, is calculated for each pixel. Next, the gentle slope map is reclassified into four classes (Table 1).
Table 1 – Distribution of the slopes classes proposed by Hammond (1954, 1964). Classes Quantity of gentle slope (%) Reclassification
1 0 - 20 100
2 20 - 50 200
3 50 - 80 300
4 80 - 100 400
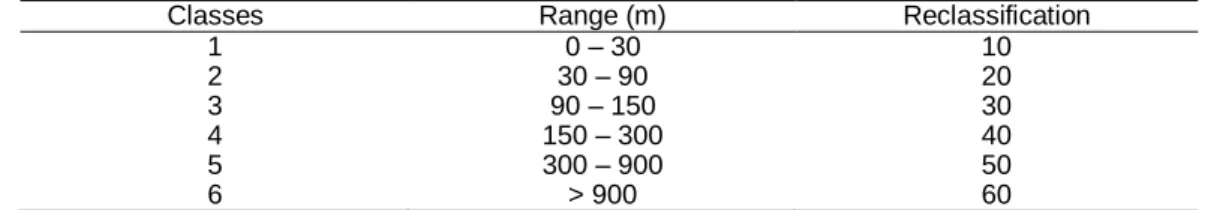
The local relief range is obtained by calculating the maximum and minimum elevation for each pixel, based on the moving window. After, the minimum is subtracted from the maximum and the result is re-classified into six classes (Table 2).
The relief profile is calculated based on the high and low terrains. According to Hammond (1954), high terrains are defined as areas where the maximum elevation within the moving window, minus the elevation of the central point of the window is smaller than half of the amplitude. According to the same author, low terrains are defined as areas where the maximum elevation within the window, minus the elevation of the central point of the window is greater than half the amplitude. After that, the percentage of the gentle slope is calculated, that is, less than 8% for low and high terrains. In Table 3, we can observe the distribution of the relief profile classes determined by Hammond. The sum of the variables slope, local relief amplitude and relief profile results in the identification of relief classes. Finally, the features identified in only three categories were listed: High Hill, Hills and Flat terrains.
Caminhos de Geografia Uberlândia-MG v. 20, n. 80 Junho/2019 p. 448–452 Página 452 Table 2 – Classes of the local relief range proposed by Hammond (1954, 1964).
Classes Range (m) Reclassification
1 0 – 30 10 2 30 – 90 20 3 90 – 150 30 4 150 – 300 40 5 300 – 900 50 6 > 900 60
The analysis of the slope shape was carried out using computational techniques implemented in the ArcGis software based on methodologies created by Moore et al. (1991) and Zevenbergen and Thorne (1987). The methodologies created by the mentioned authors enable the analysis of the vertical curvature and the horizontal curvature of the slopes by means of a DEM.
Table 3 – Classes of the relief profile proposed by Hammond (1954, 1964).
Classes Relief profile Value
1 More than 75% of gentle
slope is in lowland. 1
2 Less than 75% of gentle
slope is in lowland. 2
3 More than 75% of gentle
slope is in upland. 3
4 More than 75% of gentle
slope is in upland. 4
The processing is performed through a 3x3 moving window using nine values of elevation. For vertical curvature the negative values indicate that the surface is convex, the positive values indicate that the surface is concave and the values equal to zero indicate that the surface is rectilinear. The production of the morpho-environmental units aimed the sum up the products developed in the geomorphological mapping phase with the land use and land cover, thus, a legend was developed to encompass the three products and enable its use by the agents in charge of making decisions, as well as for society in general. The ArcGis software and the Raster Calculator function were used for summing up the data, and a numerical code was designated for the classes of the geomorphological mapping and for the land use and land cover classes.
The Kappa coefficient was used to validate the mappings. According to Antunes and Lingnau (1997, 10) "the Kappa coefficient incorporates all elements of the error matrix instead of only those that are located in the main diagonal elements, that is, it estimates the sum of the marginal column and line". According to these authors, the error matrix briefly presents the results of digital classification or photointerpretation in relation to ground truth or reference image.
To obtain the Kappa coefficient of the mappings carried out in the study area, points obtained in the field were used as ground truth. The field work aimed to identify relief units and land cover and land use patterns. For this purpose, a Garmin Montana GPS device model 650 provided by Embrapa Grape and Wine was used. Coordinate points were collected for the geomorphological units and land cover and land use classes, which were later compared with the results obtained in the mappings done automatically, generating the error matrix and the calculation of the Kappa coefficient.
RESULTS AND DISCUSSION
The object-oriented classification technique has proven to be an effective tool in the classification of land use and land cover, helping to identify and distinguish small areas. The value of 0.74 was obtaining from the Kappa concordance index, according to the categorization proposed by Landis and Koch (1977). This value shows a strong correlation between what was mapped automatically and what was identified in the field.
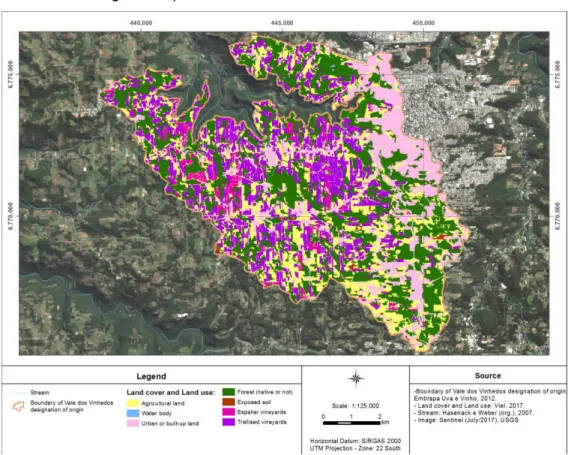
Caminhos de Geografia Uberlândia-MG v. 20, n. 80 Junho/2019 p. 448–453 Página 453 To obtain the Kappa index, 60 randomly distributed sample points were collected in the study area. No points referring to the Espalier Vineyards and the Trellis Vineyards were collected, because this data was used as a mask, excluding the vineyards from the automated classification process. Table 4 shows the amount of area occupied for land use and land cover classes. All classes proposed in the methodology were identified in the Vale dos Vinhedos DO region. The spatial distribution of land use and land cover classes can be seen in Figure 2.
Table 4 – Area of the classes of land cover and land use in Vale dos Vinhedos designation of origin.
Classe Area (km²) Percent
Agricultural land 16,23 22
Urban or built-up land 12,44 17
Water bodies 0,07 0,1
Forest (native or not) 25,76 36
Exposed soil 0,30 0,4
Espalier Vineyards 2,43 3,5
Trellis Vineyards 15,22 21
Total 72,45 100
There is a predominance of the Forest class (native or not) in areas with steeper slopes. Sloping areas hinder the development of agriculture and contribute to the preservation of forested areas. The Water Bodies class is represented by small dams used for water storage and fish farming without commercial purposes. The study area contains small streams, but due to a small surface area, they were not taken into consideration in the automated mapping process.
Figure 2 – Spatial distribution of land cover and land use classes.
By morphometric indexes and Geoprocessing techniques, a pattern with similar forms of High Hills, Hills and Flat Terrain was identified in the study area. The Kappa concordance index was used for the validation of the geomorphological mapping, in which the value obtained was 0.7. According to the categorization established by Landis and Koch (1977), this value demonstrates a strong correlation between what was mapped automatically and what was identified in the field. To obtain
Caminhos de Geografia Uberlândia-MG v. 20, n. 80 Junho/2019 p. 448–454 Página 454 the Kappa index, 60 sample points were collected during fieldwork. The points were classified into High Hills, Hills and Flat Terrain, which were compared with the mapping carried out with an automated system.
The Urban or Built-up Land is increasing in the Vale dos Vinhedos DO region. Further growth can be observed along the main access roads to Vale dos Vinhedos, for example, RS 444 and BR 470. It should be noted that part of the urban area of the municipality of Bento Gonçalves is located in the Vale dos Vinhedos DO region. The Exposed Soil class is related to areas of soil preparation for agricultural use or for implementing urban infrastructure. The Trellis Vineyards and the Espalier Vineyard classes occupy areas with gentle to moderate slopes, however, that some areas with vineyards are located in portions that have steep slopes. The streams that drain the Vale dos Vinhedos DO region are anthropized, and all the land use and land cover described above are found along their margins.
The identification of the patterns of similar forms in the Vale dos Vinhedos DO region enables the investigation of the processes involved in the landforms. The processes are herein understood as fluvial, continental, wind and human action, the latter, accelerating and generating geomorphological processes (MOURA and DIAS, 2012). In Figure 3, the distribution of the pattern classes of similar forms are identified in the study area.
The pattern in the form of hills represents 22.33% of the study area, occupying an area of 16.18 km². Formed by volcanic acid rocks like Riodacitos and Riolitos of the Cretaceous period, associated with moderate slopes and low altimetric gradients. By topographic profiles and field observations, it was detected that the valleys have medium interfluves.
The concave slopes are predominant, occupying 88.01%, followed by convex and rectilinear sectors, which occupy 9.58% and 2.41%, respectively. The convex and rectilinear sectors are generally associated with the tops since they have already been smoothed due to the denudation process (Figure 3).
Figure 3 – Spatial distribution of landforms.
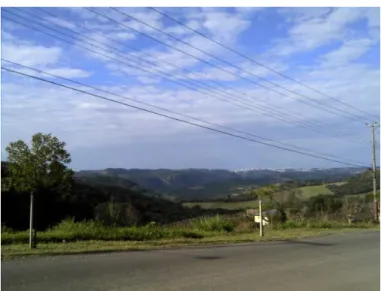
Argisol is the predominant type of soil, occupying 44.93%, followed by Cambisol, which occupies 41.14%. The two classes of soils represent together 86.07% (Figure 4). The areas with Argisols are associated with colluvial deposits at the base of the landforms, receiving material not only from the hill pattern but also from the high hill pattern. Cambisols are associated with tops and hillsides, where the smaller sediment deposition can be transported easily. Figure 5 shows an image of the area classified as the pattern in hill form.
Caminhos de Geografia Uberlândia-MG v. 20, n. 80 Junho/2019 p. 448–455 Página 455 Figure 4 – Spatial distribution of soils in study area.
The pattern in high hill form represents 77,13% of the Vale dos Vinhedos DO region, occupying an area of 55.88 km², formed by acid and basic volcanic rocks of the Cretaceous period. Acid rocks, such as Riodacitos and Riolitos, are located at elevations of more than 400 meters. Basic rocks, such as basalt, are located at elevations of less than 400 meters. In the pattern in hill form, basic rocks can be found in the northwest portion of the study area where the smallest elevations are located, which are associated with the bottom of the valleys.
Figure 5 – Area classified as pattern in Hill form.
Source – Jorge A. Viel (2017).
The concave slopes are predominant and occupy 83.75%, followed by the convex and rectilinear slopes, which occupy 15.18% and 1.07% respectively. The interfluvial distance is smaller,
Caminhos de Geografia Uberlândia-MG v. 20, n. 80 Junho/2019 p. 448–456 Página 456 consequently, valleys show greater carving, having a V shape. The streams that drain the pattern in high hill form developed on failures, which led to a higher degree of carving. The streams have some rapids and small waterfalls, a fact showing that the relief represents the areas of drainage headlands.
Cambisol is the predominant soil occupying 50.48%, followed by the Argisol, which occupies 26.98% and by the Neosol occupying 15.22% (Figure 4). The three classes of soils together represent 92.68% of the pattern in the hill form. The areas with Argisol are less expressive, since the slope and the altimetric gradient increased, causing the deposit areas of sediments to be smaller. Cambisol soils are predominant because they are associated with tops and hillsides, where sediment deposition is smaller and they can be transported easily, reducing the chance of formation of B horizon or having an incipient B horizon. Figure 6 shows an image of the area classified as the pattern in the high hill form.
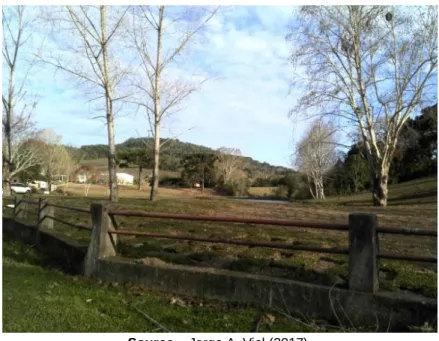
Figure 6 – Areas classified as pattern in the High hill form.
Source – Jorge A. Viel (2017).
The relief pattern in the form of flat terrain represents 0.54% of the study area, occupying an area of 0.39 km², formed by volcanic acid rocks like Riodacitos and Riolitos of the Cretaceous period. It is associated with gentle slopes and low altimetric gradients. The concave slopes are predominant, occupying 84.53%, followed by the rectilinear slopes, which occupy 14.58%. The convex slopes are not very expressive, occupying only 0.89%.
Cambisols and the Argisols are predominant, occupying 54.44% and 42.02% (Figure 4), respectively of the pattern in the form of flatlands, together representing 96.46%. The presence of the Cambisols can be explained as some areas identified as the pattern in the form of flat lands are located on the tops. Figure 7 shows an image of the area classified as the pattern in the form of flat soils.
The relationship between land use and land cover data in the study area shows that geomorphology is relevant for the determination of the wine quality and is, therefore, an important parameter of analysis and inclusion in the delimitations of geographical indication areas for quality wines, as well as for sustainable production, which is becoming increasingly valued by tourists and consumers. Works developed by Pupnik et al. (2016), Şandru (2015) and Vaudour et al. (2010) demonstrated
Caminhos de Geografia Uberlândia-MG v. 20, n. 80 Junho/2019 p. 448–457 Página 457 the influence of geomorphology on the quality of the grapes, as well as on the determination of terroirs.
The multi-criteria analysis of Geovitícola climate (TONIETTO et al., 2012) is another example of the importance and degree of interaction between the relief and vineyards. This analysis enables the determination of the climatic potential of a given region for the development of viticulture. For this purpose, three indexes are used: heliothermic index, the cool night index and the dryness index. The three indexes are related to the position of the vineyard on the slope.
The areas with vineyards must comply with the erosion cycles, which occur naturally but are intensified by anthropic action, in addition to complying with other prerogatives already existing in environmental law, such as preserving riparian forests, preserving areas with springs, not occupying land with steep slopes, to preserve the tops of the hills. These measures, among others, help to preserve the stability of the relief.
Figure 7 – In the foreground area classified as pattern in the form of flat ground.
Source – Jorge A. Viel (2017).
The integration of land use and land cover data allowed to relate the uses to the balance of morphogenetic and morphodynamic processes, the morphogenetic processes are related to the processes of formation of structures and landforms. However, the morphodynamic processes are connected to the current transformations of landforms. Therefore, land cover and land use are directly associated to the environmental morphodynamic. In addition to relating to the indexes that are important for the determination of wine quality and also the environmental quality of the study area aiming its sustainable development. It also enabled the identification of 35 classes of mapping (Table 5). The map generated in a 1: 25,000 scale is available at https://goo.gl/4aVsCV link.
Analyzing Table 5, it can be inferred that the most abundant class is the Pattern in the hill form with the concave slope having forest cover and use (261), occupying 24.41% of the study area. Field work has shown that the areas with hills are the ones with the least stability in relation to the evolutionary processes of the relief. The concave slopes are conducive to linear flows thus favoring the occurrence of ravines and gullies. The forest cover provides protection and greater stability for the relief, decreasing surface runoff and increasing the time of water concentration in the watershed.
Caminhos de Geografia Uberlândia-MG v. 20, n. 80 Junho/2019 p. 448–458 Página 458 Table 5 – Integration of geomorphology with land cover and land use in Vale dos Vinhedos DO region.
Code Class Area (km²) Percent
112 Hills with convex surface and espalier vineyards 0,13 0,18 121 Hills with concave surface and trellised vineyards 2,83 3,91 123 Hills with flat surface and trellised vineyards 0,03 0,05 131 Hills with concave surface and water body 0,03 0,04 141 Hills with concave surface and agricultural land 4,22 5,82 142 Hills with convex surface and agricultural land 0,15 0,21 143 Hills with flat surface and agricultural land 0,06 0,08 151 Hills with concave surface and urban or built-up land 3,13 4,32 152 Hills with convex surface and urban or built-up land 0,24 0,33 153 Hills with flat surface and urban or built-up land 0,07 0,10 161 Hills with concave surface and forest (native or not) 4,56 6,30 162 Hills with convex surface and forest (native or not) 0,53 0,73 163 Hills with flat surface and forest (native or not) 0,02 0,02 171 Hills with concave surface and exposed soil 0,09 0,13 172 Hills with convex surface and exposed soil 0,01 0,01 173 Hills with flat surface and exposed soil 0,01 0,01 213 High hills with flat surface and espalier vineyards 0,02 0,02 221 High hills with concave surface and trellised
vineyards 15,08 20,81
222 High hills with convex surface and trellised vineyards 1,03 1,43 231 High hills with concave surface and water body 0,02 0,02 241 High hills with concave surface and agricultural
land 8,67 11,96
242 High hills with convex surface and agricultural
land 0,88 1,22
243 High hills with flat surface and agricultural land 0,07 0,10 251 High hills with concave surface and urban or built-up land 4,20 5,79 252 High hills with convex surface and urban or
built-up land 4,34 5,99
253 High hills with flat surface and urban or built-up land 0,04 0,05 261 High hills with concave surface and forest (native
or not) 17,68 24,41
262 High hills with convex surface and forest (native or not) 3,70 5,11 263 High hills with flat surface and forest (native or not) 0,09 0,13 271 High hills with concave surface and exposed soil 0,13 0,18 272 High hills with convex surface and exposed soil 0,001 0,00 341 Ground plains with low relief concave surface and agricultural land 0,04 0,05 351 Ground plains with low relief concave surface and urban or built-up land 0,27 0,37 353 Ground plains with low relief flat surface and
urban or built-up land 0,04 0,05
361 Ground plains with low relief concave surface and forest (native or not) 0,03 0,05
Caminhos de Geografia Uberlândia-MG v. 20, n. 80 Junho/2019 p. 448–459 Página 459 The Pattern in hill form class with the concave slope with land use for trellis vineyards (221) is the second most abundant, occupying 20.81% of the study area. It has the same processes with respect to the relief of the class mentioned above, but its use deserves relative attention, mainly in the implantation of the vineyard, where the soil remains naked for a longer period. Trellis vineyards have a larger vegetative canopy, providing protection for the soil. In the dormancy period of the vineyard, extra attention is needed as the canopy leaves undergo senescence and fall. Thus, vegetation cover is necessary between rows to reduce the amount of soil loss and to avoid the negative effects of erosive processes.
The third class in representativeness in the study area is the Pattern in hill form with concave slope used for agriculture (241). It occupies 11.96% of the Vale dos Vinhedos DO. In hilly areas used for the development of agriculture, conservation practices should be adopted, especially in areas occupied by temporary crops.
The three classes together represent 57.18% of the study area. The other classes occupy smaller areas, but they are not of minor importance. The areas with the pattern in hills form and flat terrains are more stable in relation to the morphodynamic balance, but they continue to suffer the erosive processes. Areas with espalier vineyards should prioritize the permanence of vegetal cover between the rows since they have smaller vegetative canopies.
The urban areas and the waterproofing caused by their installation causes a reduction of the time the water is concentrated in the watershed and increase the speed of the flow, which can increase the risk of downpours and floods in the middle and lower course of the watersheds.
Sustainable development, a current term, depends on the harmonization between society and nature. Agriculture is constantly under pressure for new techniques to be developed and damages to the environment be minimized, thus producing larger quantities of food in smaller spaces, while reducing the number of chemical inputs dumped into the soil, water and air.
Integration between geomorphology and land cover and land use allows a holistic vision of the environmental relations and it shows the interdependence between the processes. Land cover and land use change demand a new balance in the system.
CONCLUSIONS
The geomorphological mapping using the methodology developed by Hammond (1954, 1964), as well as the tool provided by Tinós et al. (2014) were effective.
In the delimitations of areas of geographical indications destined to quality wines the geomorphology has relevance for the determination of the quality of the wines, and also for sustainable production, increasingly valued by tourists and consumers.
The integration of the relief data with the land use and land cover enabled to list the uses with the balance of the morphogenetic and morphodynamic processes, in addition to listing the indexes referring to the geoviticulture climate, which are important for the determination of the quality of the wines.
It is necessary to know, in a clear way, the processes involved in the land cover and land use of the space and the relation between the elements that compose the landscape. This will allow those responsible for the management, implementation, and monitoring of areas destined for GIS to have a stronger basis for decision making.
ACKNOWLEDGEMENT
The authors would like to thank Embrapa Grape and Wine, CAPES and Federal University of Rio Grande do Sul.
REFERENCES
Antunes, A. F. B. and C. Lingnau. Uso de índices de acurácia para avaliação de mapas temáticos obtidos por meio de classificação digital. In: III Congresso e Feira para Usuários
Caminhos de Geografia Uberlândia-MG v. 20, n. 80 Junho/2019 p. 448–460 Página 460 de Geoprocessamento, Curitiba, PR, Brasil. 1997.
Câmara, G., R. C. M. Souza, U. M. Freitas, J. Garrido and F. Mitsuo. Spring: integrating remote sensing and GIS by object-oriented data modeling. Computers & Graphics, v. 20. 1996. p.
395–403. https://doi.org/10.1016/0097-8493(96)00008-8
Dalla Corte, A. P., F. L Dlugosz and J. A. S Centeno. Testes de limiares para a segmentação de imagens Spot -5 visando a detecção de plantios florestais. Revista Acadêmica de Ciências Agrárias e Ambientais, v. 6. 2008. p. 249–257. Agrárias e Ambientais, v. 6. 2008. p. 249-257.
https://doi.org/10.7213/cienciaanimal.v6i2.10508
Dikau, R., E. E. Brabb and R. M. Mark. Landform Classification of New Mexico by Computer. v. 80225. 1991. p. 16. https://doi.org/10.3133/ofr91634
Hammond, E. H. Small-scale continental landform maps. Annals of the Association of American Geographers, v. 54. 1954. p. 32–42. https://doi.org/10.1080/00045605409352120
Hammond, E. H. Analysis of properties in landform geography: An application to broadscale landform mapping. Annals of the Association of American Geographers, v. 54. 1964. p. 11– 19. https://doi.org/10.1111/j.1467-8306.1964.tb00470.x
Falcade, I. A Paisagem Como Representação Espacial: A Paisagem Vitícola Como Símbolo Das Indicações De Procedência De Vinhos Das Regiões Vale Dos Vinhedos, Pinto Bandeira E Monte Belo (Brasil). Ph.D., Universidade Federal do Rio Grande do Sul. 2011. Florenzano, T. G., eds. Geomorfologia Conceitos e Temas Atuais. São Paulo city, 2008. Oficina de Textos press.
Flores, C. A., R. O Pöter, E. C. Sarmento, E. J. Weber and H. Hasenack. Os solos do Vale dos Vinhedos. Brasília city, 2012. Embrapa press.
Landis, J. R. and G. G. KOCH. The Measurement of Observer Agreement for Categorical Data. International Biometric Society, v. 33. 1977. p. 159–174. https://doi.org/10.2307/2529310
Mello, L. M. R. and C. A. E. de Machado. eds. Cadastro vitícola do Rio Grande do Sul: 2013 a 2015. 2017. Available in: >http://www.cnpuv.embrapa.br/cadastro-viticola/rs-2013-2015/home.html<. Accessed on: October 15th, 2016.
Moore, I. D., R. B. Grayson, and A. R. LADSON. Digital terrain modeling: A review of hydrological, geomorphological, and biological applications. Hydrological Processes, v. 5. 1991. p. 3–30. https://doi.org/10.1002/hyp.3360050103
Morgan, J. M. and A. M. Lesh. Developing Landform Maps Using Esri’s Modelbuilder. In:
Esri International User Conference. Redlands city, 2005.
Moura, N. S. V. and T. S. Dias. Elaboração do Mapa Geomorfológico do Município de Porto
Alegre. Ciência e Natura, v.34. 2012. p. 113–138. https://doi.org/10.5902/2179460X9345
Oliveira, B. S. and G. A. V. Mataveli. Avaliação do desenpenho dos classificadores Isoseg e Bhattacharya para o mapeamento de áreas de cana-de-açúcar no município de Barretos-SP. In: Anais XVI Simpósio Brasileiro de Sensoriamento Remoto. Foz do Iguaçu city, 2013. INPE press.
Pupnik, P. J., F. CUS, A. SMUC. Geomorphology and wine: The case of Malvasia in the Vipava
Valley, (Slovenia). Acta Geographica Slovenica, v. 56. 2016. p. 7–23.
Caminhos de Geografia Uberlândia-MG v. 20, n. 80 Junho/2019 p. 448–461 Página 461 Robaina, L. E. de S., R. Trentin, T. Bazzan, E. W. Reckziegel and R. Verdum. Compartimentação Geomorfológica Da Bacia Hidrográfica do Ibicuí, Rio Grande Do Sul, Brasil: Proposta De Classificação. Revista Brasileira de Geomorfologia, v. 11. 2010. p. 11–23.
https://doi.org/10.20502/rbg.v11i2.148
Șandru, D. M. The Influence of Geomorphology on the Sensorial Quality of Red Wines from the
Șarba wine region. Odobești Vineyard. v. 49. 2015. p. 44–49.
https://doi.org/10.18052/www.scipress.com/ILNS.49.44
Suertegaray, A. M. D. and M. V. S. N Fujimoto. Morfogênese do Relevo do Estado do Rio Grande do Sul. In: Verdun, R.; L. A. Basso and D. M. A. Suertegaray. eds. Rio Grande do Sul: Paisagens e Territórios em Transformação. Porto Alegre city, 2004. UFRGS press.
Tinós, T. M. Classificação automatizada do relevo a partir de parâmetros morfométricos. Ph.D. Universidade Estadual Paulista Júlio de Mesquita Filho. 2016.
Tinós, T. M., M. V. Ferreira, P. S. Riedel and J. E. Zaine. Aplicação e avaliação de metodologia de classificação automática de padrões de formas semelhantes do relevo. Revista Brasileira de Geomorfologia, v. 15. 2014. p. 353–370. https://doi.org/10.20502/rbg.v15i3.455
Tonietto, J., V. S. Ruiz and V. D. G. Miguel. Clima, Zonificación y Tipicidad del Vino En Regiones Vitivinícolas Iberoamericanas. Madrid city, 2012. CYTED press.
Tonietto, J., M. C. Zanus, I. Falcade and C. C. Guerra. O regulamento de uso da denominação de origem Vale dos Vinhedos: Vinhos finos tranquilos e espumantes. Bento Gonçalves city: Embrapa Uva Vinho press. 2013. Available in: >https://www.embrapa.br/busca- de-publicacoes/-/publicacao/971632/o-regulamento-de-uso-da-denominacao-de-origem-vale-dos-vinhedos-vinhos-finos-tranquilos-e-espumantes<. Accessed on: March 24th, 2017.
Van Westen, C. J. Application of geographic information systems to landslide hazard zonationInternational Institute for Aerospace Survey and Earth Sciences. Enschede International Institute for Aerospace Survey and Earth Sciences. 1993.
Vaudour, E., V. A. Carey and J. M. Gilliot. Digital zoning of South African viticultural terroirs using bootstrapped decision trees on morphometric data and multitemporal SPOT images. Remote Sensing of Environment, v. 114. 2010. p. 2940–2950.
https://doi.org/10.1016/j.rse.2010.08.001
Zevenbergen, L. W. and C. R. Thorne. Quantitative analysis of land surface topography. Earth Surface Processes and Landforms, v. 12. 1987. p. 47–56.
https://doi.org/10.1002/esp.3290120107
_________________________ Recebido em: 08/08/2018