1
Gas-phase dehydration of glycerol over thermally-stable
SAPO-40 catalyst
J. P. Lourenço1,*, A. Fernandes2, R. A. Bértolo2, M. F. Ribeiro2
(1) - CIQA – Centro de Investigação em Química do Algarve, Universidade do Algarve, Campus de Gambelas, 8005-139 Faro (Portugal)
Fax: (+351) 289 800 066, E-mail: [email protected]
(2) - IBB - Instituto de Biotecnologia e Bioengenharia, Instituto Superior Técnico Av. Rovisco Pais, 1049-001 Lisboa, Portugal
Abstract
SAPO-40 was used as catalyst for the gas-phase dehydration of glycerol towards acrolein. At 350 ºC the catalyst attained full conversion of glycerol with a negligible deactivation in the first 48 h, a glycerol conversion above 50 % after 120 h on stream and a nearly constant selectivity to acrolein above 70%. This catalyst proved to be highly resistant under the experimental conditions used and can be regenerated without loss of activity or significant structural damage. The comparison of SAPO-40 with SAPO-34 and SAPO-11 illustrates the importance of the porous structure and emphasizes the good catalytic performance of this material.
Keywords: Glycerol, Dehydration, Acrolein, SAPO-40, Sustainable chemistry
1. Introduction
In the last years there has been an increased demand of fuels and chemicals with less environmental impact than those obtained from fossil resources. Significant efforts have been made to use biomass to achieve this goal, with special focus on the biodiesel production. This biofuel is usually produced by transesterification of triglycerides from vegetable oils such as soybean, rapeseed, sunflower and
2 jatropha oils. This process gives rise to a significant amount of glycerol as a by-product. Although glycerol is used in several industries (cosmetics and pharmaceuticals, food additives, coatings), biodiesel production growth will lead to an accumulation of this compound in the near future. The transformation of glycerol into more valuable and versatile feedstocks is therefore of paramount importance to improve the efficiency and economics of the biodiesel manufacture1-3.
An attractive route for the conversion of glycerol is the acid-catalyzed dehydration to acrolein, which is an important intermediate in the production of acrylic acid, polyesters, superabsorber polymers and detergents1-5. Currently acrolein is produced by the oxidation of propylene over bismuth molybdate-based catalysts4; however its production from glycerol may become
economically appealing in the near future.
The selective dehydration of glycerol to acrolein has widely been investigated both in gas and liquid-phase2, with a great variety of catalysts. Nevertheless, conducting the reaction in the liquid-phase, frequently with acids, gives rise to a corrosive medium that makes difficult commercial implementation due to high equipment investments and maintenance costs, catalyst/reaction mixture separation and waste management2-7. Different types of catalysts have been tested in the dehydration of glycerol in gas-phase, including zeolites4,5-11, heteropolyacids4,12-14 metal oxides 4,15-17 and modified mesoporous SBA-15 materials18. This reaction is particularly dependent on the
textural and acidic properties of the catalysts. It is generally accepted that the presence of large pores in the catalyst or catalyst support decreases the constraints to the mass transfer and increase the catalytic performance4,12,18, although interesting results have also been reported with medium pore zeolites such as ZSM-58,9. The main products from the glycerol dehydration over acid catalysts,
acrolein and acetol, depend on the nature and strength of the acid sites9,19. The formation of acrolein is favorable over medium to strong acid sites, however the strongest acid sites also promote the formation of coke more effectively, which may lead to a faster deactivation of the catalyst19.
Raw glycerol usually contains water. Thus, to avoid an expensive drying process, it is advantageous to use an acidic catalyst with a high water tolerance, in order to maintain the structural integrity for
3 a longer time in reaction conditions and eventually during a regeneration procedure.
Silicoaluminosphosphate (SAPO) family comprises a great variety of structures, usually with mild acidity and variable thermal and hydrothermal stability. SAPO-34, with a cage-like structure with 8- membered ring openings (3.8 Å) and SAPO-40, with a large pore structure involving interconnected 12-membered (6.7 Å) and 8-membered ring (3.7 Å) channels, proved to be highly resistant to thermal and hydrothermal treatments20-22. Due to the structure properties and the weak to mild acid strength, SAPO-34 has been intensively studied in the dehydration of methanol and is the catalyst in the UOP/Hydro MTO process23. SAPO-11, with a 10-membered ring (6.5 x 4.0 Å) channels structure is another material of the SAPO family that has found commercial application as catalyst in the Chevron Isodewaxing process24. W. Suprun et al.25 tested a sample of SAPO-11 and a sample of SAPO-34 in the dehydration of glycerol and found that SAPO-34 is more prone to deactivate than SAPO-11 due to the different pores structure and acidity. In the conditions used, both catalysts showed a significant deactivation rate and a very high selectivity to acetol with increasing time on stream.
In this work, the catalytic performances of SAPO-40 towards the glycerol dehydration is evaluated and compared with the small pore SAPO-34 and medium pore SAPO-11 catalysts.
2. Experimental
2.1. Synthesis of catalysts
SAPO-40 was synthetized according to N. Dumont et al.26 using pseudobohemite (Pural SB) as aluminium source, fumed silica (Cab-OSil M5, Fluka) as silicon source, ortho-phosphoric acid (85% Merck) as phosphorus source and tetrapropylammonium hydroxide (40% aq. sol., Alfa) as templating agent. The final gel with a molar composition of 0.93Al2O3/0.93P2O5/0.65SiO2/2TPAOH/74H2O was submitted to a hydrothermal treatment at 200
ºC during 144 h.
4 were used as received: alumina (Pural SB), ortho-phosphoric acid (Merck, 85 wt. % aq. solution), silica (Degussa, Aerosil A380), methylamine (Fluka, 41 wt. % aq. solution) and tetraethylammonium hydroxide (Alfa 40 wt.% aq. solution). The final gel with a molar composition of Al2O3/P2O5/SiO2/TEAOH/0.6MA/40H2O was submitted to a hydrothermal treatment at 170 ºC
during 24 h.
SAPO-11 used in this study is from the same batch of that published by Bértolo et al.28, who used alumina (Pural SB), ortho-phosphoric acid (Merck 85 wt.% aq. solution), silica (Ludox AS40), MA (Fluka 41 wt.% aq. solution) and dipropylamine (Aldrich, 99 wt.% aq. solution) as reagents. The gel with a final molar composition of Al2O3/P2O5/0.4SiO2/1.5DPA/50H2O was then submitted to a
hydrothermal treatment at 200 ºC for 24 h.
2.2 Characterization
The structure type and crystallinity of all the samples were checked by powder X-ray diffraction on a Panalytical X’Pert Pro diffractometer using Cu K radiation filtered by Ni and an X’Celerator detector. 29Si MAS NMR spectra were recorded on a Bruker Avance 400 at 79.5 MHz, using 40 º pulses, a spinning rate of 5.5 kHz and a recycle delay of 12 s. SEM micrographs were obtained on a JEOL JSM-7001F equipment. Chemical composition of the various samples was determined by elemental chemical analysis (ICP for Al and P and AAS for Si). Pyridine (Py) adsorption was followed by FTIR spectroscopy using a home-made Quartz cell allowing sample vacuum and temperature pretreatment and subsequent Py adsorption at 150 ºC. Quantitative measurements were done as described elsewhere28. The results are listed in table 1. Thermogravimetric data (TG) were obtained with a TG92 Setaram apparatus. Nitrogen sorption experiments were performed using an ASAP 2010 series equipment from Micromeritics. Prior to measurements, samples were outgassed first at 90 and then at 350 ºC, during 1 and 4 hours, respectively.
5
% Se l i ng i ,t
ng total ng t 100
Table 1. Chemical composition, pyridine quantification and textural parameters of SAPO samples.
Sample Chemical composition
(TO2)
Acid sites (μmol.g-1) Textural properties
Lewis Brönsted ABET
(m2.g-1) Vmicrop.b (cm3.g-1) SAPO-40 (Si0.12Al0.47P0.41)O2 56 280 670 0,27 SAPO-11 (Si0.06Al0.50P0.44)O2 49 a 46 a 210 0,07 SAPO-34 (Si0.17Al0.48P0.35)O2 nd nd 640 0,27 a – as determined in ref. 28.
b – determined by t-plot method nd- not determined
2.3. Catalytic tests
The dehydration of glycerol was performed at different temperatures in the range 320-380 ºC under atmospheric pressure, in a fixed-bed vertical quartz reactor (1.5 cm i.d.) using 300 mg of catalyst. The temperature was controlled by a thermocouple placed near the catalyst bed. Before each test, the catalyst was heated at 500 °C under a flux of dry nitrogen (30 mL min−1) and kept during 2 h. The reaction feed, an aqueous solution containing 10, 30 or 50 wt.% of glycerol, was introduced in the reactor by a syringe pump KD Scientific at variable WHSV (0.85-4.69 h-1) and diluted in a flow of dry nitrogen (30 mL min−1). The reaction products were collected in a NaCl/ice trap followed by two additional water traps. Reaction products were analyzed on a Chrompack CP2001 gas chromatograph equipped with a 25 m OPTIMA FFAP Macherey Nagel capillary column and a FID detector. For quantitative measurements 1-propanol (for low boiling point products) and 1,4-butanediol (for glycerol) were used as internal standards.
The conversion and selectivity were calculated as follows:
% Conv. ngt ot al ngt
ngtotal
6 where ngtotal is the total number of moles of glycerol injected into the reactor during the time on
stream t, ngt the number of moles of glycerol in the products recovered at time on stream t and ngi,t
the number of moles of glycerol converted to the product i during the time on stream t. In order to obtain significant amounts of products, each analysis corresponds to the products usually recovered for 3 h for low space velocities and for 1 h for high space velocities.
3. Results and discussion
3.1. Synthesis and Characterization
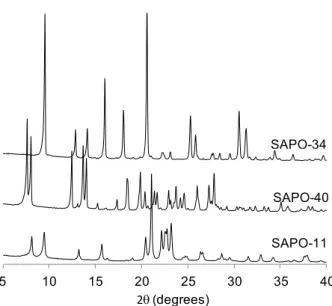
Figure 1 displays the powder XRD patterns of the as-synthesised 40, 34 and SAPO-11 materials. The patterns indicate high crystalline solids and only the crystalline phase corresponding to SAPO-40 (AFR), SAPO-34 (CHA) and SAPO-11 (AEL) could be detected in the respective patterns (ICDD PDF2 cards 01-087-1146, 00-055-0829 and 00-041-0023, respectively). SEM micrographs (supplementary data, figure SDF1) confirm the high purity of the samples. The different structures show the typical crystal shape of these materials and no significant amount of amorphous materials is observed.
Figure 1. Powder XRD patterns of the as-synthesized samples.
5 10 15 20 25 30 35 40
2q (degrees)
SAPO-34
SAPO-11 SAPO-40
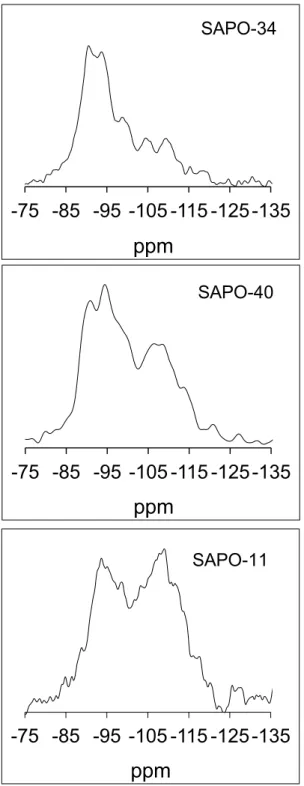
7 The acidity of SAPO materials is dependent on both the amount of silicon incorporated and the mechanism of incorporation. Substitution of a P atom in the neutral aluminophosphate framework leads to the formation of Si-O-Al bridges with a negative charge that may be balanced by an acidic proton. This type of incorporation corresponds to mechanism SM2 and gives rise to isolated Si atoms and consequently isolated and weak acid sites. However, depending on the initial amount of silicon in the synthesis gel and other experimental parameters, the incorporation may also occur by mechanism SM3, where two Si atoms substitute a pair of neighbouring P and Al leading to the formation of silicon islands. Due to different silicon environments, the acid sites located at the edges of silicon islands were proved to have higher strength than those resulting from isolated Si atoms29-32. Therefore, the silicon distribution in the various SAPO-samples is an important feature that plays a key role in the catalytic activity. Figure 2 display 29Si NMR spectra of the samples tested. Despite the broad and noisy signals observed (due to the very small amount of Si and the rather low abundance of 29Si nucleus), all the samples show resonance lines in the range -90 to -110 ppm where are usually found the Si(4Al), Si(3Al), Si(3Al), Si(1Al) and Si(4Si) environments30. Nevertheless, the relative intensities of these resonances are somewhat different for the three samples. SAPO-34 shows a broad and intense peak between -90 and -95 ppm (respectively Si(4Al) and Si(3Al) environments) together with a weaker signal at ca. -110 ppm indicative of a low amount of silica islands. SAPO-40 also shows intense resonance lines between -90 and -95 ppm but with resonance signals centered at ca. -110 ppm with higher intensity than that observed for SAPO-34. This indicates the presence of a significant amount of isolated Si species together with silica domains. SAPO-11 shows a similar profile when compared with SAPO-40 sample, though with a more intense silica islands signal. Although the presence of silicon-rich domains may give rise to strong acid sites, if these domains become excessively large, as suggested by 29Si NMR spectrum of SAPO-11, the fraction of silicon atoms contributing to the acidity would be clearly reduced. This may explain the reduced amount of Brönsted acid sites measured by pyridine adsorption on
SAPO-8 11 when compared with SAPO-40 (table 1), where the difference of silicon incorporated only partially accounts for the difference in the number of Brönsted acid sites.
Figure 2. 29Si MAS NMR spectra of the different SAPO samples.
-135 -125 -115 -105 -95 -85 -75
ppm
SAPO-34 -135 -125 -115 -105 -95 -85 -75ppm
SAPO-40 -135 -125 -115 -105 -95 -85 -75ppm
SAPO-119 3.2. Catalytic activity of SAPO-40
3.2.1 Influence of the temperature
The dehydration of glycerol over solid acid catalysts may proceed via two reaction pathways (scheme 1). The dehydration leading to the main products, acrolein and acetol, involves the protonation of either secondary or primary OH groups. These reaction routes may also be accompanied by the formation of by-products such as acids, aldehydes, aromatic compounds, adducts of acrolein with glycerol, acrolein and glycerol oligomers and coke4,8. It is generally accepted that the formation of acrolein is favored over Brönsted acid sites whereas the formation of acetol occurs preferably on Lewis acid sites4,14.
Scheme 1. Pathways for the formation of the main products from dehydration of glycerol.
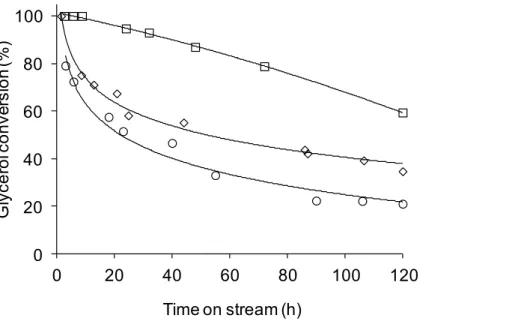
The influence of the reaction temperature on the catalytic performance of SAPO-40 is illustrated in figure 3 and table 2. At the lowest temperature tested (320 ºC) a significant deactivation occurs in the first hours on stream, followed by a gradual stabilization of the catalytic activity. This behavior of the catalytic activity is compatible with a partial blocking of the pore system in early stages of the reaction that may arise from the constraints to the diffusion of glycerol and reaction products imposed by the dimension of the pores and the rather low temperature.
OH OH HO HO O O OH O Glycerol - H2O - H2O - H2O 3-Hydroxypropanal Acrolein Acetol Pathway 1 Pathway 2
10
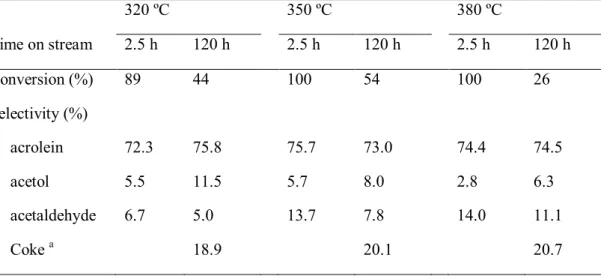
Table 2. Catalytic activity of SAPO-40 at different temperatures. The results were obtained with a WHSV of 0.85 h-1, using a 10 wt.% glycerol solution.
320 ºC 350 ºC 380 ºC Time on stream 2.5 h 120 h 2.5 h 120 h 2.5 h 120 h Conversion (%) 89 44 100 54 100 26 Selectivity (%) acrolein 72.3 75.8 75.7 73.0 74.4 74.5 acetol 5.5 11.5 5.7 8.0 2.8 6.3 acetaldehyde 6.7 5.0 13.7 7.8 14.0 11.1 Coke a 18.9 20.1 20.7
(a) – Weight loss by TG in the range 150-700 ºC
Figure 3. Conversion of glycerol at 320 ºC (▲), 350 ºC (■) and 380 (●) (experimental conditions: WHSV of 0.85 h-1, 10 wt.% glycerol solution)
In these operating conditions, the conversion at 2 h on stream reaches 90 %. This indicates that probably part of the acid sites are not active at that temperature due to a weak acid strength and, therefore, one may anticipate that an increase of the temperature will be advantageous. In fact, increasing the temperature to 350 ºC favors the catalytic activity reflected in the increase of the initial conversion and also reduces the diffusional constraints, since no deactivation is observed in the first hours on stream. Nevertheless, a further increase of the temperature to 380 ºC causes a
0 20 40 60 80 100 0 20 40 60 80 100 120 G ly ce ro l c o n ve rs io n (% ) Time on stream (h)
11 higher deactivation of the catalyst. Additionally to the effects on the diffusion of reaction products, the temperature also influences the side reactions that take place and, consequently, the type of coke that is formed. This is well documented for the conversion of hydrocarbons over zeolites33 and usually the coke that is formed at high temperature has a lower H/C ratio (hard-coke) and frequently a higher molecular weight than that formed at low temperature (light-coke). This hard-coke decomposes at higher temperature under oxygen. In the present case, a small increase of the amount of coke is observed with the increase of the temperature (table 2) but no significant changes can be observed in the TG profile between 150 and 700 ºC of the spent catalyst (supplementary data, figure SDF2), however, the heat profile (supplementary data, figure SDF2) shows two degradation steps with maxima at ca. 365 ºC and 520-550 ºC. It is evident from the heat profile that the degradation process occurring at the lower temperature is more important for the catalyst used at 320 ºC. On the other hand, the maximum of the high temperature process increases from 520 ºC for the catalyst used at 320ºC to 550 ºC for the catalyst used at 380 ºC. These data suggest the presence of coke entities with higher molecular weight and/or lower H/C and O/C ratios when the reaction is performed at higher temperature. At lower temperature (320 ºC) the presence of glycerol-based small oligomers and other oxygenated compounds is certainly more likely. Due to the rather low temperature these oligomers do not diffuse easily out of the pores of the catalyst but at the same time do not evolve rapidly to large molecular weight coke molecules that permanently deactivate the catalyst active sites. This balance is probably one of the main reasons for the conversion profile observed at 320 ºC.
Data in table 2 indicate that for SAPO-40 material the selectivity to acrolein is nearly constant in the temperatures range under study. The comparison of these values with those obtained for other microporous catalysts such as zeolites is not straightforward due to the different experimental conditions employed. Nevertheless, the results reported here for SAPO-40 are similar to some of the best ones reported for zeolitic catalysts: Y. Gu et al.6 tested a nanosized HZSM-11 and reported a selectivity to acrolein of 74.9 % for a conversion of 81.6 %, at 320 ºC and 8 h on stream;
12 Corma et al. found a selectivity to acrolein of 62 % for a glycerol conversion of 100% at 350 ºC and using ZSM-5 as catalyst8; using ferrierite at 340 °C and 91.7 mol% H2O in the feed, Kim et al.9
reported a selectivity of 77.1% with a conversion of 70.9% after 2 h reaction time.
The selectivity to acetol and acetaldehyde is for all the cases relatively low, however the production of acetaldehyde is clearly favored as the temperature rises. It has been suggested that acetaldehyde may result from the decomposition of 3-hydroxypropanal, an intermediate in the pathway leading to acrolein, by a retro-aldol condensation and thus limiting the formation of this main product12.
3.2.2. Influence of the space velocity
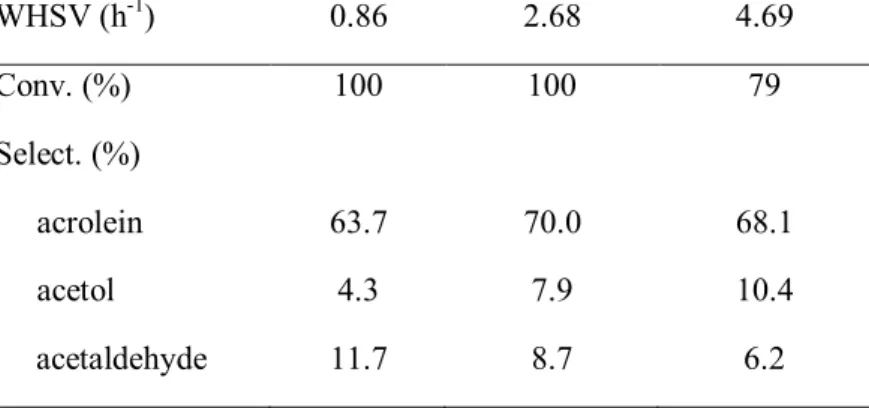
The catalytic performance is influenced by other parameters, such as the space velocity and the amount of water in the feed. Figure 4 displays the catalytic performance of SAPO-40 for a WHSV of 0.86, 2.68 and 4.69 h-1 with a constant water/glycerol ratio. For this study, a 30 wt.% aqueous solution of glycerol was used in the feed in order to achieve a high glycerol WHSV without a strong increase in the system pressure that would be obtained with a more diluted glycerol solution.
For the lowest WHSV tested no significant deactivation is observed for the first hours on stream. On the other hand, increasing the space velocity a faster pore blockage may be expected and a significant deactivation in the first hours on stream is now observed.
13
Figure 4. Conversion of glycerol over SAPO-40 at different WHSV: 0.86 h-1 (□), 2.68 h-1 (◊) and 4.69 h-1 (○)
(experimental conditions: 350 ºC, 30 % wt. glycerol solution)
Table 3 shows the selectivity for the major reaction products. These data reflects not only the increase of the glycerol space velocity but also the increase of water/catalyst ratio, because using a constant ratio water/glycerol (30 wt.% aq. sol.) leads to the increase of both parameters. The amount of water in the feed influences the selectivity as shown by Y.T. Kim et al.9, using a constant concentration of glycerol. A high amount of water competing with glycerol for adsorption on the active sites may suppress side reactions such as bimolecular condensations that lead to the formation of large molecules and thus increase the selectivity to acrolein. Even if the amount of glycerol in the feed also increases as in the present case, the same effect may probably be expected. Therefore, the data in table 3 should reflect not only the increase of the glycerol space velocity but also the increase of water/catalyst ratio. Indeed, when comparing the selectivity to acrolein at WHSV of 0.86 and 2.68 h-1 a decrease could be expected9,34 probably due to the higher concentration of glycerol, intermediates and reaction products that favors side reactions such as bimolecular condensations. However this effect is compensated by the increase of the water in the feed (1.9 mL/(h.g catalyst) and 5.8 mL/(h.g catalyst), respectively) and thus an increase of the selectivity to acrolein is observed. Comparing the results of table 2 (350 ºC, WHSV of 0.85, water flow of 7.5 mL/(h.g catalyst)) with those of table 3 (350 ºC, WHSV of 0.86, water flow of 1.9
0 20 40 60 80 100 0 20 40 60 80 100 120 G ly ce ro l c o n ve rs io n (% ) Time on stream (h)
14 mL/(h.g catalyst)), this effect is more pronounced and a substantial increase of the initial selectivity to acrolein is obtained for total glycerol conversion.
Table 3. Catalytic activity measured at 2.5 h TOS with SAPO-40 catalyst. Results obtained at 350 ºC with a 30 % wt. glycerol solution. WHSV (h-1) 0.86 2.68 4.69 Conv. (%) 100 100 79 Select. (%) acrolein 63.7 70.0 68.1 acetol 4.3 7.9 10.4 acetaldehyde 11.7 8.7 6.2 3.2.3 Catalyst regeneration
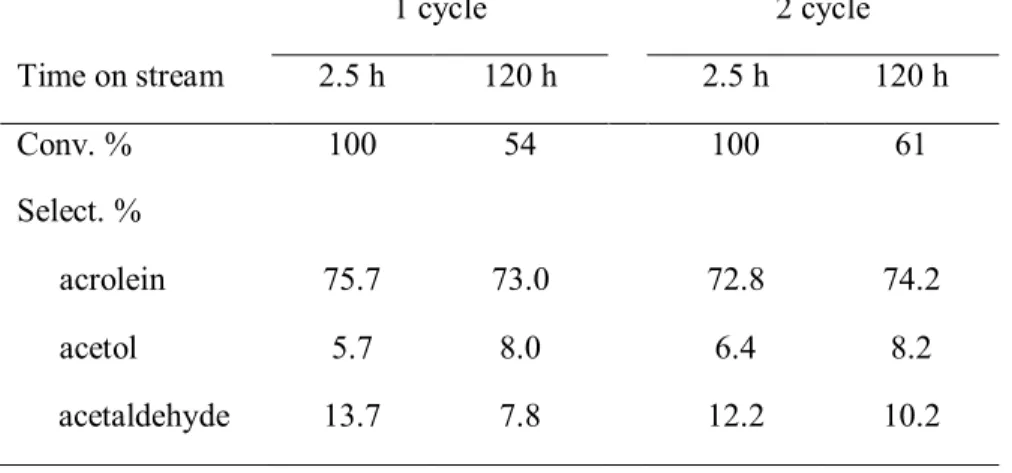
SAPO-40 has already proved to be structurally resistant under severe conditions of temperature and humidity21,22, which is an obvious advantage for the current operational conditions. In order to study the reusability of this catalyst a regeneration procedure was carried out and a new catalytic test was performed.
A regeneration of the spent catalyst under a flux of dry air at 530 ºC for 12 h leads to a catalyst very similar to the original both in terms of conversion and selectivity, as shown in figure 5 and table 4. The integrity of the structure after two regeneration cycles is also clearly evidenced by the high quality powder XRD pattern obtained after a second regeneration (supplementary data, figure SDF3).
Figure 5. Conversion of glycerol over SAPO-40. Fresh catalyst (■) and regenerated catalyst (♦). (experimental conditions: WHSV of 0.85 h-1, 10 wt.% glycerol solution).
0 20 40 60 80 100 0 20 40 60 80 100 120 G ly ce ro l c o n ve rs io n (% ) Time on stream (h)
15
Table 4. Catalytic activity of SAPO-40 in the first catalytic cycle and after regeneration. The results were obtained with a WHSV of 0.85 h-1, using a 10 wt.% glycerol solution.
1 cycle 2 cycle Time on stream 2.5 h 120 h 2.5 h 120 h Conv. % 100 54 100 61 Select. % acrolein 75.7 73.0 72.8 74.2 acetol 5.7 8.0 6.4 8.2 acetaldehyde 13.7 7.8 12.2 10.2
3.2.4. Comparison with other SAPO materials
The catalytic performance of 40 was compared with that of other SAPO structures, SAPO-34 and SAPO-11, aiming at the evaluation of the influence of the pore architecture.
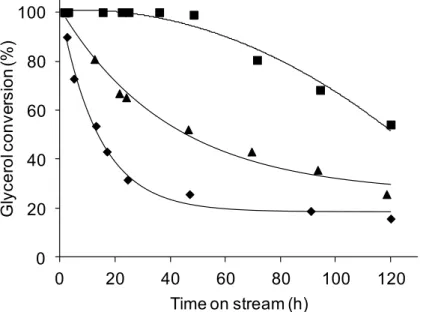
Figure 6 displays the catalytic activity of the various SAPOs, tested at 350 ºC using 10 wt. % glycerol. In these conditions SAPO-34 suffers a strong deactivation in the first 24 h on stream. On the other hand, SAPO-40 retains a very high activity for 48 h, followed by a gradual deactivation. The behavior of SAPO-34 could, in some extent, be anticipated due to the particular pore structure, i.e. large cages connected by small pores with openings of 3.8 Å. It is worth noting that the microporous volume measured for SAPO-34 and SAPO-40 is the same (table 1), however the cage openings of SAPO-34 are much smaller than the pores of SAPO-40. In this case, the significant deactivation observed is probably due to the easy blocking of the porous system by coke formation (see table 5). The remaining activity probably results from acid sites located at the external surface of the crystals. The amount of coke after 120 h on stream found for SAPO-34 is significantly lower than that found for SAPO-40 (table 5), which agrees with a more efficient pore blockage. SAPO-11 shows an intermediate behavior, which is in line with the type of the porous structure with 10-membered ring pore diameter. In this case, the formation of coke does not promote a pore blockage as efficiently as in SAPO-34, since a similar amount of coke formed does not give rise to the same
16 deactivation rate. When compared with SAPO-34, the larger pore diameter would give rise to fewer constraints; however the lower microporous volume (table 1) and the one-dimensional circulation of reagents and products have the opposite effect and thus the combined result of the two factors is observed. A similar deactivation behavior of SAPO-34 and SAPO-11 was already reported by W. Suprun et al.25. When compared with the other SAPO structures, SAPO-40 shows a remarkable catalytic stability, which certainly results from the more open structure and a more adequate acidity. In fact, the high amount of silicon incorporated and the non-excessively large silica domains existing in SAPO-40 sample, as evidenced by 29Si NMR spectra, provide a large number of acid sites when compared with SAPO-11 (table 1).
Figure 6. Conversion of glycerol over SAPO-34 (♦), SAPO-11 (▲) and SAPO-40 (■). (experimental conditions: WHSV of 0.85 h-1, 10 wt.% glycerol solution)
For all the samples under study, the main products obtained are acrolein, acetol, acetaldehyde, and, in lower amount, propionaldehyde (table 5 and supplementary data, figure SDF4 to figure SDF6). In spite of the different deactivation rates, all the materials show a high selectivity to acrolein during the catalytic test. These data suggest that the acidity of the different materials, regardless of the variations due to the difference in silicon distribution that may influence the coke formation and consequently the deactivation rate, is in all the cases adequate for the formation of acrolein in the
0 20 40 60 80 100 0 20 40 60 80 100 120 G ly ce ro l c o n ve rs io n (% ) Time on stream (h)
17 present conditions. The low selectivity for acetol, when compared with the selectivity to acrolein for all the samples, indicates that the majority of the active sites are the Brönsted ones14. This is particularly evident in the case of SAPO-11 where the number of Lewis acid sites is higher than the number of Brönsted sites (table 1), but the selectivity obtained clearly suggests the predominance of Brönsted sites. Although the acidity of SAPO-34 cannot be assessed using pyridine35, from the silicon distribution evidenced by 29Si NMR it is expected that SAPO-34, with a low amount of silica domains, should comprise mainly weak Brönsted acid sites where the presence of silica domains in the other materials may give rise to Brönsted acid sites with higher strenght22,29-32. Nevertheless, the similar selectivity obtained for all the catalysts suggest that even the weak Brönsted acid sites of SAPO-34 seem to be active for this reaction in the experimental conditions used in this study. For the SAPOs tested, no particular trend was observed in the selectivity with the number or strength of acid sites.
Table 5. Catalytic activity of SAPO-34, SAPO-11 and SAPO-40. The results were obtained at 350 ºC with a WHSV of 0.85 h-1 and using a 10 wt.% glycerol solution.
SAPO-34 SAPO-11 SAPO-40 Time on stream 2.5 h 120 h 2.5 h 120 h 2.5 h 120 h Conv. (%) 90 16 100 26 100 54 Select. (%) acrolein 76.3 72.2 73.0 74.7 75.7 73.0 acetol 10.4 11.5 10.5 9.9 5.7 8.0 acetald. 8.1 10.9 9.1 8.7 13.7 7.8 propion. 1.5 3.0 1.7 0.4 2.7 1.3 Coke (%)a 9.9 9.8 20.1
(a) – Weight loss by TG in the range 150-700 ºC
The selectivity found for SAPO-11 and SAPO-34 do not agree with the findings of Suprun et al.25 who reported a very high selectivity to acetol and a significant decrease of the selectivity to acrolein with time on stream. It should be noted, however, that the results are hardly comparable since the
18 composition and silicon distribution of the catalysts used by these authors was not reported and, additionally, the catalytic tests were performed in different conditions.
4. Conclusions
Silicoaluminophosphate SAPO-40 proved to be a highly active and stable catalyst for the dehydration of glycerol towards acrolein. The highest glycerol conversion and acrolein selectivity combined with the highest stability were obtained for a temperature of 350 ºC, which should reflect the balance of the effect of the constraints to the mass transfer imposed by the structure and the strength of the active sites.
From the data obtained it was clearly seen that SAPO-40 can be easily regenerated and do not show significant structural damage after two regeneration cycles.
The different silicoaluminosphosphate catalysts evaluated in this study show similar catalytic performance for short times on stream, which probably reflects the same nature of the acid sites, whereas for longer times on stream the effect of the pore structure is emphasized. SAPO-34 with a porous structure involving small pore openings shows a significant deactivation in the first hours on stream, which contrasts with SAPO-40 with a more open one. SAPO-11 exhibits an intermediate behavior.
Acknowledgements
The authors thank Prof. João Rocha (CICECO, Aveiro, Portugal) for providing the NMR spectra and Portuguese FCT for financial support (SFRH/BD/73234/2010 and SFRH/BPD/91397/2012)
References
1 L. Liu, X. P. Ye and J. J. Bozell, ChemSusChem, 2012, 5, 1162.
2 B. Katryniok, S. Paul, M. Capron and F. Dumeignil, ChemSusChem, 2009, 2, 719.
3 N. Rahmat, A. Z. Abdullah and A. R. Mohamed, Renewable and Sustainable Energy Rev., 2010, 14, 987.
19 4 B. Katryniok, S. Paul, V. Belliere-Baca, P. Reye and F. Dumeignil, Green Chem., 2010, 12,
2079.
5 M. Pagliaro, R. Ciriminna, H. Kimura, M. Rossi and C.D. Pina, Angew. Chem., Int. Ed., 2007,
46, 4434.
6 Y. Gu, N. Cui, Q. Yu, C. Li and Q. Cui, Appl. Catal. A: General, 2012, 429-430, 9. 7 Y.T. Kim, K.-D. Jung and E.D. Park, Microporous Mesopororous Mater., 2010, 131, 28. 8 A. Corma, G.W. Huber, L. Sauvanaud and P. O’Connor, J. Catal., 2008, 257, 163. 9 Y.T. Kim, K.-D. Jung and E.D. Park, Appl. Catal. A: General, 2011, 393, 275.
10 L. G. Possato, R. N. Diniz, T. Garetto, S. H. Pulcinelli, C. V. Santilli and L. Martins, J. Catal., 2013, 300, 102.
11 C.S. Carriço, F.T. Cruz, M.B. Santos, H.O. Pastore, H.M.C. Andrade, A.J.S. Mascarenhas,
Microporous Mesoporous Mater., 2013, 181, 74.
12 E. Tsukuda, S. Sato, R. Takahashi and T. Sodesawa, Catal. Commun., 2007, 8, 1349. 13 H. Atia, U. Armbrusterb and A. Martin, J. Catal., 2008, 258, 71.
14 A. Alhanash, E. F. Kozhevnikova and I. V. Kozhevnikov, Appl. Catal. A: General, 2010, 378, 11.
15 P. Lauriol-Garbay, J.M.M. Millet, S. Loridant, V. Bellière-Baca and P. Rey, J. Catal., 2011, 280, 68.
16 M. Massa, A. Andersson, E. Finocchio, G. Busca, F. Lenrick and L. Reine Wallenberg, J.
Catal., 2013, 297, 93.
17 Song-Hai Chai, Hao-Peng Wang, Yu Liang and Bo-Qing Xu, J. Catal., 2007, 250, 342. 18 J.P. Lourenço, M.I. Macedo, A. Fernandes, Catal. Commun., 2012, 19, 105.
19 Song-Hai Chai, Hao-Peng Wang, Yu Liang and Bo-Qing Xu, Green Chem., 2007, 9, 1130. 20 C. Minchev, Y. Neiska, V. Valtchev, V. Minkov, T. Tsoncheva, V. Panchev, H. Lechert and M.
Hess, Catal. Lett.,1993,18, 125.
21 J.P. Lourenço, M.F. Ribeiro, F.R. Ribeiro, J. Rocha, Z. Gabelica and E.G. Derouane,
Microporous Mater.,1995, 4, 445.
22 J.P. Lourenço, M.F. Ribeiro, F. R. Ribeiro, J. Rocha and Z. Gabelica, Appl. Catal. A: General, 1996,148, 167.
23 G. A. Funk, D. Myers and B. Vora, Hydrocarbon Engineering, December 2013, p. 25 24 M. Rigutto, R. van Veen and L. Huve, Stud. Surf. Sc. Catal, 2007, 168, 855.
25 W. Suprun, M. Lutecki, T. Haber, H. Papp, J. Mol. Catal. A: Chem., 2009, 309, 71.
26 N. Dumont, Z. Gabelica, E.G. Derouane and F. Di Renzo, Microporous Mater., 1994, 3, 71. 27 A. Fernandes, F. Ribeiro, J. P. Lourenço and Z. Gabelica, Stud. Surf. Sci. Catal., 2008, 174,
20 28 R. Bértolo, J. M. Silva, F. Ribeiro, F. J. Maldonar-Hódar, A. Fernandes, A. Martins, Appl.
Catal. A: General, 2014, 485, 230.
29 D. Bartohomeuf, Zeolites, 1994, 14, 394.
30 J. A. Martens, P. J. Grobet, P. A. Jacobs, J. Catal., 1990, 126, 299.
31 J.P. Lourenço, M.F. Ribeiro, F.R. Ribeiro, J. Rocha, Z. Gabelica, N. Dumont and E.G. Derouane, Stud. Surf. Sci. Catal., 1994, 84, 867.
32 G. Sastre, D.W. Lewis and C.R.A. Catlow, J. Phys. Chem.,1997, 101, 5249.
33 F. Bauer and H.G. Karge, in Molecular Sieves vol. 5, pp. 249, H.G. Karge and J. Weitkamp (Eds), Springer-Verlag, Berlin, 2007.
34 B.O. Dalla Costa, M.A. Peralta and C.A. Querini, Appl. Catal. A: General, 2014, 472, 53. 35 R.B. Borade, A. Clearfield, J. Mol. Catal., 1994, 88, 249.