Brazilian Journal
of Chemical
Engineering
ISSN 0104-6632 Printed in Brazil www.scielo.br/bjce
Vol. 35, No. 02, pp. 819 - 834, April - June, 2018 dx.doi.org/10.1590/0104-6632.20180352s20160267
LIQUID-LIQUID EQUILIBRIA FOR SYSTEMS
CONTAINING FATTY ACID ETHYL ESTERS,
ETHANOL AND GLYCEROL AT 333.15 AND 343.15 K:
EXPERIMENTAL DATA, THERMODYNAMIC AND
ARTIFICIAL NEURAL NETWORK MODELING
Rodrigo N. Cavalcanti
1*, Mariana B. Oliveira
2and Antonio J. A. Meirelles
11 ExTrAE (Laboratory of Extraction, Applied Thermodynamics and Equilibria), Department of Food Engineering, Faculty of Food Engineering, University of
Campinas – UNICAMP,13083-862, Campinas, SP, Brazil
2 CICECO, Chemistry Department, University of Aveiro, 3810-193, Aveiro, Portugal
(Submitted: April 26, 2016; Revised: April 4, 2017; Accepted: April 28, 2017)
Abstract - In this study, the liquid-liquid equilibrium (LLE) data of systems containing ethyl linoleate/oleate/ palmitate/laurate, ethanol and glycerol at temperatures ranging from 323.15 to 353.15 K were used to evaluate the performance of the NRTL, UNIFAC, Cubic-Plus-Association Equation of State (CPA EoS), and artificial neural network (ANN) models. The systems evaluated correspond to the most important components formed at the end of the ethanolysis reaction of soybean, palm and coconut oils. The temperature range selected is very important for heterogeneous catalysts, especially for high-pressure systems. The accuracy of the models was evaluated by average global deviation. UNIFAC, UNIFAC-LLE and CPA EoS models showed lower accuracy with deviations of 10.1, 8.01 and 5.95%, respectively. In spite of this predictive limitation, these models show high extrapolation capability for the description of LLE behavior when few experimental data are available in the literature. The ANN model shows the best agreement between experimental and predicted data with an average deviation of 1.12%. In this regard, ANN is offered in this work as an alternative to equations of state and activity coefficient models to be used in a more reliable and less cumbersome way for process simulators of biodiesel production and separation equipment design.
Keywords: Biodiesel systems modeling, Liquid-liquid equilibrium, Artificial neural network, Cubic-Plus-Association Equation of State, Ethylic biodiesel.
INTRODUCTION
Fossil energy sources, such as gasoline, petroleum diesel, gas and coal, supply around 80% of global energy demand, while renewables and nuclear power
account for only 13.5% and 6.5% of this demand, respectively (Asif and Muneer, 2007). The problems associated with the supply and use of these huge amounts of fossil fuels are not only related to global warming, but also to other environmental factors, such as acid rain, destruction of the ozone layer,
820 Rodrigo N. Cavalcanti, Mariana B. Oliveira and Antonio J. A. Meirelles
devastation of forests and air pollution (Follegatti-Romero et al., 2012a). Furthermore, some compounds obtained from burning fossil fuels, such as polycyclic aromatic hydrocarbons (PAHs), have been linked to some cancer incidences in large urban centers (Abrantes et al., 2009). The environmental impact and
the finiteness of fossil energy sources have propelled
the use of renewable alternatives, such as solar, wind, geothermal and biomass-based ones.
Biodiesel is a non-fossil, renewable, biodegradable, environmentally benign source of energy, with low toxicity, free of sulfur and aromatics. As an oxygenated fuel, biodiesel has a more complete combustion, reducing emissions from various pollutants, such as SO2, carbon monoxide, hydrocarbons and particulate material. Therefore, its use might minimizes the pollution of atmospheric air and the consequential environmental implications, such as the greenhouse
effect, soil contamination and air acidification (Knothe
et al., 2005). Methanol has been the alcohol most commonly used to produce biodiesel. However, ethanol has received special attention in the last decade, since it is entirely derived from renewable agricultural sources, providing a reliable alternative for countries producing this alcohol in considerable quantities, such as Brazil does from sugar cane (Follegatti-Romero et al., 2012a, 2012b; Meneghetti et al., 2006). Furthermore, ethanolic biodiesel is carbon neutral, has a higher energy density, lower pour and cloud points (Follegatti-Romero et al., 2012b) and better storage properties than biodiesel produced from methanol. Ethylic biodiesel, a blend of fatty acid ethyl
esters (FAEEs), is produced by the transesterification
reaction of a vegetable oil with an excess of ethanol, in the presence of a catalyst to increase the reaction speed and yield (Meher et al., 2006). Ethanolysis also produces glycerol as byproduct (Follegatti-Romero et al., 2012b). The products formed correspond to a partially miscible system composed of an ester-rich phase and a glycerol-rich one in the top and bottom of the reactor, respectively, with the unreacted ethanol distributed between the two phases (Follegatti-Romero et al., 2012a).
The knowledge of the product distribution between the phases in a broad range of thermodynamic conditions is required for the design and optimization of the reactor and separation units to increase the reaction rate, selectivity and yield of ethylic biodiesel production. Such improvements provide a higher quality product at a lower cost, increasing the industrial feasibility of the process and biodiesel acceptance among consumers. Hence, liquid-liquid equilibrium
(LLE) data play a fundamental role in the kinetic
studies of the transesterification reaction, as well as
in research involving the optimization of the biodiesel
purification steps in which the separation of glycerol,
ethanol and ethyl esters is desired (Basso et al., 2012). Despite the importance of this information, there are few published studies about LLE data for model systems containing fatty acid ethyl esters (FAEE), ethanol and glycerol measured at temperatures ranging from 323.15 to 353.15 K (Rocha et al., 2014; Mesquita et al., 2012; Carmo et al., 2014; Basso et al., 2012; Follegatti-Romero et al., 2012a), as the results presented here. Besides, these systems, specially using ethyl linoleate/ oleate/ palmitate/ laurate, have been modeled using almost only the CPA EoS (Follegatti-Romero et al., 2012a, 2012b; Oliveira et al., 2010; Oliveira et al., 2009; Oliveira et al., 2008; Oliveira et al., 2007).
There are several models for LLE data description. Some are based on empirical equations for the activity
coefficients, such as Margules and Van Laar; others
such as Wilson (1964), NRTL (Renon and Prausnitz, 1968) and UNIQUAC (Abrams and Prausnitz, 1976),
use the local composition concept, and finally ASOG
(Kojima and Tochigi, 1979) and UNIFAC (Fredenslund et al., 1975), use the group contribution concept. Other approaches with a sound theoretical background are the association equations of state (EoS) such as the Statistical Associating Fluid Theory (SAFTEoS) (Barreau et al., 2010), and the Cubic-Plus-Association (CPA EoS) (Follegatti-Romero et al., 2012a, 2012b; Oliveira et al., 2010; Oliveira et al., 2009; Oliveira et al., 2008; Oliveira et al., 2007). Although there
are several works using artificial neural networks to
predict vapor-liquid (Nguyen et al., 2007; Urata et al., 2002) and liquid-liquid (Ghanadzadeh et al., 2012; Gebreyohannes et al., 2013) equilibrium data, no prior investigation for systems related to ethylic biodiesel
production and purification was found in the open
literature.
This work aims to expand the available liquid-liquid equilibrium data set of systems involved in the production of ethylic biodiesel and to evaluate
the capacity of different theoretical models to
Brazilian Journal of Chemical Engineering Vol. 35, No. 02, pp. 819 - 834, April - June, 2018
821 Liquid-liquid equilibria for systems containing fatty acid ethyl esters, ethanol and glycerol at 333.15 and 343.15 K: experimental data,
thermodynamic and artificial neural network modeling
most important ethyl esters obtained by the ethanolysis reaction of soybean, palm and coconut oils.
MATERIALS AND METHODS
Chemicals
Ethyl palmitate (99.5%) and ethyl laurate (99.3%) used in this work were purchased from Tecnosyn (Cajamar/SP, Brazil). Ethyl linoleate (99.2%) and ethyl oleate (77.5%) were purchased from Sigma-Aldrich. Purities of all fatty acid ethyl esters were determined by gas chromatography. The technical grade ethyl oleate composition was already determined by Follegatti-Romero et al. (2012b). The solvents used were anhydrous ethanol (99.9%) from Merck and tetrahydrofuran (THF) (99.8%) from Sigma-Aldrich. Glycerol (99.5%) was purchased from Merck.
LLE apparatus and procedures
The liquid-liquid equilibria data for the systems containing ethyl linoleate/ethyl oleate/ethyl palmitate/ ethyl laurate + ethanol + glycerol were determined at 333.15 and 343.15 ± 0.1 K. Tie lines were determined using glass test tubes with screw caps (32 and 10 mL). Known quantities of each component were weighed on an analytical balance with a precision of 0.0001 g (Precisa, model XT220A, Sweden) and added directly to the glass test tubes. The mixture of ethyl ester, ethanol and glycerol was maintained under intense agitation for 10 min at constant temperature and pressure using a test tube shaker (Phoenix, model AP 56). The ternary mixture was then left at rest for 24 h in a thermostatic water bath at the desired
temperature, until two clear layers and a well-defined
interface were formed when the systems reached the equilibrium state. The upper layer was the ester-rich phase (EP) and the lower one the glycerol-rich phase (GP). At the end of the experiment, samples were taken separately from the upper and bottom phases using syringes and diluted immediately with THF to guarantee an immediate dilution of the samples and avoid further separation at ambient temperature. The same procedure was described in a previous work by Follegatti-Romero et al. (2012a, 2012b) was used.
Chromatographic analysis
The quantification of ethyl esters, ethanol and
glycerol was carried out on a Shimadzu VP series HPLC equipped with two LC-10ADVP solvent delivery units for binary gradient elution, a model RID10A
differential refractometer, an automatic injector with
an injection volume of 20 µL, a model CTO-10ASVP column oven for precision temperature control even at sub-ambient temperatures, a single HPSEC Phenogel column (100 Å, 300 mm x 7.8 mm ID, 5 mm), a Phenogel column guard (30 mm x 4.6 mm), a model SCL-10AVP system controller and LC-Solution 2.1 software for remote management. Samples from the two phases were analyzed by high-performance liquid chromatography (HPLC). The quantitative determination was carried out using calibration curves (external calibration) obtained using standard solutions for each system component: ethyl esters, ethanol, and glycerol. These compounds were diluted with THF in the concentration range from 0.5 to 100 mg/mL. The experimental data for each tie-line were replicated at least three times and the values reported in the present work are the average ones. The mass fractions of ethyl esters, ethanol and glycerol were determined from the areas of the corresponding HPSEC chromatographic peaks, adjusted by the response factors obtained by previous calibration.
CALCULATION APPROACH
Data correlation
Distribution coefficients and the solvent selectivity
were calculated according to Eqs. (1-3), respectively, using the experimental compositions of both phases.
(1)
(2)
(3)
where Kdi is the distribution coefficient of the
component i, wi is the mass fraction of the component i
in the ester (EP) or glycerol (GP) phases, respectively, and Si/j stands for the solvent selectivity. The subscripts
5 and 6 correspond to ethanol and glycerol components, respectively.
The quality and reliability of the LLE data experimentally measured were evaluated according to the Othmer-Tobias correlation (Othmer and Tobias, 1942): (4)
K
w
w
d GP EP 5 5 5=
K
w
w
d GP EP 6 6 6=
S
/K
K
d d 5 6 6 5
=
.
n
w
w
A
B n
w
w
1
1
1
1
i EP i EP GP GP 6 6
-=
+
-T Y T Y
822 Rodrigo N. Cavalcanti, Mariana B. Oliveira and Antonio J. A. Meirelles
where wiEP is the mass fraction of FAEE (i = 1, 2,
3, and 4 for ethyl linoleate/oleate/palmitate/laurate, respectively) in the ester-rich phase (EP), and w6GP is
the mass fraction of glycerol in the glycerol-rich phase (GP).
The validity of the equilibrium experiments was also evaluated according to the procedure developed by Marcilla et al. (1995). The procedure is based on comparing the sum of the calculated mass in both liquid phases with the actual value for total mass used in the experiment, thus obtaining a relative deviation for each point of the overall mixture for each tie-line. In this approach, independent component balances can be done as given by Eq. (5):
(5)
where i represents each component of the system; MOC
is the mass of the overall composition (initial mixture);
MGP and MEP are the total masses of the glycerol-rich
and ester-rich phases, respectively; wiOC is the mass
fraction of the component i in the initial mixture; and
wiGP and w i
EP are the mass fractions of the component i,
respectively, in the glycerol-rich and ester-rich phases. The relative average deviation for mass balance of each component i at each temperature is given by:
(6)
where n is the tie-line number and N is the total number of tie lines at each temperature.
Thermodynamic modeling
The procedure for the calculation of all models
involves flash calculations of the composition of
glycerol-rich (GP) and ester-rich (EP) phases from the midpoint composition of the experimental tie-lines. The average errors of the models were determined
by the difference between experimental (exp) and calculated (calc) concentrations of glycerol-rich (GP) and ester-rich (EP) phases using the objective function (OF) expressed by:
(7)
According to the procedure above, comparisons between experimental and calculated compositions of each component in each of the two phases were made through the root mean square deviation (RMSD).
(8)
NRTL modeling
The LLE experimental data measured at 333.15 and 343.15 K in this work, and those measured at 323.15 and 353.15 K by Follegatti-Romero et al. (2012a), were used to adjust all binary interaction parameters of the NRTL model, as described by Basso et al. (2013), using an algorithm developed in FORTRAN programming language called TML-LLE 2.0. The NRTL model was originally developed by Renon and Prausnitz (1968) and is described by the following equations: (9) (10) (11) (12) (13)
where γi is the activity coefficient of component i; xi is the mole fraction of the component i in the mixture; Gij
is the NRTL parameter; τij and τji are the NRTL binary molecular energy interaction parameters; αij is the NRTL non-randomness binary interaction parameter; T
is the absolute temperature; Aij is the NRTL adjustable parameter; and i, j, k, are components of the systems.
UNIFAC modeling
The UNIFAC and UNIFAC-LLE models, both developed by Fredenslund et al. (1975), were tested for the prediction of the experimental LLE data. The UNIFAC-LLE model was developed by Magnussen et al. (1981), with updated binary interaction parameters for LLE systems maintaining the same set of equations. The thermodynamic modeling was carried out using the simulation software Aspen-Plus (Aspen Technology, Inc., USA). Structural molecular groups selected to represent the studied systems were "CH3", "CH2", "CH", "CH=CH", "CH2COO" and "OH". The group volume (Rk) and area (Qk) parameters, as well as binary parameters (aij and aji), used in the modeling were the same as the ones presented by Magnussen
M w
OCM w
M w
i OC GP i GP EP i EP
=
+
% w Mw M w M w M
100 , , , , i i n OC OC i n GP GP i n EP EP i n OC OC n N #
dQ V=
/
#Q
+V
- &OF xijk,exp x , x ,exp x ,
GP ijk GP calc ijk EP ijk EP calc i N j M k D 2 2 1 = - +
-R W R W
" %
/
/
/
% RMSD NKx x x x
100
2
,exp , ,exp ,
in GP in GP calc in EP in EP calc i K n N 2 2 1 # = - +
-Q V
G
/
/
"Q V Q V%J
exp
G
ij=
Q
-
a x
ij ijV
A
ij=
A
Q
0
V
ij+
A
Q1
VijT
T
A
ij ijx
=
ij jia
=
a
n G x G x G x G x G x G x 1 i ji j j nc
ji ji j j nc ki k k nc ji j j nc ij ki k k nc
Brazilian Journal of Chemical Engineering Vol. 35, No. 02, pp. 819 - 834, April - June, 2018
823 Liquid-liquid equilibria for systems containing fatty acid ethyl esters, ethanol and glycerol at 333.15 and 343.15 K: experimental data,
thermodynamic and artificial neural network modeling
et al. (1981). The ternary diagrams were represented using mass fraction values predicted by the UNIFAC and UNIFAC-LLE models and compared with the experimental results.
Cubic-Plus-Association Equation of State (CPAEoS)
The CPAEoS takes into account specific
interactions between like (self-association) and unlike (cross-association) molecules (Oliveira et al., 2007; Kontogeorgis et al., 2006). It combines a physical contribution from a Cubic Equation of State, in this work the Soave-Redlich-Kwong (SRK), with an association term accounting for intermolecular
hydrogen bonding and solvation effects (Michelsen
and Hendriks, 2001) originally proposed by Wertheim
for fluids with highly directed attractive forces and
used in other association equations of state such as SAFT (Muller and Gubbins, 2001).
For non-associating components (ethyl esters) the CPA EoS has only three pure component parameters, while the associating compounds (ethanol and glycerol)
have five, considering two more parameters for the
association term. For a binary system composed solely of self-associating compounds, the binary interaction parameter, kji, is the only adjustable parameter from experimental data. In the case of solvation between self-associating and non-self-associating compounds the cross-associating volume, βij, is added to the binary interaction parameter regression to the experimental data. As explained later, the CPA EoS is used in a total predictive way. This procedure was previously applied with success at 323.15 and 353.15 K by Follegatti-Romero et al. (2012a) for the systems containing ethyl linoleate/ethyl oleate/ethyl palmitate/ethyl laurate + ethanol + glycerol. These prior results were generalized for the entire temperature dataset using an algorithm developed in FORTRAN programming language.
Artificial Neural Network (ANN)
The type of ANN used in this work was the back-propagation multilayer perceptron (BP-MLP) network, which is the most commonly algorithm used today to solve prediction problems. This type of network was selected because it is a good prediction, signal
filter and data compressor. The role of the ANN is to
transform the input information into the output one. During the training process, the weights are corrected so as to produce output values as close as possible to the desired (or target) values (Kruzlicova et al., 2009). Its main advantages include a high modeling performance, being especially suited to nonlinear
sensor responses, and the fact of being very much related to human pattern recognition. The propagation of the signal through the network is determined by the weights associated with the connections between the neurons, which represent the synaptic strengths in biological neurons. The goal of the training step is to correct the weights wij so that they will give a correct output vector y (as close as possible to the known target vector y’) for the input vector x from the training set. After the training process has been completed successfully, it is hoped that the network will give a correct prediction for any new object xn, not included in the training set (Kruzlicova et al., 2009). The hidden (xi) and output (yi) neuron activities are
defined as follow:
(14)
(15)
where f (υi) is the activation function applied in the hidden or output layers. In this study, the activation functions evaluated in the hidden and output layers were: linear function, logistic sigmoid function, hyperbolic tangent function and exponential function, which are described in Eqs. 16-19, respectively.
(16)
(17)
(18)
(19)
where e is the Euler’s number (e ≈ 2.71828...), and υi
is the net signal, which corresponds to the sum of the weighted inputs from the previous layer given by:
(20)
where j = 1, ..., p concern neurons xj in the previous layer, which precede the given neuron i, wij is the weight and bi is the bias (offset).
The bias is an extra input added to neurons, which allows a representation of phenomena having thresholds. Each neuron consists of a transfer function expressing the internal activation level. Output from
x
i=
f
Q V
y
iy
i=
f
Q V
y
if
Q V
y
i=
y
if
Q V
y
i=
1
+
1
e
-yif
ie
e
ie
e
ii i
y
=
y+
-
yy y
-Q V
f
y
i=
e
i y
-Q V
w x
b
i ij j i j
p
1
y
=
+
824 Rodrigo N. Cavalcanti, Mariana B. Oliveira and Antonio J. A. Meirelles
a neuron is determined by transforming its input using a suitable transfer function, which can be linear or nonlinear depending on the network topology (Bahramparvar et al., 2013).
The ANN modeling was performed with the software MATLAB 7 (The MathWorksInc, Natick, MA, USA) using a BP-MLP network to predict LLE compositions (Pandharipande and Moharkar, 2012). During training weighting functions for the inputs to each ANN were determined, such that the predicted outputs best matched the actual outputs from the dataset. Multiple ANN topologies were assayed,
employing different numbers of hidden layers (1
and 2) and hidden neurons (5-40). The number of neurons in the hidden layer was obtained by trial and error. Input variables were chosen according to their
logical influence on the equilibrium of the system. The number of input neurons was fixed as the number of
input variables into the neural network. In this case 5 parameters are related to ethyl esters (the number of carbon and hydrogen atoms, the number of CH2 and CH=CH functional groups and molecular weight), and 4 are related to the entire system (operating temperature and the overall composition of ethyl ester, ethanol and glycerol), totaling 9 input neurons. The output layer was made of 6 neurons corresponding to 6 possible compositions of ethyl ester, ethanol and glycerol in the glycerol-rich and ester-rich phases.
The original dataset was randomly divided into training set (70%), validation set (15%) and test set (15%) for all network topologies tested using the “dividerand” algorithm from MATLAB. Also tested was a hand-divided approach where samples for the training, validation and test sets were established manually maintaining the same proportion. This aims
to evaluate the influence of the dataset on the fitting
performance. The ANN modeling was also tested using normalized and non-normalized input datasets during the training process. The training set was used to calculate the transfer function parameters of the network and the test set was used to evaluate the network ability to correctly estimate the experimental data. An ideal network would predict all sets correctly. The aim of the neural network training is to minimize the objective function (Eq. 5) by changing the weights
and offsets. The training step was finished when the
OF converged and was less than 0.0001. If the OF
did not converge, training was completed after 500 interactions.
RESULTS AND DISCUSSION
Experimental
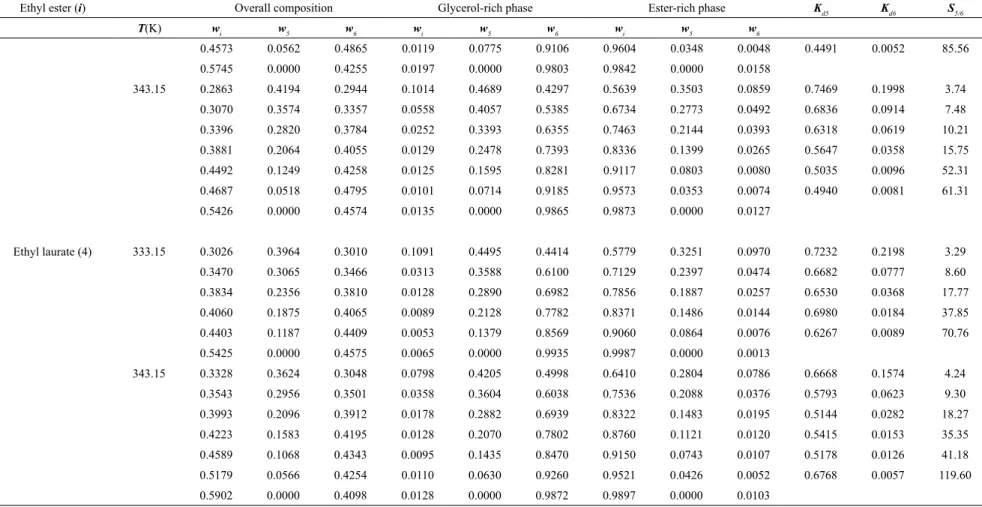
Table 1 shows the overall, ester-rich phase and glycerol-rich phase compositions of each tie-line for ternary systems composed of FAEEs (ethyl linoleate/ ethyl oleate/ethyl palmitate/ethyl laurate) + ethanol + glycerol at 333.15 and 343.15 K. The experimental errors obtained from the chromatographic analysis for each tie-line vary from 0.93 to 6.72%. The accuracy and precision of the experimental data were evaluated through the Othmer-Tobias equation (Eq. 13) (Othmer and Tobias, 1942), where A and B are the linear and
angular coefficients of the straight-line expression,
respectively. This correlation procedure has been extensively used in prior works found in the literature (Mesquita et al., 2012; Gonçalves et al., 2014).
The fitting parameters and the squared correlation coefficient (R2) obtained from the linear regression
for each ternary system at the selected temperature are presented in Table 2. The values of R2 higher
than 0.978 were obtained for all data set measured in
the present work, confirming their consistency. The
validity of experimental data was also evaluated based on the total system mass and the phase and overall compositions, the mass balances being checked according to the procedure suggested by Marcilla et al. (1995). Average deviations obtained for the mass balance of each set of experimental data are shown in Table 3. In all cases, values were lower than 0.329%, indicating the good quality of the measured data.
The distribution coefficients of ethanol (Kd5) and glycerol (Kd6), as well as the selectivity (S5/6) values are presented in Table 1. These parameters help
evaluate the performance of the first step of biodiesel purification, which is obtained by phase separation
and decantation. In fact, they indicate how the alcohol used in excess and the glycerol by-product
are distributed between the phases and the effect of
the ethanol concentration upon the distribution of the components. The Kd5 and Kd6 values were calculated as the ratio of the ethanol and glycerol mass fractions in the ester-rich phase to the glycerol-rich phase,
respectively. Distribution coefficient values were
Brazilian Journal of Chemical Engineering V
ol. 35, No. 02, pp. 819 - 834,
April - June, 2018
825
Liquid-liquid equilibria for systems containing fatty acid ethyl esters, ethanol and glycerol at 333.15 and 343.15 K: experimental data,
thermodynamic and artificial neural network modeling
Table 1. Experimental LLE data for the ternary systems containing ethyl ester (i) + anhydrous ethanol (5) + glycerol (6) at 333.15 and 343.15 K.
Ethyl ester (i) Overall composition Glycerol-rich phase Ester-rich phase Kd5 Kd6 S5/6
T(K) w
i w5 w6 wi w5 w6 wi w5 w6
Ethyl linoleate (1) 333.15 0.2356 0.4389 0.3255 0.1391 0.4661 0.3949 0.7380 0.2260 0.0359 0.4850 0.0910 5.33
0.2598 0.3880 0.3522 0.0989 0.4480 0.4531 0.8071 0.1610 0.0319 0.3593 0.0703 5.11
0.2788 0.3293 0.3919 0.0517 0.4140 0.5343 0.8740 0.1100 0.0160 0.2657 0.0299 8.89
0.2843 0.2753 0.4404 0.0356 0.3540 0.6104 0.9030 0.0851 0.0119 0.2404 0.0196 12.29
0.2344 0.2375 0.5282 0.0190 0.3070 0.6739 0.9400 0.0507 0.0093 0.1651 0.0138 11.98
0.2786 0.1504 0.5711 0.0140 0.2070 0.7790 0.9680 0.0232 0.0088 0.1120 0.0113 9.89
0.2901 0.0000 0.7099 0.0021 0.0000 0.9979 0.9930 0.0000 0.0070
343.15 0.2770 0.4374 0.2856 0.1098 0.5196 0.3706 0.7211 0.2381 0.0407 0.4583 0.1099 4.17
0.2594 0.4051 0.3355 0.0650 0.4849 0.4500 0.7764 0.1930 0.0306 0.3981 0.0680 5.86
0.2997 0.3371 0.3632 0.0350 0.4350 0.5300 0.8517 0.1279 0.0204 0.2940 0.0384 7.66
0.2794 0.2807 0.4399 0.0290 0.3500 0.6210 0.9010 0.0888 0.0101 0.2538 0.0163 15.58
0.2574 0.2381 0.5045 0.0200 0.3011 0.6790 0.9352 0.0537 0.0111 0.1783 0.0164 10.87
0.3012 0.1665 0.5324 0.0100 0.2051 0.7849 0.9621 0.0246 0.0134 0.1198 0.0170 7.04
0.2802 0.0000 0.7198 0.0120 0.0000 0.9880 0.9853 0.0000 0.0147
Ethyl oleate (2) 333.15 0.3040 0.3909 0.3051 0.0943 0.4736 0.4321 0.6809 0.2520 0.0671 0.5320 0.1553 3.42
0.3370 0.3230 0.3400 0.0366 0.4278 0.5356 0.7679 0.1883 0.0438 0.4402 0.0818 5.38
0.3808 0.2434 0.3759 0.0189 0.3415 0.6396 0.8361 0.1331 0.0309 0.3897 0.0482 8.08
0.4074 0.1839 0.4087 0.0155 0.2684 0.7161 0.8752 0.0992 0.0257 0.3695 0.0358 10.31
0.4304 0.1391 0.4305 0.0154 0.1987 0.7859 0.9001 0.0782 0.0217 0.3934 0.0276 14.26
0.4678 0.0641 0.4682 0.0161 0.0870 0.8969 0.9368 0.0469 0.0163 0.5388 0.0182 29.59
0.3688 0.0000 0.6312 0.0163 0.0000 0.9837 0.9852 0.0000 0.0148
343.15 0.3531 0.3096 0.3373 0.0665 0.4028 0.5407 0.7601 0.1900 0.0499 0.4717 0.0922 5.11
0.3717 0.2605 0.3678 0.0314 0.3357 0.6329 0.8103 0.1522 0.0375 0.4533 0.0593 7.65
0.4051 0.1922 0.4027 0.0176 0.2614 0.7210 0.8724 0.1044 0.0233 0.3992 0.0323 12.36
0.4353 0.1353 0.4294 0.0188 0.1895 0.7916 0.9001 0.0792 0.0207 0.4178 0.0261 15.98
0.5135 0.0621 0.4244 0.0171 0.0830 0.8999 0.9464 0.0374 0.0163 0.4503 0.0181 24.91
0.5488 0.0000 0.4512 0.0138 0.0000 0.9862 0.9814 0.0000 0.0186
Ethyl palmitate (3) 333.15 0.2725 0.4552 0.2723 0.1045 0.5095 0.3860 0.5690 0.3585 0.0725 0.7036 0.1879 3.74
0.2923 0.3953 0.3124 0.0673 0.4763 0.4565 0.6299 0.3086 0.0615 0.6480 0.1348 4.81
0.3352 0.3195 0.3453 0.0197 0.3896 0.5907 0.7586 0.2095 0.0319 0.5377 0.0540 9.96
0.3853 0.2495 0.3652 0.0195 0.3095 0.6710 0.8206 0.1675 0.0119 0.5412 0.0178 30.49
0.4452 0.1496 0.4052 0.0139 0.1952 0.7910 0.9086 0.0848 0.0066 0.4346 0.0084 51.85
826
Rodrigo N. Cavalcanti, Mariana B. Oliveira and
Antonio J.
A. Meir
elles
Brazilian Journal of Chemical Engineering
Ethyl ester (i) Overall composition Glycerol-rich phase Ester-rich phase Kd5 Kd6 S5/6
T(K) wi w5 w6 wi w5 w6 wi w5 w6
0.4573 0.0562 0.4865 0.0119 0.0775 0.9106 0.9604 0.0348 0.0048 0.4491 0.0052 85.56
0.5745 0.0000 0.4255 0.0197 0.0000 0.9803 0.9842 0.0000 0.0158
343.15 0.2863 0.4194 0.2944 0.1014 0.4689 0.4297 0.5639 0.3503 0.0859 0.7469 0.1998 3.74
0.3070 0.3574 0.3357 0.0558 0.4057 0.5385 0.6734 0.2773 0.0492 0.6836 0.0914 7.48
0.3396 0.2820 0.3784 0.0252 0.3393 0.6355 0.7463 0.2144 0.0393 0.6318 0.0619 10.21
0.3881 0.2064 0.4055 0.0129 0.2478 0.7393 0.8336 0.1399 0.0265 0.5647 0.0358 15.75
0.4492 0.1249 0.4258 0.0125 0.1595 0.8281 0.9117 0.0803 0.0080 0.5035 0.0096 52.31
0.4687 0.0518 0.4795 0.0101 0.0714 0.9185 0.9573 0.0353 0.0074 0.4940 0.0081 61.31
0.5426 0.0000 0.4574 0.0135 0.0000 0.9865 0.9873 0.0000 0.0127
Ethyl laurate (4) 333.15 0.3026 0.3964 0.3010 0.1091 0.4495 0.4414 0.5779 0.3251 0.0970 0.7232 0.2198 3.29
0.3470 0.3065 0.3466 0.0313 0.3588 0.6100 0.7129 0.2397 0.0474 0.6682 0.0777 8.60
0.3834 0.2356 0.3810 0.0128 0.2890 0.6982 0.7856 0.1887 0.0257 0.6530 0.0368 17.77
0.4060 0.1875 0.4065 0.0089 0.2128 0.7782 0.8371 0.1486 0.0144 0.6980 0.0184 37.85
0.4403 0.1187 0.4409 0.0053 0.1379 0.8569 0.9060 0.0864 0.0076 0.6267 0.0089 70.76
0.5425 0.0000 0.4575 0.0065 0.0000 0.9935 0.9987 0.0000 0.0013
343.15 0.3328 0.3624 0.3048 0.0798 0.4205 0.4998 0.6410 0.2804 0.0786 0.6668 0.1574 4.24
0.3543 0.2956 0.3501 0.0358 0.3604 0.6038 0.7536 0.2088 0.0376 0.5793 0.0623 9.30
0.3993 0.2096 0.3912 0.0178 0.2882 0.6939 0.8322 0.1483 0.0195 0.5144 0.0282 18.27
0.4223 0.1583 0.4195 0.0128 0.2070 0.7802 0.8760 0.1121 0.0120 0.5415 0.0153 35.35
0.4589 0.1068 0.4343 0.0095 0.1435 0.8470 0.9150 0.0743 0.0107 0.5178 0.0126 41.18
0.5179 0.0566 0.4254 0.0110 0.0630 0.9260 0.9521 0.0426 0.0052 0.6768 0.0057 119.60
0.5902 0.0000 0.4098 0.0128 0.0000 0.9872 0.9897 0.0000 0.0103
Brazilian Journal of Chemical Engineering Vol. 35, No. 02, pp. 819 - 834, April - June, 2018
827 Liquid-liquid equilibria for systems containing fatty acid ethyl esters, ethanol and glycerol at 333.15 and 343.15 K: experimental data,
thermodynamic and artificial neural network modeling
Table 2. Othmer-Tobias equation constants (A and B) and the square correlation coefficients (R2) for the ternary systems containing ethyl ester, ethanol and
glycerol at 333.15 and 343.15 K.
System T(K) A B R2
ethyl linoleate + ethanol + glycerol 333.15 -1.68 1.40 0.996
343.15 -1.59 1.30 0.994
ethyl oleate + ethanol + glycerol 333.15 -1.10 0.797 0.978
343.15 -1.19 0.681 0.981
ethyl palmitate + ethanol + glycerol 333.15 -0.763 1.07 0.997
343.15 -0.542 1.07 0.997
ethyl laurate + ethanol + glycerol 333.15 -0.309 1.23 0.992
343.15 -0.711 0.942 0.988
Table 3. Deviations (δ) for the global mass balance of the phase compositions of the systems at 333.15 and 343.15 K.
System T(K) δ(%)
ethyl linoleate (1) + ethanol (5) + glycerol (6) 333.15 0.262
343.15 0.329
ethyl oleate (2) + ethanol (5) + glycerol (6) 333.15 0.225
343.15 0.139
ethyl palmitate (3) + ethanol (5) + glycerol (6) 333.15 0.250
343.15 0.201
ethyl laurate (4) + ethanol (5) + glycerol (6) 333.15 0.193
343.15 0.280
liquid-liquid equilibrium ternary diagrams with the experimental and predicted tie-lines for ethyl linoleate/ oleate/ palmitate/ laurate ternary systems at 333.15 and 343.15 K. Selectivity values were higher than 1 and they decreased with the amount of ethanol. Such
results confirm that most ethanol is concentrated in
the glycerol-rich phase. Nevertheless, they indicate that the contamination of the biodiesel-rich phase and the concentration of ethyl esters in the glycerol-rich phase also increase with the excess of ethanol. This
means that the cost of biodiesel purification increases
because of the larger amount of ethanol in excess as
well as because of the effect of this excess upon the
distribution of glycerol and biodiesel between both
phases. On the other hand, the effect of the number
of carbons in the FAEE-chain upon the ethanol
distribution coefficients is not so clear: comparing
the results for ethyl palmitate and ethyl laurate one
notes that ethanol distribution coefficients are lower
for ethyl palmitate at 333.15 K but higher at 343.15 K than the corresponding values for ethyl laurate. Steeper slopes were observed for systems containing ethyl esters with longer and more unsaturated carbon
chains. This behavior has great influence on the separation and purification steps that are involved
in the optimization of ethylic biodiesel production.
As expected, temperature significantly influenced
the miscibility between ester-rich and glycerol-rich phases, such that an increase in temperature leads to an increase in solubility of glycerol in the ester-rich phase and vice-versa.
Thermodynamic modeling
Table 4 presents the binary interaction parameters (A(0)ij, A(0)ji, A(1)ij and A(1)ji) and the non-randomness parameter (αij) of the NRTL model. These parameters were adjusted simultaneously for each system studied through the regression of the LLE experimental data of the ethyl linoleate/ oleate/ palmitate/ laurate + ethanol + glycerol systems at 323.15, 333.15, 343.15 and 353.15 K. The liquid-liquid equilibrium data at 323.15 and 353.15 K, also used in the present data correlation, were previously obtained by Follegatti-Romero et al. (2012a), and are not presented in this work.
828 Rodrigo N. Cavalcanti, Mariana B. Oliveira and Antonio J. A. Meirelles
Figure 1. LLE ternary phase diagram for the system ethyl linoleate (w1) + ethanol (w5) + glycerol (w6) at 343.15 K: (●) tie-lines; (○) overall
composition; (--) NRTL; (₋) UNIFAC-LLE; (...) CPA EoS.
Figure 2. LLE ternary phase diagram for the system ethyl palmitate (w3) + ethanol (w5) + glycerol (w6) at 333.15 K: (●) tie-lines; (○) overall
composition; (--) NRTL; (-) UNIFAC-LLE; (...) CPA EoS.
Figure 3. LLE ternary phase diagram for the system ethyl laurate (w4) + ethanol (w5) + glycerol (w6) at 343.15 K: (●) tie-lines; (○) overall
composition; (--) ANN; (-) CPA EoS; (...) UNIFAC.
Figure 4. LLE ternary phase diagram for the system ethyl laurate (w4) + ethanol (w5) + glycerol (w6) at 333.15 K: (●) tie-lines; (○) overall
composition; (--) ANN; (-) CPA EoS; (...) UNIFAC.
global deviation of 1.85%. No previous results for those model systems have been published in the literature. Figs. 1 and 2 show the experimental and predicted liquid-liquid equilibrium phase compositions obtained by the NRTL model for the system containing ethyl linoleate at 343.15 K and for the system containing ethyl palmitate at 333.15 K, respectively. The results presented in this work are higher than those reported in the literature for similar systems (Mesquita et al.,
Brazilian Journal of Chemical Engineering Vol. 35, No. 02, pp. 819 - 834, April - June, 2018
829 Liquid-liquid equilibria for systems containing fatty acid ethyl esters, ethanol and glycerol at 333.15 and 343.15 K: experimental data,
thermodynamic and artificial neural network modeling
Table 4. Binary NRTL parameters estimated for the ethyl ester + ethanol + glycerol systems at 323.15*, 333.15, 343.15 and 353.15* K.
System Pair ij A(0)ij(K) A(0)ji(K) A(1)ij A(1)ji αij
ethyl linoleate (1) + ethanol (5) + glycerol (6) 15 3750 469 -6.00 1.60 0.580
16 390 -1230 6.11 75.0 0.101
56 -690 -997 1.13 4.85 0.113
ethyl oleate (2) + ethanol (5) + glycerol (6) 25 -210 -28.0 -2.20 6.10 0.130
26 -1981 1142 16.2 79.2 0.111
56 -690 -996 1.13 4.85 0.113
ethyl palmitate (3) + ethanol (5) + glycerol (6) 35 513 -768 -0.690 18.0 0.469
36 377 148 4.07 2.80 0.200
56 -690 -997 1.13 4.85 0.113
ethyl laurate (4) + ethanol (5) + glycerol (6) 45 10965 -5540 -344 1911 0.050
46 -22.6 -3339 4.20 14.6 0.252
56 -690 -997 1.13 4.85 0.113
* Experimental data composition of ester-rich and glycerol-rich phases previously reported by Follegatti-Romero et al. (2012a).
Table 5. Root mean square deviation percentage (RMSD%) for the predicted fatty acid ethyl ester + ethanol + glycerol systems at 323.15*, 333.15, 343.15 and 353.15* K.
System T(K) NRTL UNIFAC UNIFAC-LLE CPA EoS ANN
ethyl linoleate + ethanol + glycerol 323.15* 1.52 8.39 8.48 4.18 0.744
333.15 1.57 8.32 8.41 7.21 1.33
343.15 1.52 7.55 7.60 5.54 1.32
353.15* 1.58 9.83 9.87 3.81 0.969
323.15* 2.09 11.4 10.8 6.45 0.976
ethyl oleate + ethanol + glycerol 333.15 1.20 8.69 8.11 6.15 1.13
343.15 1.56 7.58 6.92 4.62 1.25
353.15* 2.21 8.64 7.98 3.11 0.869
323.15* 1.84 10.2 6.07 3.91 0.982
ethyl palmitate + ethanol + glycerol 333.15 1.99 12.9 8.69 8.74 1.53
343.15 1.848 12.7 8.96 6.32 1.32
353.15* 2.60 8.45 4.72 2.71 1.28
323.15* 2.33 12.7 8.55 12.6 0.572
ethyl laurate + ethanol + glycerol 333.15 1.51 12.7 8.53 5.54 1.07
343.15 1.77 9.06 5.45 4.02 1.54
353.15* 2.45 12.6 8.94 10.4 0.986
Average global deviation 1.85 10.1 8.01 5.95 1.12
*Experimental data composition of ester-rich and glycerol-rich phases previously reported by Follegatti-Romero et al. (2012a).
0.184% for these systems at 298.15 and 323.15 K, respectively. The lower RMSD results of those authors are probably related to the fact that they only varied
the operating temperature in the systems while fixing
the three components used in the systems. On the other
hand, the findings reported here were obtained by a
simultaneous regression for all four model systems
and four temperatures used, fixing NRTL binary
parameters for the ethanol-glycerol pair resulting
in less accurate results but increasing the predictive character of the model.
830 Rodrigo N. Cavalcanti, Mariana B. Oliveira and Antonio J. A. Meirelles
separation processes using binary parameters of Magnussen et al. (1981). They obtained RMSD values around 5.87-12.6% for UNIFAC and 4.93-11.4% for UNIFAC-LLE. According to Carmo et al. (2014), the cause of this high deviation may be related to the
residual part of both models, which have a simplified term for dealing with thermal effects, becoming
less accurate for a wide temperature range. The average global deviations obtained by the UNIFAC and UNIFAC-LLE models were 10.1 and 8.01%, respectively. It can be seen that UNIFAC (Figs. 3 and 4) and UNIFAC-LLE (Figs. 1 and 2) underestimated the ethanol mass fraction in the ester-rich phase. Likewise, the predictive models overestimated the ethanol mass fraction in the glycerol-rich phase, especially in the region near the plait point. However,
this effect was more pronounced in the results obtained
by the UNIFAC-LLE model. This phenomenon results in a more accentuated slope for the calculated tie-lines than the slope of the experimental tie-lines.
The CPA EoS has been widely used and with success for the description of the liquid-liquid equilibrium data of biodiesel multicomponent systems found in the literature (Follegatti-Romero et al., 2012a, 2012b; Oliveira et al., 2008, 2009). As in these previous works, the CPA EoS was applied here as a completely predictive model. The CPA EoS pure compound parameters for several ester families, non-self-associating compounds, were proposed by Oliveira et al. (2010) where it was shown that the parameters a0, c1, and b follow a linear trend with the ester carbon number. In this way, the set of CPA pure compound parameters for the esters studied in this work were estimated from the ester carbon number correlations proposed in the literature (Oliveira et al.,
2010). The five pure compound parameters for ethanol,
a self-associating component, were established earlier while performing a systematic study of the CPA pure compound parameters for the n-alcohol family from methanol to n-eicosanol (Oliveira et al., 2008). The CPA parameters for glycerol, also able to self-associate, were previously determined as well considering a 3 × 2B scheme, and used for describing the phase equilibria of several glycerol-alcohol and glycerol-water systems (Oliveira et al., 2009).
The temperature independent binary interaction and cross-association parameters used in this study were also computed by Oliveira et al. (2010). These parameters were solely obtained from binary equilibria data: the kij's between ethyl esters and ethanol were obtained from a linear correlation with the ethyl ester carbon number and the βij for these
binaries was fixed to 0.1, established when correlating
isothermal vapor-liquid equilibria data of ethanol +
ester systems (Oliveira et al., 2010); fitting the mutual
solubility data of the methyl dodecanoate + glycerol system, the kij and the βij values were determined and
fixed to constant values to be used in any fatty acid
ester + glycerol binary; for the ethanol + glycerol binary the corresponding kij value was defined when
correlating the corresponding vapor-liquid equilibria data (Oliveira et al., 2009).
Table 5 exhibits the RMSD values varying from 2.71 to 12.6% with an average global deviation of 5.95%. The systems comprised of ethyl linoleate, ethyl oleate and ethyl palmitate, at 353.15 K, showed the best agreement between the predicted and experimental tie-lines with RMSD values of 3.81, 3.11 and 2.71%, respectively. Figs. 1-4 exhibit predicted LLE data obtained with the CPA EoS. It can be seen that this model underestimates the ethyl ester mass fraction in the glycerol-rich phase, while overestimating the ethyl ester mass composition in the ester-rich phase, especially in the region near the plait point. Nevertheless, it is relevant to remark that all the parameters used with the CPA EoS were established from carbon number correlations established earlier in the literature and/or from binary system phase equilibria data descriptions. No ternary experimental data were used, the parameters used being temperature independent and, for some cases, even independent of the carbon number of the ester constituting the system.
Artificial neural network modeling
A feed-forward artificial neural network model was
used for modeling the liquid-liquid phase composition of the systems ethyl linoleate/ oleate/ palmitate/ laurate, ethanol and glycerol in the ester-rich phase and glycerol-rich phase, given, as input neurons, the number of carbon and hydrogen atoms, number of functional groups “CH2” and “CH=CH”, molecular weight, temperature, and the overall compositions of
the systems. Even though artificial neural network
models have been widely used to predict vapor-liquid equilibrium (Nguyen et al., 2007; Urata et al., 2002) and liquid-liquid equilibrium data (Ghanadzadeh et al., 2012; Gebreyohannes et al., 2013) of many systems, there are no prior studies involving model systems
related to ethylic biodiesel production and purification
steps.
Brazilian Journal of Chemical Engineering Vol. 35, No. 02, pp. 819 - 834, April - June, 2018
831 Liquid-liquid equilibria for systems containing fatty acid ethyl esters, ethanol and glycerol at 333.15 and 343.15 K: experimental data,
thermodynamic and artificial neural network modeling
capability. The optimized ANN consisted of 9 neurons in the input layer, 20 neurons in the hidden layer and 6 neurons in the output layer, with the arrangement of training, validation and test sets obtained manually. Weight and bias values for the input, hidden and output layers of the optimized network are presented in the Table 6. This was achieved by applying a strategy
based on assessing the parameters of the best fit of the
validation agreement plots for the validation data set, as a measure of the predictive ability of the model. The validity of the model was evaluated through a test data set, which were not employed in the training of the network. The predicted values were compared with those of experimental values to evaluate the performance of the neural network method using the RMSD as criterion. The deviations obtained with the ANN were the lowest among the models studied, showing RMSD values ranging from 0.572 to 1.54% for ethyl laurate at 323.15 and 333.15 K, respectively. The LLE data predicted from the ANN model can be observed in Figs. 3 and 4 for the systems comprised of ethyl laurate at 343.15 and 333.15 K, respectively. ANN results achieved great agreement with the experimental data, with an average global deviation of 1.12%. However, the model is very extensive where
300 neuron weights and 26 offsets are adjusted for
each connection between input, hidden and output layers. These results indicate that the ANN model can be reliably used to estimate the liquid-liquid equilibrium phase compositions of the systems within the ranges of temperature studied. But extrapolation to
other operating conditions seems to be a difficult task.
Furthermore, this study suggests that ANN models can be developed for a wide range of operating conditions related to liquid-liquid equilibrium data of homologous series of fatty esters and probably also for systems containing their mixtures (biodiesel). Sensitivity analysis indicates that overall compositions of ethanol, glycerol and ester, temperature and double bonds were the most important variables, showing scores of 44.3, 17.2, 8.47, 7.13 and 6.59, respectively.
CONCLUSIONS
The models that provided the best results were NRTL and ANN. Although NRTL represented more accurately the LLE data, this model is limited to the range of thermodynamic conditions used in the regression; therefore, it cannot be extrapolated to other operating conditions. The LLE data calculated from the ANN model also achieved good results; however, the model is very extensive. Hence, the extrapolation
to other operating conditions is a difficult task. Indeed, ANN is offered in this work more as an alternative to equations of state and activity coefficient models to be
used in a more reliably and less cumbersome way for process simulators and control. A larger dataset could provide a better adjustment and generalization with less hidden neurons and weights. Even though the UNIFAC and CPA EoS presented worse results, they are the most recommended for simulations of LLE data due to their higher predictive capability, being able to be applied to a wide range of thermodynamic conditions and components. Such an advantage probably makes the CPA EoS the most adequate model to be used for the description of phase equilibria of importance for the design and optimization of biodiesel production plants.
ACKNOWLEDGMENTS
The authors thank FAPESP (2014/21252-0), CNPq (406856/2013-3, 305870/2014-9, 406963/2016-9), for
their financial support. R. N. Cavalcanti thanks CAPES/
PNPD for his Postdoctoral fellowship (2952/2011). M. B. Oliveira acknowledges her Postdoctoral fellowship
(SFRH/BPD/71200/2010). This work was financed
by national funding from Fundação para a Ciência e a Tecnologia (FCT, Portugal), European Union, QREN, FEDER and COMPETE for the projects PESTC/ CTM/LA0011/2013 and EXPL/QEQ-PRS/0224/2013.
REFERENCES
Abrams, D.S., Prausnitz, J.M., Statistical thermodynamics of liquid mixtures: a new expression for the excess gibbs energy of partly or completely miscible systems. AIChE J., 21 116-128 (1976). Abrantes, R. De, De Assunção, J. V., Pesquero, C. R.,
Bruns, R. E., Nóbrega, R. P., Emission of polycyclic aromatic hydrocarbons from gasohol and ethanol vehicles. Atmos. Environ., 43(3) 648-654 (2009). Asif, M., Muneer, T., Energy supply, its demand
and security issues for developed and emerging economies. Renew. Sust. Energ. Rev., 11(7) 1388-1413 (2007).
Bahramparvar, M., Salehi, F., Razavi, S. M., Predicting
Total Acceptance of Ice Cream Using Artificial
Neural Network. J. Food. Process. Pres., 38(3) 1080-1088 (2013).
832
Rodrigo N. Cavalcanti, Mariana B. Oliveira and
Antonio J.
A. Meir
elles
Brazilian Journal of Chemical Engineering
Table 6. Weight and bias values for input, hidden and output layers of the BP-MLP 9–20–6 network. Input neurons
Input bias
Output neurons
C atoms number
H atoms number
Functional groups
number Molecular
weight Temperature
Overall composition Glycerol-rich phase Ester-rich phase
CH2 HC=CH wi w5 w6 wi w5 w6 wi w5 w6
Hidden neurons
1 0.207 -0.182 0.070 0.275 -0.306 0.004 -0.247 -1.23 -3.448 -0.529 -1.91 -0.899 0.277 -1.17 -0.015 -1.32
2 0.704 0.286 0.124 1.25 -0.143 0.632 -0.067 0.384 1.275 0.177 1.25 -1.14 0.866 -0.277 -1.127 -0.980
3 1.46 0.053 0.077 -0.413 0.525 -1.25 1.32 -0.957 -0.591 0.290 -0.614 -0.781 -0.193 0.574 1.034 0.401
4 -1.17 -0.733 -0.616 0.421 1.46 -0.345 0.157 0.673 -0.385 0.416 1.47 -0.958 -0.059 -0.440 -0.097 -0.205
5 0.291 0.721 0.845 0.372 -1.67 -0.462 -1.16 -0.423 -0.127 0.298 -1.01 -0.997 0.185 0.174 -0.153 0.014
6 -2.96 -0.628 -0.382 0.373 -0.066 0.084 1.54 0.225 -0.748 1.85 -0.109 0.562 0.658 -0.636 -0.604 -0.612
7 -0.209 0.290 -0.399 0.317 -3.20 -0.088 -0.527 1.18 -0.570 1.10 0.677 -1.45 0.111 0.238 0.229 0.270
8 0.208 -0.327 -0.555 0.411 0.602 -0.564 -0.567 -1.86 1.134 0.230 -0.141 0.491 0.811 1.15 -0.227 -0.052
9 -0.592 -0.426 -0.087 -0.805 0.134 0.057 -0.634 -0.333 -3.246 -1.26 0.001 0.027 0.203 -0.620 -0.627 0.645
10 -0.792 -0.607 -0.429 1.84 -0.763 -0.450 -0.103 1.35 4.334 -0.230 0.432 0.359 -0.594 1.35 -0.716 -0.054
11 -0.366 0.203 -0.816 -0.498 0.382 -1.24 -0.536 0.616 -3.673 -0.279 -1.08 0.519 0.571 -0.205 -0.416 -0.021
12 0.429 -0.262 0.724 -0.770 0.123 1.29 3.28 0.316 -0.293 -0.628 -0.452 0.670 -0.072 0.891 0.053 0.909
13 -1.68 -2.18 -0.588 0.352 -0.333 -0.026 0.315 0.408 -0.482 -0.165 0.374 0.633 -1.42 0.527 -0.248 0.866
14 -0.766 0.190 1.86 0.145 0.954 -0.607 0.721 0.042 -0.802 0.448 -2.23 1.15 1.20 -0.337 -0.563 0.086
15 -0.098 -0.119 -0.421 -0.153 0.364 -0.424 -1.01 -0.063 0.407 0.085 -0.068 -0.105 0.358 -0.617 0.025 -0.724
16 1.05 0.500 -0.316 0.648 -0.074 0.045 0.357 -0.301 -0.297 -0.041 0.127 -0.518 -0.120 -0.523 1.532 -0.553
17 -0.635 0.091 -0.097 0.319 1.08 0.319 0.306 0.425 3.914 1.42 0.001 -0.968 1.28 -1.12 1.036 -1.31
18 -0.119 0.157 -0.497 -0.320 -2.23 -0.060 0.195 0.041 -0.495 -1.51 -0.172 0.831 0.187 0.695 0.252 -0.567
19 0.048 0.205 -0.365 -1.68 1.10 0.008 0.276 0.129 -0.648 -2.20 0.234 -1.81 -1.12 -1.04 -1.080 -0.404
20 -0.026 -0.105 -1.46 0.406 -0.418 0.178 0.373 1.36 0.526 -0.606 0.374 0.037 1.36 -0.214 2.270 -0.454
Hidden
Brazilian Journal of Chemical Engineering Vol. 35, No. 02, pp. 819 - 834, April - June, 2018
833 Liquid-liquid equilibria for systems containing fatty acid ethyl esters, ethanol and glycerol at 333.15 and 343.15 K: experimental data,
thermodynamic and artificial neural network modeling
contribution statistical associating fluid theory. Ind.
Eng. Chem. Res., 49 5800-5807 (2010).
Basso, R. C., Meirelles, A. J. A., Batista, E. A. C., Liquid-liquid equilibrium of pseudoternary systems containing glycerol + ethanol + ethylic biodiesel from crambe oil (Crambeabyssinica) at T/K = (298.2, 318.2, 338.2) and thermodynamic modeling. Fluid Phase Equilibr., 333 55-62 (2012).
Basso, R. C., Silva, C. A. S., Sousa, C. O., Meirelles, A. J. A., Batista, E. A. C., LLE experimental data, thermodynamic modeling and sensitivity analysis in the ethyl biodiesel from macauba pulp oil settling step. Bioresource Technol., 131 468-475 (2013). Carmo, F. R., Evangelista, N. S., Santiago-Aguiar, R.
S., Fernandes, F. A. N., Sant’Ana, H. B., Evaluation
of optimal activity coefficient models for modeling
and simulation of liquid-liquid equilibrium of biodiesel + glycerol +alcohol systems. Fuel, 125 57-65 (2014).
Follegatti-Romero, L. A., Oliveira, M. B., Batista, F. R. M., Batista, E. A. C., Coutinho, J. A. P., Meirelles, A. J. A., Liquid-liquid equilibria for ternary systems containing ethyl esters, ethanol and glycerol at 323.15 and 353.15 K. Fuel, 94, 386-394 (2012a). Follegatti-Romero, L. A., Oliveira, M. B., Batista,
F. R. M., Batista, E. A. C., Coutinho, J. A. P., Meirelles, A. J. A., Liquid-liquid equilibria for ethyl esters + ethanol + water systems: Experimental measurements and CPA EoS modeling. Fuel, 96, 327-334 (2012b).
Fredenslund, A., Jones, R.L., Prausnitz, J.M., 1975. Group-contribution estimation of activity
coefficients in nonideal liquid mixtures. AIChE J.,
21, 1086-1099.
Gebreyohannes, S., Yerramsetty, K., Neely, B. J., Gasem, K. A. M., Improved QSPR generalized interaction parameters for the nonrandom two-liquid
activity coefficient model. Fluid Phase Equilibria,
339 20-30 (2013).
Ghanadzadeh, H., Ganji, M., Fallahi, S., Mathematical model of liquid-liquid equilibrium for a ternary system using the GMDH-type neural network and genetic algorithm. Appl. Math. Model., 36(9) 4096-4105 (2012).
Gonçalves, J. D., Aznar, M., Santos, G., Liquid-liquid equilibrium data for systems containing Brazil nut biodiesel + methanol + glycerin at 303.15 K and 323.15 K. Fuel, 133 292-298 (2014).
Knothe, G., Gerpen, J. V., Krahl, J., The Biodiesel Handbook. Urbana, Illinois: AOCS Press (2005).
Kojima, K, Tochigi, K., Prediction of vapor-liquid equilibria by the ASOG method. Kodonsha Elsevier, Tokyo (1979).
Kontogeorgis, G. M., Michelsen, M. L., Folas, G. K., Derawi, S., von Solms, N., Stenby, E. H., Ten years with the CPA (Cubic-Plus-Association) equation of state. Part 1. Pure compounds and self-associating systems. Ind. Eng. Chem. Res., 45 4855-4868 (2006).
Kruzlicova, D., Mocak, J., Balla, B., Petka, J., Farkova,
M., Havel, J., Classification of Slovak white wines using artificial neural networks and discriminant
techniques. Food Chem. 112(4) 1046-1052 (2009). Magnussen, T., UNIFAC parameter table for prediction
of liquid-liquid equilibria. Ind. Eng. Chem. Proc. Des. Dev., 20 331-339 (1981).
Marcilla, A., Ruiz, F., García, A. N., Liquid-liquid-solid equilibria of the quaternary system water-ethanol-acetone-sodium chloride at 25 ºC. Fluid Phase Equilibria, 112 273-289 (1995).
Meher L.C., VidyaSagar D., Naik S.N., Technical
aspects of biodiesel production by transesterification:
a review. Renew. Sustain. Energ. Rev., 10 248-268 (2006).
Meneghetti, S.M.P., Meneghetti, M.R., Wolf, C.R., Silva, E.C., Lima, G.E.S., de Lira Silva L, Serra, T.M., Cauduro, F., de Oliveira, L.G. Biodiesel from castor oil: a comparison of ethanolysis versus methanolysis. Energ. Fuel, 20 2262-2265 (2006). Mesquita, F. M. R., Bessa, A. M. M., Lima, D. D.,
Sant’Ana, H. B., Santiago-Aguiar, R. S., Liquid-liquid equilibria of systems containing cottonseed biodiesel + glycerol + ethanol at 293.15, 313.15 and 333.15 K. Fluid Phase Equilibria, 318 51-55 (2012). Michelsen, M. L, Hendriks, E. M., Physical properties
from association models. Fluid Phase Equilibria, 180 165-174 (2001).
Muller, E. A., Gubbins, K. E., Molecular-based
equations of state for associating fluids: a review of
SAFT and related approaches. Ind. Eng. Chem. Res., 40 2193-2211 (2001).
Nguyen, V. D., Tan, R. R., Brondial, Y., Fuchino, T., Prediction of vapor-liquid equilibrium data for
ternary systems using artificial neural networks.
Fluid Phase Equilibria, 254, 1-2, 188-197 (2007). Oliveira, M. B., Coutinho, J. A. P., Queimada, A. J.,
Mutual solubilities of hydrocarbons and water with the CPA EoS. Fluid Phase Equilibria, 258 58-66 (2007).
834 Rodrigo N. Cavalcanti, Mariana B. Oliveira and Antonio J. A. Meirelles
through a combination of the gradient theory with the CPA EoS. Fluid Phase Equilibria, 267 83-91 (2008).
Oliveira, M. B., Miguel, S. I., Queimada, A. J., Coutinho, J. A. P., Phase equilibria of ester plus alcohol systems and their description with the Cubic-Plus-Association Equation of State. Ind. Eng. Chem. Res., 49 3452-3458 (2010).
Oliveira, M. B., Teles, A. R. R., Queimada, A. J., Coutinho, J. A. P., Phase equilibria of glycerol containing systems and their description with the Cubic-Plus-Association (CPA) Equation of State. Fluid Phase Equilibria, 280 22-29 (2009).
Othmer, D.F., Tobias, P.E., Tie line correlation. Ind. Eng. Chem., 34 693-696 (1942).
Pandharipande, S. L., Moharkar Y., Artificial neural
network modeling of equilibrium relationship for partially miscible liquid-liquid ternary system.
International Journal of Computer Applications, 52 1-5 (2012).
Renon, H., Prausnitz, J.M., Local compositions in thermodynamic excess functions for liquid mixtures. AIChE J., 14 135-144 (1968).
Rocha, E. G. A., Follegatti-Romero, L. A., Duvoisin Jr., S., Aznar, M., Liquid-liquid equilibria for ternary systems containing ethylic palm oil biodiesel + ethanol + glycerol/water: Experimental data at 298.15 and 323.15 K and thermodynamic modeling. Fuel, 128 356-365 (2014).
Urata, S., Takada, A., Murata, J., Hiaki, T., Sekiya, A., Prediction of vapor-liquid equilibrium for binary
systems containing HFEs by using artificial neural