____________________________________
1 Extraído da Tese de Doutorado do primeiro autor.
2 Engo Agrícola, Doutor, Prof. de Ensino Básico, Técnico e Tecnológico, Instituto Federal Baiano - Câmpus Guanambi, Guanambi -
BA, Fone: (0XX77) 3493.2100, carlos.cotrim@guanambi.ifbaiano.edu.br.
3 Engo Agrônomo, Doutor, Pesquisador do Centro Nacional de Mandioca e Fruticultura, EMBRAPA, Cruz das Almas - BA,
macoelho@cnpmf.embrapa.br.
4 Engo Agrícola, Doutor, Pesquisador A, Centro Nacional de Mandioca e Fruticultura, EMBRAPA, Cruz das Almas - BA,
eugenio@cnpmf.embrapa.br.
5 Engo Agrônomo, Doutor, Prof. Titular, Departamento de Engenharia Agrícola, UFV, Viçosa - MG, mmramos@ufv.br. 6 Engo Agrônomo, Doutor, Prof. Associado II, Departamento de Matemática, UFV, Viçosa - MG, cecon@dpi.ufv.br.
Recebido pelo Conselho Editorial em: 9-9-2009
PRODUCTIVITY UNDER MICROSPRINKLING IN BRAZILIAN SEMI ARID1
CARLOS E. COTRIM2, MAURÍCIO A. COELHO FILHO3, EUGÊNIO F. COELHO4,
MÁRCIO M. RAMOS5, PAULO R. CECON6
ABSTRACT: This study aimed to test controlled levels of water deficiency in soil in mango trees, under microsprinkling irrigation, in semi-arid conditions, and to evaluate its effect in the productivity and fruits quality. The deficits were applied in the phases I, II and III of growth of the fruit, during the productive cycles of the mango tree in 2006 and 2007. The experiment in both cases was arranged in an entirely random design with 10 treatments and 3 repetitions, in the year I, and with 8 treatments and 3 repetitions in the year II. The values of soil water potential, of the treatments submitted to regulated deficit irrigation (RDI), were placed in the range of 0 to -0.011 MPa, showing that the soil humidity varied between the saturation and the field capacity, not
characterizing deficit water condition. The average values of stem water potential (Ψstem) varied
between -0.90 and -1.74 MPa, evidencing significant effect (p <0.05) just for T1 (without irrigation), T7 and T8 (RDI with 30% of the ETc in the phases II and III, respectively). Through the variance analysis, significant differences were not verified among productivity, number of fruits per plant and size of the fruit, in none of the experiments, what indicates the possibility of reduction of the water use in the irrigation of the mango tree without significant losses of productivity and fruit quality.
KEYWORDS: mango, irrigation management, water use optimization.
IRRIGAÇÃO COM DÉFICIT REGULADO E PRODUTIVIDADE DE MANGUEIRA TOMMY ATKINS, SOB MICROASPERSÃO, NO SEMIÁRIDO
RESUMO: Este trabalho teve o objetivo de testar níveis controlados de deficiência de água no solo em mangueira irrigada por microaspersão, no semi-árido, e avaliar seu efeito na produtividade e qualidade dos frutos. Os déficits foram aplicados nas fases I, II e III de crescimento do fruto, durante os ciclos produtivos da cultura da mangueira, nos anos de 2006 e 2007. O delineamento experimental, em ambos os casos, foi o inteiramente casualizado, com dez tratamentos e três repetições, no ano I, e com oito tratamentos e três repetições, no ano II. Os valores de potencial de água no solo, dos tratamentos submetidos à irrigação com déficit regulado (RDI), situaram-se na faixa de 0 a -0,011 MPa mostrando que a umidade do solo variou entre a saturação e a capacidade
de campo, não caracterizando condição de déficithídrico. Os valores médios de potencial hídrico do
ramo (Ψstem) variaram entre -0,90 e -1,74 MPa, mostrando efeito significativo apenas para T1 (sem
irrigação), T7 e T8 (RDI com 30% da ETc nas fases II e III, respectivamente). Por meio da análise de variância, não foram constatadas diferenças significativas entre produtividade, número de frutos por planta e tamanho do fruto, em nenhum dos experimentos, o que indica a possibilidade de redução do uso de água na irrigação da cultura sem perdas significativas de produtividade e qualidade do fruto.
INTRODUCTION
Brazil is the third largest producer of fruits in general, and is in the first position when referring to tropical fruits. Regarding the export of fresh fruits in 2008, mango was second in quantity, only below melon. As regards the revenues, its position was in the third place, below the grape and the melon. In 2005, Brazil exported mangoes to 17 countries across Europe, North America, South America and Africa, and only the poles of production of the São Francisco Valley participated with 92% of the total 116,047 tons exported in that year. According to the IBRAF (2008), the Brazilian fruit sector closed in 2007 with a new sales record for the export market, with exports of more than 918,000 tons of fresh fruit.
In Brazil, the mango is grown in all regions, especially the Northeast, which provides excellent conditions for its development and production, and the region became the largest producer and exporter of the fruit. The mango grown in the semi-arid region needs irrigation due to the low intensity of annual rainfall and its poor distribution. However, for LOPES et al. (2001), until that time there was no information on the water consume of mango in the northeastern semi-arid. Water shortages, the trend of increasing competition between sectors that use water resources, the imminence of charge for its use, and the demands of foreign markets for certified products (PIF), have increased the importance of irrigation management on horticulture in general, and especially the culture of mango, which occupies a prominent position in local agribusiness. The management of irrigation water, however, has not been following criteria or technical basis, leaving always the question whether the amount of water currently applied to the soil has been adequate or not (COELHO et al., 2008). Studies have found that the excess of water application has reduced the economic gain of producers in the region. The mango tree, which has physiological characteristics to adapt to water deficit in the face of its efficient ability to regulate water loss through stomata through osmotic adjustment, keeping the turgor and higher levels of leaf water potential when under water deficit (SCHAFFER et al, 1994), it can better adapt to the regulated deficit irrigation. Optimization of the water use efficiency can be achieved by reducing the applicable layer so as not to significantly reduce the culture productivity. Regulated deficit irrigation (RDI) is a management used in fruit trees, which is the application of irrigation with deficits in developmental stages of the culture whose growth and fruit quality have low sensitivity to water stress, and normal irrigation in the other stages.
Applying this management technique in mango orchard cultivar 'Kent', with four years of age, in South Africa, PAVEL & DE VILLIERS (2004) found a water savings ranging between 37 and 52% for RDI treatments compared with the control, and a non-significant difference in productivity between them.
Also COELHO FILHO & COELHO (2005) used the same technique in mango plants Tommy Atkins, with 4 years of age, irrigated by microsprinkling, with treatment consisted of water deficits in three stages of fruit growth, using layers 50%, 70% and 85% of crop evapotranspiration (ETc), having one phase with deficit and two phases with no deficit. They did not find any significant differences between productivity, number of fruits per plant and average fruit weight.
Other favorable results with this technique were obtained in studies developed by GIRONA et al. (1993), in peach; by DOMINGO et al. (1996), in real lemon; by DICHIO et al. (2007) and LOPEZ et al. (2008), in pear; by PEREZ-PEREZ et al. (2009), in sweet orange; and GIJÓN et al. (2009), in pistachios. Not as favorable result was found by GONZÁLEZ-ALTOZANO & CASTEL (2000) by applying the technique in tangerines, where a deficit of 50% of ETc, applied at the initial stage, achieved water savings of up to 23%, without negative effects on productivity and fruit quality, however, when the deficit lasted until the finals stages, besides the quality, the productivity fell about 22% for a water saving of up to 54%. In this situation, they recommended the technique as alternative management only when the cost of water is high.
MATERIAL AND METHODS
The study was conducted in a mango orchard with Tommy Atkins, 9 years old, spaced on 8 x 8 meters in the Ceraíma Irrigated Perimeter, city of Guanambi, southwest of the state of Bahia,
in latitude 14º13‟30” south, longitude 42º46‟53” west of Greenwich. The area climate is semi-arid and is located at an altitude of 525 m, with average annual rainfall of 663.69 mm and average temperature of 26 °C.
Data from the Ceraíma Meteorological Station, Development Company of the San Francisco and Parnaíba Valleys (Codevasf), situated 500 meters from the experimental area, with average monthly rainfall, temperature, relative humidity, reference evapotranspiration, and wind speed, for the years 2006 and 2007 are presented in Table 1
TABLE 1. Monthly values of precipitation (P), average air temperature (T), reference evapotranspiration - Class A Tank (ETo) and wind speed (Ws) for the years of 2006 and 2007, of the Ceraíma Meteorological Station (Codevasf), in Guanambi - BA.
Year/Parameter MONTHS
Jan Feb Mar Apr May Jun Jul Aug Sep Oct Nov Dec
2006
P (mm) 0.00 97.00 204.60 154.40 41.00 0.00 0.00 0.00 3.00 101.70 177.00 120.00
T (ºC) 26.80 27.80 25.60 25.10 24.90 24.50 23.30 25.20 24.80 25.10 24.00 25.30
UR (%) 66.80 66.30 71.40 72.60 69.90 70.60 73.30 67.80 67.30 64.00 69.80 64.70
ETo (mm) 6.30 6.39 5.00 4.61 5.03 4.71 4.37 5.31 5.27 5.41 4.81 5.47
Vv (m s-1) 3.05 1.73 1.11 1.17 2.06 2.97 3.07 4.01 3.73 3.77 1.60 2.02
2007
P (mm) 40.00 254.00 0.00 0.00 0.00 0.00 0.00 0.00 0.00 0.00 170.00 129.10
T (ºC) 26.00 23.60 25.80 25.50 25.00 22.70 24.60 24.80 27.30 28.10 25.30 24.60
UR (%) 61.60 72.30 62.90 64.20 64.30 70.80 69.60 68.10 61.80 61.10 67.80 69.60
ETo (mm) 6.31 3.65 5.48 5.86 5.78 5.04 4.95 6.02 6.38 7.04 5.59 4.97
Vv (m s-1) 2.17 1.69 2.54 2.45 1.26 0.42 3.91 3.88 4.20 4.66 3.09 2.35
∆e (KPa) - - - 1.07 1.29 1.41 1.50 - -
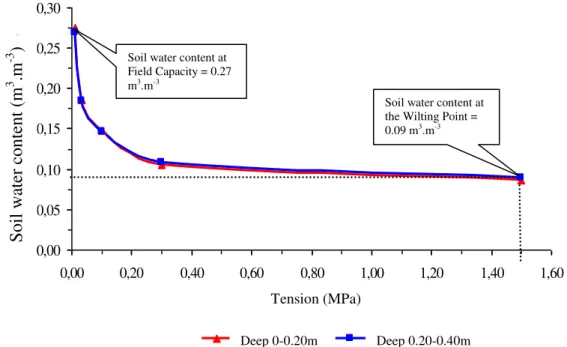
The soil of experimental area is classified as eutrophic Fluvic NeoSol of a rated sandy loam texture, and clay of high activity (Table 2). The retention curves of soil water depths from 0 to 0.20
and 0.20 to 0.40 meters are presented in Figure 1.
TABLE 2. Soil physics characteristics of the irrigated area (Ceraíma Irrigation District, Guanambi, BA).
Sample Soil Density Particles Density Total Sand Textural characteristics Silt Clay
depth (kg m-3) (kg m-3) (kg kg-1)
0 a 0.20 m 1544 2736 0.596 0.251 0.153
0.20 a 0.40 m 1605 2813 0.634 0.183 0.183
The experiment was conducted during two crop production cycles, considering the experiment 1 set up in 2006 and the experiment 2 set up in 2007 (Figure 2). In the first case, which
went from July 18th to November 11th, the management of regulated deficit irrigation and crop
productivity were accompanied, while the second, which occurred between June 20th and October
11th, besides these parameters, humidity and soil water potential in the industry (Ψstem) were
FIGURE 1. Soil water retention curves in the depths of 0 at 0.20, and 0.20 to 0.40 m, of the microsprinkling irrigated area (Ceraíma Irrigation District, Guanambi, BA).
In both cases, the treatments were applied in phases I, II and III of mango fruit development, after the period of floral induction, for a uniform flowering of approximately 80% of branches.
The irrigation layers were reduced from the layer applied to the Ceraíma Irrigated Perimeter (100% of ETc). The duration of each phase depends on the availability of local energy. In this experiment, Phase I, which corresponds to the beginning of flowering until the fruit fixation, lasted until 60 days after the onset of flowering (DAF) in 2006, and up to 51 days in 2007. Phase II, which corresponds to the fruit expansion, occurred between 61 and 92 DAF in 2006, and between 52 and 83 DAF in 2007; while Phase III, which corresponds to the end of growth and physiological maturation of the fruit, occurred between 92 and 110 DAF in 2006, and between 84 to 115 DAF in 2007.
Given the finding that no occurrence of significant effects of treatments applied about productivity, fruit size and fruit number per plant, in 2006, the experiment 2 set up in 2007 had two changes in treatments in order to increase the applied water deficit and eliminate newer plants and/or plants with size high above the standard size.
0,00 0,05 0,10 0,15 0,20 0,25 0,30
0,00 0,20 0,40 0,60 0,80 1,00 1,20 1,40 1,60
Tensão (MPa)
Te
o
r
d
e
ág
u
a
n
o
s
o
lo
(
m
3 .m -3 )
Prof. 0-0,20 m Prof. 0,20-0,40 m
Soil water content at Field Capacity = 0.27 m3.m-3
Soil water content at the Wilting Point = 0.09 m3.m-3
S
oil
wa
ter
c
ontent (
m
3 .m -3 )
Tension (MPa)
FIGURE 2. Outlines of the experiments 1 and 2 showing the treatments distribution and the water distribution plan for management of the regulated deficit irrigation (RDI), in the microsprinkling irrigated area, in 2006 and 2007 (Ceraíma Irrigation District, Guanambi, BA).
The irrigation system used to replenish water into the soil was localized by microsprinkling, with an emitter of 56 L/hour per plant, and the layers corresponding to 30; 40; 60; 80 and 100% of ETc were applied by varying the time irrigation in different registers. The irrigation layer in the period was determined based on culture coefficients (Kc) ranging from 0.45 to 0.87, from flowering to the ripening of fruit, according to COELHO et al. (2002), Figure 3.
FIGURE 3. Culture coefficient values (Kc) used in the calculation of the water amount applied in mango tree irrigation (Ceraíma Irrigation District, Guanambi, BA).
Data from reference evapotranspiration (ETo) used during the experiment 1 were obtained in a Class A Tank at Codevasf in Ceraíma, and, during the experiment 2, they were estimated from
E X P E R I M E N T 1 T8
T1
T5
T6
T4
T7
T7
T3
T9
T1
T1
T2
T2
T2
T3
T9
T3
T0
T4
T6
T6
T7
T8
T8
T9
T0
T0
T5
T5
T4
MB RES.
w
SUBTITLE: Mango Tree
Register for layer control
Distribution lines – Microsprinkling Applied layer – 100 % of ETc Applied layer – 80 % of ETc Applied layer – 60 % of ETc Applied layer – 40 % of ETc
SUBTITLE:
Applied layer – 100 % of ETc Applied layer – 60 % of ETc Applied layer – 30 % of ETc Applied layer – 00 % of ETc
It is not a treatment. E X P E R I M E N T 2 T5
T1
T7
T3
T2
T3
T6
T4
T1
T8
T3
T6
T6
T7
T4
T8
T8
T5
T5
T1
T2
T2
T4
T7
MB RES.
0,00 0,20 0,40 0,60 0,80 1,000 20 40 60 80 100 120 140 160
Days after mango tree flowering
C ultu re C oef ficien t ( Kc) ...
data collected in an automatic climatological station through the Penman-Monteith Method. Irrigations were held on Tuesdays, Wednesdays, Thursdays and Fridays depending on the availability of water in the channels of the Irrigated Perimeter, and the daily time of irrigation (Ti), in hours, applied to each treatment was determined using equation 1.
4
7
Ei
q
n
K
E
E
%Rp
Kc
ETo
Ti
1 2 l(1)
In which,
ETo - evapotranspiration of culture, mm day-1;
Kc - culture coefficient, decimal;
%Rp - reposition percentage of ETc, decimal; E1 - spacing between rows of mango, m; E2 - spacing between plants inside the row, m; n - number of microsprinklers per plant; Kl - localization coefficient, decimal; e
q - microsprinklers outflow, L h-1;
Ei - effectiveness of the irrigation system, decimal.
To monitor soil humidity in order to verify conditions of water deficit, tensiometers were installed to a depth of 0.30 m and a distance of 0.50 m from the mango tree stem, in a repetition of each treatment. The readings were taken twice a week, before and after the irrigation event, until the beginning of fruit maturation.
To assess possible water stress in plants, the stem water potential (Ψstem) was monitored using
a Scholander pressure chamber. For this, three branches were removed from each treatment of the
irrigated area by microsprinkling. The branches had between 5 and 10 leafs, had always between 4 and 6 mm in diameter, middle aged, were always taken in the position of the crown exposed to sunlight, between 1.5 and 1.8 meters above the ground, according to the procedure followed by CASTRO NETO et al. (2004).
Experiment 1
The experimental design was completely randomized, with ten treatments and three repetitions in plots formed by a mango plant.
The treatments were: T0 - full irrigation at all stages of fruit development (100% ETc); T1 - full irrigation (100% ETc) in phases II and III and 40% of ETc in Phase I; T2 - full irrigation (100% ETc) in phases I and III and 40% of ETc in Phase II; T3 - full irrigation (100% ETc) in phases I and II and 40% of ETc in Phase III; T4 - full irrigation (100% ETc) in phases II and III and 60% of ETc in Phase I; T5 - full irrigation (100% ETc) in phases I and III and 60% of ETc in Phase II; T6 - full irrigation (100% ETc) in phases I and II and 60% of ETc in Phase III; T7 - full irrigation (100% ETc) in phases II and III and 80% of ETc in Phase I; T8 - full irrigation (100% ETc) in phases I and III and 80% of ETc in Phase II; T9 - full irrigation in phases I and II and 80% of ETc in Phase III.
Experiment 2
The experimental design was also completely randomized, with eight treatments and three repetitions in plots formed by a mango plant.
The fruits were collected, sorted by size, counted and weighed, besides being submitted to a qualitative analysis related to the shape and color to complete their physical characterization. For a comparison between layer used in the irrigation and productivity, the efficiency of water use in all treatments was calculated considering the total productivity of fruits and the rough layer of water applied through irrigation (SPREER et al., 2007, 2008; SILVA et al., 2008; TEIXEIRA et al., 2008):
LBA
P
EUA
(2)In which:
EUA - efficiency of water use, kg m-3;
P - total productivity, kg ha-1;
LBA - rough layer of water applied through irrigation, m3 ha-1.
The treatments were compared in terms of productivity achieved, by the number of fruits per plant, average fruit weight and efficiency of water use.
RESULTS E DISCUSSION
In the period between July 18th and November 11th, 2006 (experiment 1), 104 mm of rain
precipitated, 3 mm in September and 101 mm in October, reaching Phases II and III of fruit growth, while during the experiment 2, in 2007, there were no rainfall (Table 1). Thus, the water demand for the mango tree, irrigated with 100% of the ETc was supplied through irrigation, using the microsprinkling system, as shown in Figure 4.
FIGURE 4. Amount of water daily applied in the Tommy Atkins mango orchard irrigation, with 100% of the ETc, in the years of 2006 and 2007 (Ceraíma Irrigation District, Guanambi, BA).
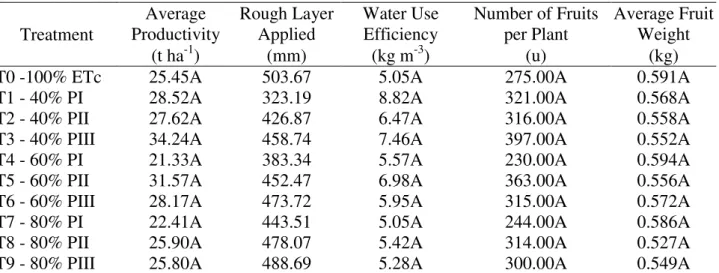
TABLE 3. Average productivity (t ha-1), rough layer applied (mm), water use efficiency (kg m-3), number of fruits per plant (u) and average fruit weight (kg) for treatments in Tommy Atkins mango trees, under microsprinkling, in the year of 2006, in Ceraíma Irrigation District, Guanambi, Bahia.
Treatment Average Productivity Rough Layer Applied Water Use Efficiency
Number of Fruits per Plant
Average Fruit Weight
(t ha-1) (mm) (kg m-3) (u) (kg)
T0 -100% ETc 25.45A 503.67 5.05A 275.00A 0.591A
T1 - 40% PI 28.52A 323.19 8.82A 321.00A 0.568A
T2 - 40% PII 27.62A 426.87 6.47A 316.00A 0.558A
T3 - 40% PIII 34.24A 458.74 7.46A 397.00A 0.552A
T4 - 60% PI 21.33A 383.34 5.57A 230.00A 0.594A
T5 - 60% PII 31.57A 452.47 6.98A 363.00A 0.556A
T6 - 60% PIII 28.17A 473.72 5.95A 315.00A 0.572A
T7 - 80% PI 22.41A 443.51 5.05A 244.00A 0.586A
T8 - 80% PII 25.90A 478.07 5.42A 314.00A 0.527A
T9 - 80% PIII 25.80A 488.69 5.28A 300.00A 0.549A
Means followed by at least one same capital letter in columns do not differ statistically from each other, at 5% probability, by the Tukey test.
The values of soil water potential determined in 2007 are presented in Figure 5. It is observed that they are values slightly higher and closer between treatments in Phase I and II, possibly reflecting the higher water availability and lower atmospheric demand. From Phase II to Phase III, the values are reduced reflecting the drying of the soil, the demand increasing by the atmosphere,
and the high vapor saturation deficit e (Table 1).
Although readings on different days, before and after the irrigation, the graph of Figure 5 shows that there was a small potential variation between the treatments with full irrigation (T2) and treatments with regulated deficit irrigation (T3, T4 and T5 - RDI with 60% of ETc in Phase I, II and III; and T5, T6 and T7 - RDI with 30% of ETc in Phase I, II and III, respectively). All values of soil water potential for these treatments were within the range of 0 and -0.012 MPa, which shows that the soil humidity ranged from the saturation to the value corresponding the yield capacity, or very close to it, according Figure 1, showing a situation without water deficit in the treatments with RDI. Only the treatments with no irrigation (T1) had lower values of water potential, between -0.032 and
-0.064 MPa, translating into a situation with a water content between 0.100 and 0.115 m3m-3, so in
moderate soil water deficit condition.
FIGURE 5. Variation of the soil water potential, of the several treatments, during the three phases of fruit growth of the Tommy Atkins mango orchard, irrigated by microsprinkling, in 2007 (Ceraíma Irrigation District, Guanambi, BA).
-0,070 -0,060 -0,050 -0,040 -0,030 -0,020 -0,010 0,000 29
/6 3/7 6/7
10 /7 13 /7 17 /7 20 /7 24 /7 27 /7 31
/7 3/8 7/8
10 /8 14 /8 17 /8 21 /8 24 /8 28 /8 31
/8 3/9 7/9
10 /9 14 /9 17 /9 21 /9 24 /9 28 /9 1/ 10 5/ 10 8/ 10 12 /1 0 15 /1 0 So il m at ri x po te nt ia l ( M Pa ) ... Date/2007
T1-Sem Irrigação T2-Irrigação Completa 60% da ETc(T3,T4,T5) 30% da ETc(T6,T7,T8)
S oil m atri x po ten ti al (M P a)
The averages stem water potential (Ψstem) of plants of the eight treatments, during phases I, II
and III of fruit growth, compared by the Tukey test at 5% probability, are shown in Table 4. It is observed that the values found for all treatments in this study ranged between -0.90 and -1.74 MPa, while the values found by CASTRO NETO et al. (2004) ranged between -0.30 and -1.70 MPa for the soil water potential ranging between -0.20 and -1.60 MPa. Considering that the soil water potential, at 0.30 m deep, in the present study, ranged from 0 to -0.064 MPa (Figure 5), there is a disagreement of those, given the considerable difference between the values of soil water potential in both cases. This can be attributed to the time of determination of stem water potential, which in this study occurred between 13 and 14 hours, whereas in the study conducted by CASTRO NETO et al. (2004) it occurred at 8 o'clock in the morning. In the first case, despite the high soil water potential, the reduced values of stem water potential are associated with the maximum degree of
dehydration achieved by the plant on a given day, which is called minimum leaf potential (Ψmin),
and usually occurs shortly after the midday sun. In the second case, despite the still low leaf dehydration at eight o'clock in the morning, the reduced values of stem water potential are also directly related to the reduced values of soil matric potential.
TABLE 4. Average values of stem water potential (Ψstem - MPa) per treatment and per fruit growth
phase, of the Tommy Atkins mango orchard irrigated by microsprinkling, in 2007 (Ceraíma Irrigation District, Guanambi, BA).
Treatment PHASE I Treatment PHASE II Treatment PHASE III
T1 - No irrig. 1.133 A T1 - No irrig. 1.525 A T1 - No irrig. 1.744 A
T3 -60% PI 1.133 A T7 -30% PII 1.350 AB T8 -30% PIII 1.556 AB
T6 -30% PI 1.067 A T4 -60% PII 1.333 B T5 -60% PIII 1.433 BC
T2 -100% ETc 1.067 A T6 -30% PI 1.242 B T7 -30% PII 1.367 BC
T5 -60% PIII 1.033 A T2 -100% ETc 1.233 B T3 -60% PI 1.367 BC
T8 -30% PIII 0.967 A T8 -30% PIII 1.225 B T4 -60% PII 1.333 C
T7 -30% PII 0.900 A T3 -60% PI 1.217 B T2 -100% ETc 1.289 C
T4 -60% PII 0.900 A T5 -60% PIII 1.200 B T6 -30% PI 1.278 C
Means followed by at least one same capital letter in columns do not differ statistically from each other, at 5% probability, by the Tukey test.
Also LIMA FILHO (2004) determined the leaf water potential in 4-year-old Tommy Atkins mangoes irrigated by microsprinkling and not subject to water stress, using a Scholander pressure chamber. He found values varying within a greater range (-0.30 to -1.73 MPa) in comparison with this work. The time of determination, which in this case ranged between 6 and 14 hours, was possibly the cause of this difference between the data. These results corroborate to those of the present study, indicating that the values between -0.30 and -1.73 MPa are typical of plants without deficit and that the minimum potential can be an indicator of optimum strategy for irrigation management when restriction of water or the high cost of the product, optimizing its use with guarantees and maintenance of potential productivity.
It is observed that the values of stem water potential, obtained in phase I of fruit growth of this study (Table 4), showed no significant differences between treatments, by Tukey test at 5% probability.
Although the values presented in both phase II and phase III did not characterize the condition of prominent water deficit, significant differences occurred between the averages of treatment T1 (without irrigation) and treatments T2, T3, T4, T5, T6 and T8 during phase II. In this situation, only the treatment T7, which then was subjected to RDI of 70% reduction of ETc, did not differ statistically from the treatment without irrigation (T1).
only the treatment T8, subjected to water restriction of 70% of ETc during the irrigation of this phase. The analysis of the results of stem water potential realizes that the differences in the management of irrigation with RDI were found by following this parameter.
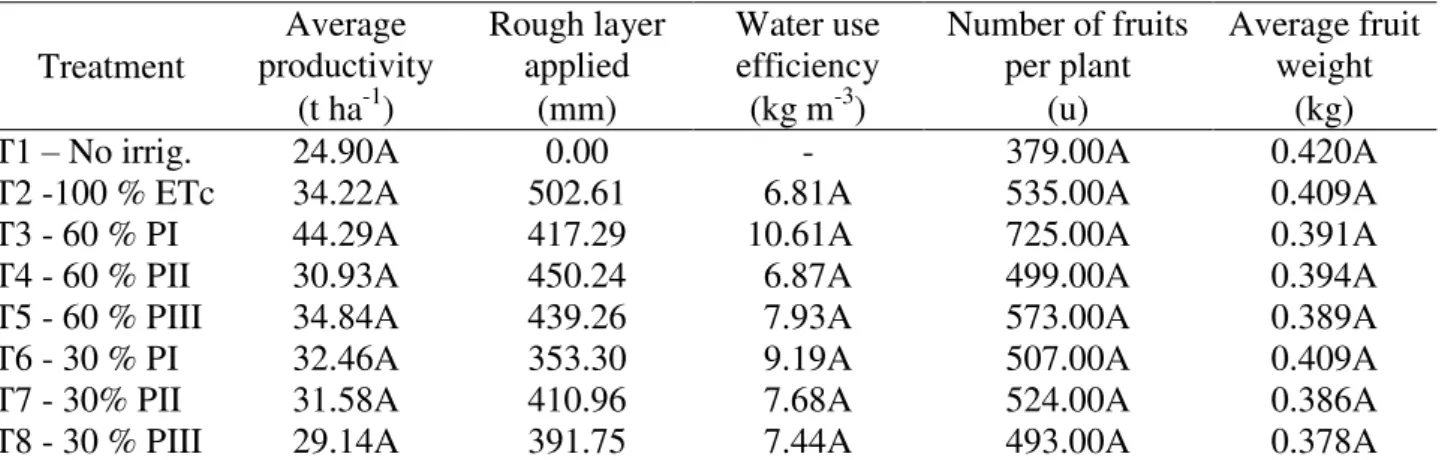
Also in 2007 there were no significant effects of treatments on the variables studied. Although productivity in T3 was almost double that in T1 (Table 5), the averages did not differ significantly from each other, possibly due to the high heterogeneity of production between plants of the same treatment. Similar results were found by ALVES JUNIOR et al. (2005), in acid lime "Tahiti" under three irrigation levels, and also by MARINHO et al. (2008), in papaya (cv. "Golden") under five irrigation layers. It was also observed that the treatments that presented greater water saving (T6, T7 and T8) showed, respectively, the second, fifth and fourth effectiveness use thereof, becoming the first and third position occupied by plants with a smaller feedstock economy. In this case, the option for smaller layers does not seem to be the most feasible, because the decrease in productivity in relation to the maximum obtained, for the two smaller layers applied (T6 and T8) was 26.71 and 34.20%, respectively, for water savings of 29.70 and 22.05%, making a larger possibility that a decrease in the revenue (production) would outweigh the costs reduction (water saving). The most obvious recommendation would be to use the management of treatment T3. These observations confirm the possibility of reducing the current layer irrigation without significantly affecting the yield and fruit quality.
TABLE 5. Average productivity (t ha-1), rough layer applied (mm), water use efficiency (kg m-3),
number of fruits per plant (ud), and average fruit weight (kg) for treatments in Tommy Atkins mango orchard under microsprinkling, in the year of 2007, in Ceraíma Irrigation District, Guanambi, Bahia.
Treatment
Average productivity
Rough layer applied
Water use efficiency
Number of fruits per plant
Average fruit weight
(t ha-1) (mm) (kg m-3) (u) (kg)
T1 – No irrig. 24.90A 0.00 - 379.00A 0.420A
T2 -100 % ETc 34.22A 502.61 6.81A 535.00A 0.409A
T3 - 60 % PI 44.29A 417.29 10.61A 725.00A 0.391A
T4 - 60 % PII 30.93A 450.24 6.87A 499.00A 0.394A
T5 - 60 % PIII 34.84A 439.26 7.93A 573.00A 0.389A
T6 - 30 % PI 32.46A 353.30 9.19A 507.00A 0.409A
T7 - 30% PII 31.58A 410.96 7.68A 524.00A 0.386A
T8 - 30 % PIII 29.14A 391.75 7.44A 493.00A 0.378A
Means followed by at least one same capital letter in columns do not differ statistically from each other, at 5% probability, by the Tukey test.
Even in the treatment without irrigation, the productivity found was high, which was attributed to the presence of high groundwater on the perimeter as a result of the furrow irrigation method used in most lots.
U.S. values found in this study varied between 5.05 and 10.61 kg m-3 and were slightly higher
than those found by SPREER et al. (2007) in Thailand, applying RDI with 50% of ETc in mango
plants “Chok Anan” of 10 years old, irrigated by microsprinkling, which stood between 4.20 and
8.60 kg m-3. However, in a later experiment in the same locality and under the same conditions, in
the years 2006 and 2007, SPREER et al. (2008) found values of this parameter ranging between
14.14 and 17.37 kg m-3, and therefore better than the current. In all cases, the calculated average
CONCLUSIONS
There were no significant differences between productivity, average fruit weight, fruit number per plant and water use efficiency of the treatments, by analysis of variance using the Tukey test at 5% probability, both in microsprinkling and dripping in 2006 and 2007.
In the Ceraíma Irrigated Perimeter, under the conditions which the experiment was conducted, it is possible to reduce water levels currently applied without losing fruit quality and significant loss of productivity in mango orchard, from the controlled application of deficits in irrigation during the growing fruit.
Controlled deficits can be applied at any stage of the fruit development.
ACKNOWLEDGEMENT
To CAPES for granting scholarship to Carlos Elizio Cotrim; to the Federal Institute of Education, Science and Technology of Bahia - Campus Guanambi (BA) for the financial support in setting up and conducting the experiment; to EMBRAPA Cassava and Tropical Fruits, for the assignment of material and equipment; to the UFV, for the opportunity of completing the course.
REFERENCES
ALVES JÚNIOR, J.; SILVA, C.R. da; RIBEIRO, R.V.; SILVA, T.J.A. da; FOLEGATTI, M.V.
Crescimento de plantas jovens de limeira ácida „Tahiti‟ sob lâminas de irrigação. Engenharia Agrícola, Jaboticabal, v.25, n.1, p.170-178, jan./abr. 2005.
CASTRO NETO, M.T.; REINHARDT, D.H.; LEDO, C.A. da S. Determination of water potential
on mango trees by Pressure Chamber. Acta Horticuture (ISHS), Recife, n.645, p.425-427, 2004.
COELHO, E.F.; COELHO FILHO, M.A.; SANTANA, J.A. do V. Resposta da mangueira Tommy
Atkins à irrigação em condições semi-áridas. Revista Ceres, Viçosa, v.55, n.1, p.15-20, 2008.
COELHO, E.F.; OLIVEIRA, A.S.; NETO, A.O.A.; TEIXEIRA, A.E.C.; ARAÚJO, E.C.E.;
BASSOI, L.H. Irrigação. In: GENU, P.J.C; PINTO, A.C.Q. (Ed.). A cultura da mangueira. cap. 9,
Brasilia, 2002. p.167-189.
COELHO FILHO, M.A.; COELHO, E.F. Uso da regulação do déficit de irrigação e produtividade de mangueira Tommy Akins em condições semi-áridas. In. CONGRESSO NACIONAL DE
IRRIGAÇÃO E DRENAGEM, 15., 2005, Teresina. Anais… Teresina: ABID, 2005. CD-ROM.
DICHIO, B.; XILOYANNIS, C.; SOFO, A.; MONTANARO, G. Effects of post-harvest regulated deficit irrigation on carbohydrate and nitrogen partitioning, yield quality and vegetative growth of
peach trees. Plant and Soil, The Hague, v.290 p.127-137, 2007.
DOMINGO, R.; RUIZ-SÁNCHES, M.C.; TORRECILLAS, A. Water relations, growth and yeld of
Fino Lemon trees under regulated deficit irrigation. Irrigation Science, v.16, p.115-123, 1996.
GIJÓN M.C.; GUERRERO, J.; COUCEIRO, J.F.; MORIANA, A. Deficit irrigation without
reducing yield or nut splitting in pistachio (Pistacia vera cv Kerman on Pistacia terebinthus L.).
Agricultural Water Management, Amsterdam, n.96, p.12-22, 2009.
GIRONA, J.; MOTA, M.; GOLDHAMMER, D.A.; JOHNSON, R.S.; DEJONG, T.M. Patters of soil and tree water status and leaf functioning during regulated deficit irrigation scheduling in
peach. Journal of the American Society for Horticultural Science, Alexandria, n.118, p.80-586,
1993.
GONZALES-AUTOZANO, P.; CASTEL, J.R. Effects of regulated déficit irrigation on “Clementin
de Nules” citrus tree growth, yield and fruit quality. Acta Horticultural, The Hague, Valencia,
IBRAF. Comparativo das exportações brasileiras de frutas frescas 2006-2007. Disponível em:
<http//www.ibraf.org.br/Estatísticas e Revista>. Acesso em: 5 jun. 2008.
LIMA FILHO, J.M.P. Methodology for water potential measurement on mango using the pressure
chamber. Acta Horticutural, The Hague, n.645, p.459-461, 2004.
LOPES, P.M.O.; SILVA, B.B.; AZEVEDO, P.V.; SILVA, V. de P.R.; TEIXEIXA, A.H. de C.;
SOARES, J.M.; SOBRINHO, J.E. Balanço de energia num pomar de mangueiras irrigado. Revista
Brasileira de Agrometeorologia, Santa Maria, v.9, n.1, p.1-8, 2001.
LOPEZ, G.; ARBONES, A.; DEL CAMPO, J.; MATA, M.; VALLVERDU, X.; GIRONA, J.; MARSAL, J. Response of peach trees to regulated deficit irrigation during stage II of fruit
development and summer pruning. Spanish Journal of Agricultural Research, Madrid, v.6, n.3,
p.479-491, 2008.
MARINHO, A.B.; BERNARDO, S.; SOUSA, E.F. de; PEREIRA, M.G.; MONNERAT, P.H. Produtividade e qualidade de frutos de mamão cultivar 'Golden' sob diferentes lâminas de irrigação
e doses de potássio no norte de Espírito Santo. Engenharia Agrícola, Jaboticabal, v.28, n.3,
p.417-426, jul./set. 2008.
PAVEL, E.W.; DE VILLIERS, A.J. Responses of mango trees to reduced irrigation regimes. Acta
Horticultural, The Hague, Mendoza, n.646, p.63-68, 2004.
PÉREZ-PÉREZ, J.G.; ROBLES, J.M.; BOTÍA, P. Influence of deficit irrigation in phase III of fruit
growth on fruit quality in „lane late‟ sweet orange. Agricultural Water Management, Amsterdam,
v.96, n.6, p.969-974, June 2009.
SCHAFFER, B.; WHILEY, A.W.; CRANE, J.H. Mango. In: SCHAFFER, B.; ANDERSEN, P.C.
(Ed). Handbook of environmental physiology of fruit crops volume II: subtropical and tropical
crops. Boca Raton: CRC Press, 1994. cap.8, p.165-197.
SILVA, V.P.R.; CAMPOS, J.P.B.C.; AZEVEDO, P.V. Water-use eficiency and evapotranspiration
of mango orchard grown in northeastern region of Brazil. Scientia Agricultural, The Hague, v.120,
n.4, p.467-472, 2002.Disponível em: <http://doi.org/10.1016/j.scientia.2008.12.005>.
SPREER, W.; NAGLE, M.; NEIDHART, S.; CARLE, R.; ONGPRASERT, S.; MÜLLER, J. Effect
of regulated deficit irrigation and partial rootzone drying on the quality of mango fruits (Mangifera
indica L., cv. “Chok Anan”). Agricultural Water Management, v.88, p.173-180, 2007.
SPREER, W.; ONGPRASERT, S.; HEGELE, M.; WÜNSCHE, J. N.; MÜLLER, J. Yield and fruit
development in mango (Mangifera indica L. cv. “Chok Anan”) under different irrigation regimes.
Agricultural Water Management, Amsterdam, v.96, n.4, p.574-584. Disponível em:
<http://dx.doc.org/10.1016/j.agwat.2008.09020>. Acesso em: 10 nov. 2011.
TEIXEIRA, A.H. de C.; BASTIAANSSEN, W.G.M.; MOURA, M.S.B.; SOARES, J.M.; AHMAD, M.D.; BOS, M.G. Energy and water balance measurements for water productivity analysis in
irrigated mango trees, Northeast Brazil. Agricultural and Forest Meteorology, v.148, p.1524-1537,