‘Tommy Atkins’ mango yield and photosynthesis
under water deficit in semiarid region of Bahia
1Marcelo R. dos Santos
1, Mauro A. Martinez
2, Sérgio L. R. Donato
3& Eugênio F. Coelho
41 Parte da tese de doutorado do primeiro autor apresentada ao DEA/UFV
2 IF BAIANO. Guanambi, BA. E-mail: marcelo.rocha@guanambi.ifbaiano.edu.br (Autor correspondente) 3 DEA/UFV. Viçosa, MG. E-mail: mmauro@ufv.br
4 IF BAIANO. Guanambi, BA. E-mail: sergiodonatoeaf@yahoo.com.br
5 Embrapa Mandioca e Fruticultura. Cruz das Almas, BA. E-mail: eugenio.coelho@embrapa.br
A B S T R A C T
The aim of this study was to evaluate the ‘Tommy Atkins’ mango yield and photosynthesis in regulated deficit irrigation (RDI) in semiarid conditions of Bahia, Brazil. The experimental design was a randomized block with five treatments and six replications: T1, irrigation supplying 100% crop evapotranspiration (ETc) in phases: I (beginning of flowering to early fruit growth), II (start of expansion until early physiological maturity) and phase III (physiologically mature fruits); T2, RDI with 50% ETc in phase I; T3, RDI with 50% ETc in phase II; T4, RDI with 50% ETc in phase III; T5, No irrigation. The soil water deficit causes a reduction in photosynthesis. Mango yield in treatment 4 was approximately 5.5 and 2 times greater than in treatments 5 and 2, respectively. The use of RDI with 50% water depth reduction applied in the third phase of ‘Tommy Atkins’ mango fruit development was efficient. The use of RDI with 50% ETc in the third phase of fruit development provided the best yield of ‘Tommy Atkins’ mango for the 350 g weight class.
Produtividade e fotossíntese da mangueira ‘Tommy Atkins’
sob déficit hídrico em região semiárida da Bahia
R E S U M O
Objetivou-se, com este trabalho, avaliar a produtividade e a fotossíntese da mangueira ‘Tommy Atkins’ sob irrigação com déficit controlado (RDI) em condições semiáridas do sudoeste da Bahia. O delineamento experimental foi em blocos casualizados com cinco tratamentos e seis repetições: T1 – Irrigação suprindo 100% da ETc nas fases: I (do início da floração até o início da expansão dos frutos), II (início da expansão até início da maturação fisiológica) e na fase III (maturação fisiológica dos frutos); T2 – RDI com 50% da ETc na fase I; T3 – RDI com 50% da ETc na fase II; T4 – RDI com 50% da ETc na fase III; T5 – Sem irrigação. O déficit hídrico no solo ocasiona redução na taxa fotossintética. A produtividade no tratamento 4 foi aproximadamente 5,5 e duas vezes maior que nos tratamentos 5 e 2, respectivamente, enquanto o uso da RDI com redução de 50% da lâmina de irrigação aplicada na terceira fase de desenvolvimento dos frutos de mangueira ‘Tommy Atkins’ foi eficiente; já o uso da RDI com 50% da ETc na terceira fase de desenvolvimento do fruto, proporciona melhores produtividades de mangueira ‘Tommy Atkins’ para a classe de peso 350 g.
Key words: Mangifera water use efficiency regulated deficit irrigation partial root zone drying
Palavras-chave: Mangifera
eficiência de uso da água irrigação com déficit controlado secamento parcial das raízes
Revista Brasileira de
Engenharia Agrícola e Ambiental
Campina Grande, PB, UAEA/UFCG – http://www.agriambi.com.br Protocolo 258.13 – 20/08/2013 • Aprovado em 18/04/2014
ISSN 1807-1929
v.18, n.9, p.899–907, 2014
Introduction
The Mangifera is cultivated in all Brazilian northeast states, mainly in irrigated areas of the semiarid region, which possesses excellent conditions for crop development and elevated yield and fruit quality. Brazil is one of the greatest mango exporters. For exportation, the mango must be red and brilliant coloration, with short fibers, weighing between 250 and 600 g per fruit, which is the preference of the North American market. In Europe, the preference is for fruits between 300 and 450 g (Araújo, 2004).
In Brazil, the main mango producing states are Bahia, Pernambuco, São Paulo, Minas Gerais and Ceará (IBGE, 2011). In Bahia, the main producing poles, where the use of irrigation
development in which fruit growth and quality have low sensibility to water deficit (Romero & Botía, 2006; Savić et al., 2008; González et al., 2009; Iniesta et al., 2009). In other words, it is possible to reduce water consumption and energy without great damages to fruit quality and orchard yield. In contrast, PRD irrigation management consists of rotating the irrigated side of the plant during 10 to 14 days, between the phonologic fruit-set phase and harvest. PRD uses biochemical responses of plants to water stress to achieve a balance between vegetative and reproductive development; in consequence, there is significant improvement in production per unit of irrigation water applied (McCarthy, 2000).
Regulated deficit irrigation has been purposed in several crops, such as mango (Spreer et al., 2007; 2009; Silva et al., 2009; Cotrim et al., 2011, Santos et al., 2013; Santos & Martinez, 2013; Santos et al., 2014), pear (Marsal et al., 2008), grapevine (McCarthy, 2000; Ferreyra et al., 2002), peach (Gelly et al., 2004), loquat (Cuervas et al., 2007), melon (Fabeiro et al., 2002), olive (Iniesta et al., 2009), tomato (Savić et al., 2008), garlic (Cortés et al., 2003), onion (Olalla et al., 2004), beet (Fabeiro et al., 2003), bean and watermelon (González et al., 2009). These studies show water and energy saving, fruit quality improvement and yield increase.
Cotrim et al. (2011), using RDI, observed no differences (P > 0.05) in yield, fruit weight, number of fruits for plant and water use efficiency in the ‘Tommy Atkins’ mango with 100, 80, 60 and 40% of ETc, in microsprinkling and dripping systems. They attributed these results to the rise of ground water in the evaluation period.
Spreer et al. (2007) found no reduction in production and mango fruit quality in the North of Thailand, and affirmed that it is possible to obtain a sustainable production with the use of RDI and PRD with 50% of ETc. Spreer et al. (2009) observed that a 30 to 50% deficient irrigation results in a higher water use efficiency and great water economy.
Silva et al. (2009) noticed that evapotranspiration and water use efficiency in ‘Tommy Atkins’ mango trees was influenced by soil water level defined by fractions of ETo water supply. The productivities under 70, 80 and 90% of ETo (reference crop evapotranspiration) were higher (P < 0.05) than the yield under100% ETo. The highest and the lowest yield were obtained for 90 and 100% of ETo water supply, respectively. Thus, improvement of water use efficiency in the studied region was obtained by irrigating with 90% of ETo.
In view of that and the lack of data in the literature on the use of RDI in Brazilian semiarid conditions, further studies
are needed on irrigation with water reduction without yield and financial profitability damages during the crop growth and production phases. Thus, the aim of this study was to evaluate the yield and photosynthesis of the ‘Tommy Atkins’ mango tree under RDI in the Bahia semiarid region.
Material and Methods
The study was conducted in an experimental area of the Company for Development of the São Francisco and Parnaíba Valley (CODEVASF) located in the irrigated perimeter of Ceraíma, in Guanambi, Southwest of Bahia (14º 17' 27" S, 42º 46' 53" W and 537 m altitude), Brazil. In data series analysis was verified that the annual mean rainfall is 680 mm and annual average temperature is 25.6 ºC. The soil is a eutrophic Fulvic Neosol, whose physical characteristics are shown in Table 1.
Regulated deficit irrigation (RDI) was used for ‘Tommy Atkins’ mango (Mangifera indica L.) from flowering to fruit ripening during two productive cycles, in 2010 and 2011. The experiment was conducted in an orchard with 11-year old plants in the first evaluation cycle. The spacing between plants was 8 x 8 m, irrigated by micro sprinkling with one emitter per plant, applying a flow rate of 50 L h-1 under 200 kPa pressure.
During the two evaluated production cycles, after harvest and pruning, plants were fertilized with 500 g of MAP (monoammonium phosphate), 200 g of ammonium sulphate, 150 g of potassium chloride and 20 kg of chicken excreta per plant. Daily irrigation was applied during the period in which plant was emitting up to two vegetative shoots. After the emission of shoots, 4.0 g of active ingredient per tree of Paclobutrazol growth regulator was applied; subsequently, irrigation was ceased and when the plants presented symptoms of epinasty of terminal buds (Mouco & Albuquerque, 2005) application of calcium nitrate in the leaves to break bud dormancy and induce uniform flowering was performed.
Treatments with RDI were applied from flowering to fruit ripening in three development phases according to Cotrim et al. (2011): phase I from early flowering (EF) up to fruit set (FS), which lasted around 65 days; phase II (fruit expansion) from FS up to approximately 95 days after EF and phase III (late growth and physiologic fruit ripening) from the end of phase II up to nearly 120 days after EF.
A randomized complete blocks design was used with five treatments and six replications, considering one plant per plot. Treatments were applied in phases I, II and III after
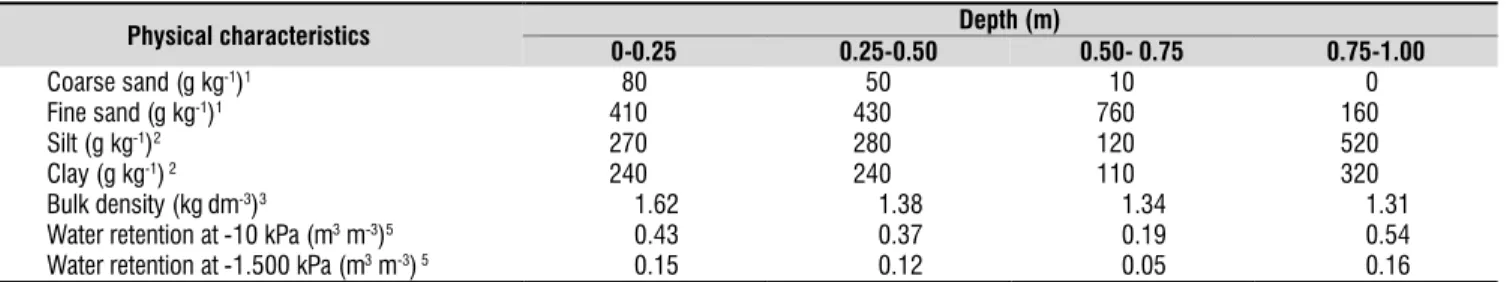
1By soil screening; 2Pipette method; 3Test tube and volumetrical ring method; 4Volumetrical balloon method; 5porous plate equipment
Physical characteristics Depth (m)
0-0.25 0.25-0.50 0.50- 0.75 0.75-1.00
Coarse sand (g kg-1)1 080.00 050.00 010.00 000.00
Fine sand (g kg-1)1 410.00 430.00 760.00 160.00
Silt (g kg-1)2 270.00 280.00 120.00 520.00
Clay (g kg-1)2 240.00 240.00 110.00 320.00
Bulk density (kg dm-3)3 001.62 001.38 001.34 001.31
Water retention at -10 kPa (m3m-3)5 000.43 000.37 000.19 000.54
Water retention at -1.500 kPa (m3m-3)5 000.15 000.12 000.05 000.16
the blossoming induction period. The treatments were the following: 1, 100% ETc water supply from flowering to fruit harvest; 2, 50% of ETc from early flowering to early fruit expansion and 100% of ETc from that until harvest; 3, 100% of ETc from early flowering to early fruit expansion and 50% from that up to early physiologic ripening and 100% of ETc during fruit physiologic ripening; 4, 100% of ETc from early flowering to late fruit expansion and 50% of ETc during physiologic ripening; 5, no irrigation.
Treatments were compared as for photosynthesis rate, total yield, fruit weight and yield within each class of mango fruit and water use efficiency. These values were submitted to analysis of variance and photosynthesis, yield and water use efficiency means compared by Duncan's test at 0.05 probability level.
The differentiation of irrigation water depths applied by the microsprinklers was obtained by closure of registers equivalent to the different treatments. The water used in irrigation originated from tubular wells with electrical conductivity between 0.62 to 1.32 dS m-1. The amount of irrigation water was
based on the reference evapotranspiration (ETo) determined daily by the Penman-Monteith method (standard FAO method) (Allen et al., 1998) by Eq. 1, using data from an automatic meteorological station installed in the area.
where:
Rn and G - daily net radiation and soil heat flux in MJ m-2,
respectively
γ - psychometric constant, kPa oC-1
Δ - slope of the saturation vapor pressure curve, kPa oC-1
T - average daily air temperature, oC
es - ea - vapor pressure deficit, kPa
U2 - mean daily wind speed (m s-1) at 2 m above soil surface
The crop evapotranspiration for irrigation management purposes in the different treatments was calculated by the Eq. 2.
(
)
(
)
(
)
2 s a
2 900
0, 408 Rn G U e e
T 273
ETo
1 0,34U
∆ − + γ −
+ =
∆ + γ +
ETc=ETo Kc×
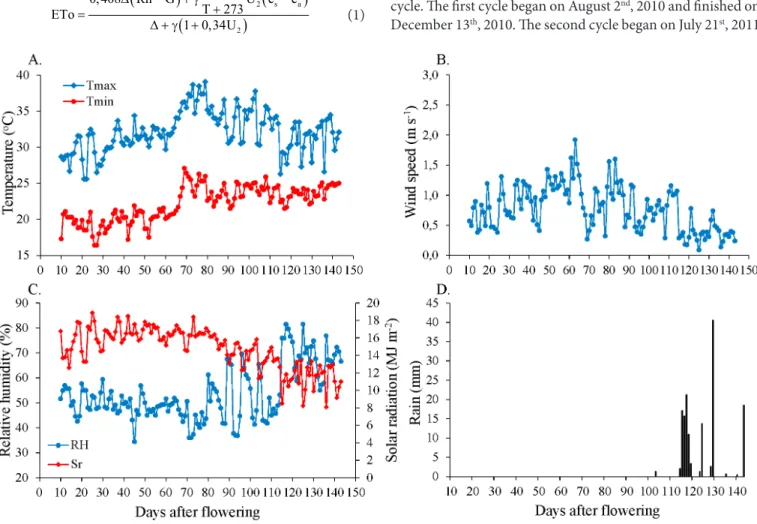
Figure 1. Maximum temperature (Tmax) and minimum temperature (Tmin) (A), mean wind speed (B), mean relative
humidity (RH) and solar radiation (Sr) (C) and rainfall (D) during first evaluation cycle in year 2010 in Ceraíma,
Guanambi, Bahia, Brazil
where:
ETc - crop evapotranspiration, mm ETo - reference evapotranspiration, mm Kc - crop coefficient
The crop coefficients (Kc), used in the evapotranspiration calculation during the evaluation phases were between 0.45 and 0.87, as used by Cotrim et al. (2011).
The main climate elements that influence reference evapotranspiration (ETo) are presented in Figure 1 for the first evaluation cycle and in Figure 2 for the second evaluation cycle. The first cycle began on August 2nd, 2010 and finished on
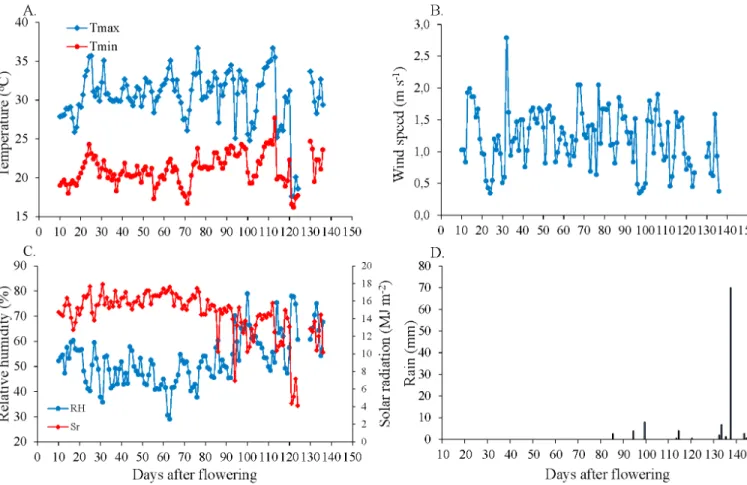
December 13th, 2010. The second cycle began on July 21st, 2011
(1)
and ended on December 5, 2011. In the second cycle, there was an extension of the three phases due to the non-uniformity in flowering that was influenced by alternation of cold and heat during the period. The solar radiation (Sr) was estimated by the Hargreaves equation (Allen et al., 1998) due to lack of data on real sunshine.
The daily irrigation time was calculated using the following equation proposed by Goodwin & Boland (2000) added with the application efficiency:
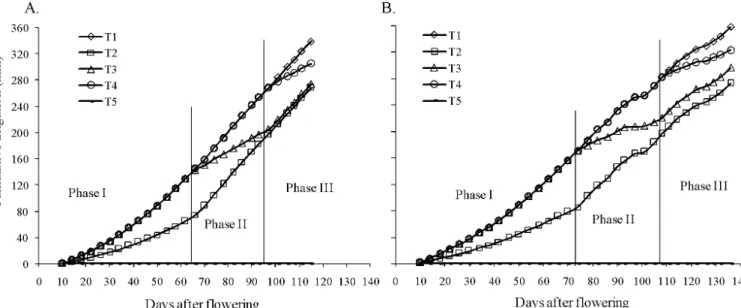
The total net water depths applied in each treatment are shown in Figure 3. The irrigation began 10 days after flowering and finished 115 and 136 days after flowering for evaluation cycles 1 and 2, respectively. From 115 and 136 days after flowering for evaluation cycles 1 and 2, there was no irrigation, since rainfall during the period provided all crop evapotranspirometric demand (Figures 1 and 2).
The water use efficiency was calculated for all treatments considering yield and the total water depth, according to the equation (Silva et al., 2009) below:
Figure 2. Maximum temperature (Tmax) and minimum temperature (Tmin) (A), mean wind speed (B), mean relative
humidity (RH) and solar radiation (Sr) (C) and rainfall (D) during second evaluation cycle in year 2011 in Ceraíma,
Guanambi, Bahia, Brazil
1 2
ETc Rp E E K1
Ti
n q Ea
× × × ×
=
× ×
where:
Ti - irrigation time, h d-1
ETc - crop evapotranspiration, mm d-1
Rp - ETc replacement according to treatment, decimal E1 - spacing between mango tree rows, m
E2 - spacing between plants within row, m n - number of microsprinklers per plant Kl - location coefficient
q - microsprinkler flow rate, L h-1
Ea - application efficiency, decimal
The location coefficient values (Kl) were calculated considering the area shaded by the plant obtaining a unit value.
Y WUE
TWD
=
where:
WUE - water use efficiency, kg ha-1 mm-1
Y - yield, kg ha-1
TWD - applied total water depth during the crop cycle, without rainfall, mm
The applied total water depth was calculated by the ratio of the net water depth and the application efficiency.
The harvested fruits, after weighing, were described accor-ding to the standards established by the Brazilian Agricultural Research Company (EMBRAPA) (Lima, 2007), considering physical quality indicators. The standard considers five mango (3)
classes: 100 (100 to 200 g), 200 (201 to 350 g), 350 (351 to 550 g), 550 (551 to 800 g) and 800 (> 800 g). The analyses were done by weight classes varying by 100 g, allowing higher detailing of fruit size distribution in each treatment.
During phases I, II and III and for all treatments the photosynthesis rate (µmol CO2 m-² s-1) were determined monthly
in the first cycle and every fifteen days in the second evaluation cycle by an infrared CO2 gas analyzer (IRGA, model LC pro, ADC, Bio scientific Ltd, Great Am well, England). In the first cycle the measurements were carried out between 10:00 and 11:00 am, and in the second evaluation cycle measurements were carried out between 13:00 and 14:00 hours. The change in schedule measurement does not influence the results, since
the aim of photosynthesis was justifying the water deficit and not compare photosynthesis between cycles.
Results and Discussion
The photosynthesis rate variation between the different treatments during the three evaluation phases is shown in Figure 4. At day 34 after flowering, in the first evaluation cycle, there were significant differences only between T5 (no irrigation) and other treatments. Conversely, T2 presented photosynthesis rate equal to that of T5 at the end of the first phase, at 63 days after flowering. No differences were observed in the photosynthesis rate between T3, T4, T1 and T2.
Figure 3. Applied irrigation water layers at regulated deficit irrigation (RDI) different treatments in ‘Tommy Atkins’ mango
tree during first (A) and second (B) evaluation cycles in years 2010 and 2011 in Ceraíma, Guanambi, Bahia, Brazil
Figure 4. Photosynthetic rate of ‘Tommy Atkins’ mango tree leaves under different treatments for the three evaluation
phases in first (A) and second (B) evaluation cycles in years 2010 and 2011 in Ceraíma, Guanambi, Bahia, Brazil
In the second phase of fruit expansion and growth, T3 presented a decline in photosynthesis rate (Figure 4A), possibly because of RDI application during this phase, while T2 expressed increase in photosynthesis rate values. Even observing these differences in absolute values, Duncan's test showed no significant differences (P > 0.05).
There were no significant differences in photosynthesis rate among treatments at 138 days after flowering in the third phase. Probably, the rain in the area influenced photosynthesis rate of plants submitted to water deficit, since photosynthesis rates measured by IRGA are punctual, varying with environmental conditions including atmospheric conditions and soil water content, at the moment of measurement, which can not reflect with reliability the history experienced by the plant (Santos et al., 2013). In the second evaluation cycle at 54 days after flowering, photosynthesis rate was lower in T5. There were no photosynthesis rate differences between T5 and T2. T3, with higher photosynthesis rate, did not differ by Duncan's test (P > 0.05) from T4 and T1. At 67 and 81 days after flowering, T1 with higher photosynthesis rate differed from the other treatments; while, T5 with lower photosynthesis rate differed from treatments T1, T2, T3 and T4. There were no differences between T4, T3 and T2.
In general, the significant differences observed between the photosynthesis rate of the treatment without irrigation (T5) and the other treatments, with lower values for T5, can be attributed to stomatal closure caused by water deficit, since this mechanism preserves plant water, by transpiration reduction, but it negatively interferes in CO2 assimilation (Taiz & Zeiger, 2009).
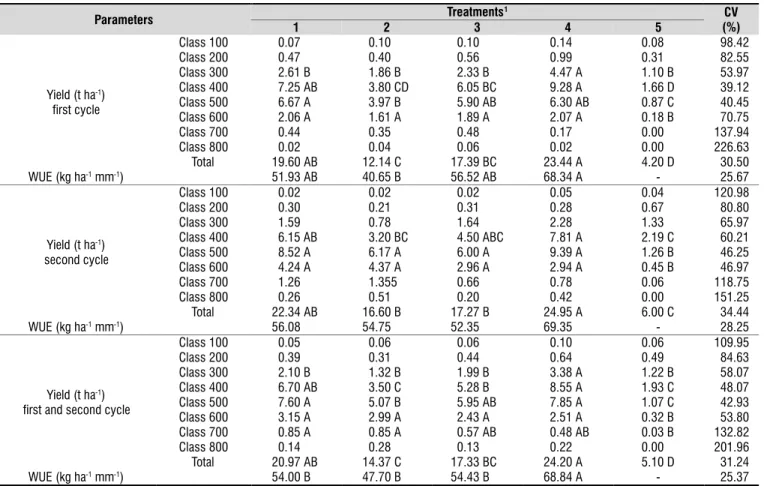
The yield of the ‘Tommy Atkins’ mango tree and water use efficiency for the different treatments in the first and second cycles and the average of the two evaluation cycles are shown in Table 2. It can be observed that in absolute values the yield was higher when RDI with 50% of ETc was applied in the third phase. Nevertheless, by Duncan's test there were no significant differences (P > 0.05) from T4 and control treatment (T1) under full irrigation in the three phases both in the first and in the second evaluation cycle. However, water use efficiency was higher when RDI was applied in the third phase.
Considering the average of the two evaluation cycles, treatment 4 with yield 15.40% higher, did not differ significantly (P > 0.05) by Duncan's test from treatment control (T1). Even in the absence of statistical differences, for the farmer, this increase can be significant in the fruit marketing in times of better prices. In contrast, when RDI at 50% of ETc is applied in
Parameters Treatments
1 CV
(%)
1 2 3 4 5
Yield (t ha-1)
first cycle
Class 100 00.07 00.10 00.10 00.14 0.08 098.42 Class 200 00.47 00.40 00.56 00.99 0.31 082.55 Class 300 02.61 B 01.86 B 02.33 B 04.47 A 1.10 B 053.97 Class 400 07.25 AB 03.80 CD 06.05 BC 09.28 A 1.66 D 039.12 Class 500 06.67 A 03.97 B 05.90 AB 06.30 AB 0.87 C 040.45 Class 600 02.06 A 01.61 A 01.89 A 02.07 A 0.18 B 070.75 Class 700 00.44 00.35 00.48 00.17 0.00 137.94 Class 800 00.02 00.04 00.06 00.02 0.00 226.63 Total 19.60 AB 12.14 C 17.39 BC 23.44 A 4.20 D 030.50 WUE (kg ha-1mm-1) 51.93 AB 40.65 B 56.52 AB 68.34 A - 025.67
Yield (t ha-1)
second cycle
Class 100 00.02 00.02 00.02 00.05 0.04 120.98 Class 200 00.30 00.21 00.31 00.28 0.67 080.80 Class 300 01.59 00.78 01.64 02.28 1.33 065.97 Class 400 06.15 AB 03.20 BC 04.50 ABC 07.81 A 2.19 C 060.21 Class 500 08.52 A 06.17 A 06.00 A 09.39 A 1.26 B 046.25 Class 600 04.24 A 04.37 A 02.96 A 02.94 A 0.45 B 046.97 Class 700 01.26 01.355 00.66 00.78 0.06 118.75 Class 800 00.26 00.51 00.20 00.42 0.00 151.25 Total 22.34 AB 16.60 B 17.27 B 24.95 A 6.00 C 034.44 WUE (kg ha-1mm-1) 56.08 54.75 52.35 69.35 - 028.25
Yield (t ha-1)
first and second cycle
Class 100 00.05 00.06 00.06 00.10 0.06 109.95 Class 200 00.39 00.31 00.44 00.64 0.49 084.63 Class 300 02.10 B 01.32 B 01.99 B 03.38 A 1.22 B 058.07 Class 400 06.70 AB 03.50 C 05.28 B 08.55 A 1.93 C 048.07 Class 500 07.60 A 05.07 B 05.95 AB 07.85 A 1.07 C 042.93 Class 600 03.15 A 02.99 A 02.43 A 02.51 A 0.32 B 053.80 Class 700 00.85 A 00.85 A 00.57 AB 00.48 AB 0.03 B 132.82 Class 800 00.14 00.28 00.13 00.22 0.00 201.96 Total 20.97 AB 14.37 C 17.33 BC 24.20 A 5.10 D 031.24 WUE (kg ha-1mm-1) 54.00 B 47.70 B 54.43 B 68.84 A - 025.37 Means followed by same capital letter within same line, do not differ significantly by Duncan’s test at 0.05 significance level.
11, Irrigation providing 100% of ETc from flowering to fruit harvest; 2, 50% of ETc from early flowering to early fruit expansion and 100% up to physiologic ripening; 3, 100% of ETc from early
flowering to fruit expansion, 50% from early expansion to early physiologic ripening and 100% at fruit physiologic ripening; 4, 100% of ETc from early flowering to late fruit expansion and 50% at physiologic ripening; 5,no irrigation
Table 2. Yield for different fruit weight classes, total yield and water use efficiency (WUE) in ‘Tommy Atkins’ mango
tree for different treatments in first and second evaluation cycles in years 2010 and 2011 in Ceraíma, Guanambi,
the fruit set phase (T2), there is significant reduction of 31.47% in total yield. Without irrigation, the average yield in the two evaluation cycles was 5.10 t ha-1, differing significantly from
treatments with irrigation. Taiz & Zeiger (2009) emphasized that under water deficit plants use to present perturbation in water relations, in nutrient uptake and inhibition in growth, in phenologic cycle, in photosynthesis and, consequently, in yield. This fact is corroborated in the present study, since the plants without irrigation presented lower photosynthesis rates (Figure 4) and lower yield.
DaMatta (2007) observed that the reduction in production is associated to a decline in photosynthesis rate. This decline, mostly, is induced by low water availability in the soil, either by a direct dehydration effect on the photosynthesis apparatus or by an indirect effect through stomata closure, restricting CO2 absorption. It can be observed in Figure 4 that photosynthesis rate in the leaves of T5 and T2 plants present smaller values than the other treatments, mainly in the fruit set phase. T3 showed lower photosynthesis rate in the fruit expansion phase. When verifying yield in T5, T2 and T3 significant reductions were noticed, which can be explained by low photosynthesis rate, according to DaMatta (2007).
These results differ from those found by Cotrim et al. (2011), who did not observe significant differences (P > 0.05) in the yield of the ‘Tommy Atkins’ mango tree between treatments with water supply of 100, 80, 60 and 40% ETc. Both studies were developed under microsprinkling and under dripping in the years of 2006 and 2007, in the same area as the present work. Given that, in the present study, there was no ground water interference, yield responded differently to the imposed treatments.
Yield for classes 100, 200, 700 and 800 did not differ significantly in the first evaluation cycle in all treatments by Duncan's test (P > 0.05). For class 300, T4 with an average yield of 4.47 t ha-1 differed from treatments T1, T2, T3 and
T5. In all treatments, class 400 yield was higher than the other classes. T4 with greater yield differed from T2, T3 and T5. Only in conditions without irrigation there was significant yield reduction in class 500, where T1 with 6.67 t ha-1 showed
greater yield, without differing from T4 and T3. For class 600, there were no significant yield differences among T1, T2, T3, and T4. Therefore, T5 with lower yield differed from the rest. Manica et al. (2001) emphasized that the weight average of ‘Tommy Atkins’ is from 444.1 to 713.7g, corroborating with the results obtained in the present study which demonstrate that better water imposition contributes for higher yield in larger weight classes.
In the second evaluation cycle, the mean yield per class presented significant differences for classes 400, 500 and 600. In the 400 weight class, there were no differences (P > 0.05) between T4, T1 and T3 by Duncan's test. For the same class, T5 with lower yield differed from T4 and T1. For the 500 and 600 weight classes, only T5 differed from the rest. It can be suggested that the total water deficit in productive phases and the partial water deficit in the fruit set phase caused yield reduction in weight classes of higher commercial value.
Considering the class yield in the two evaluation cycles, the mean yield differed among treatments for classes 300, 400, 500, 600 and 700. For 300 weight class, T4 with higher yield differed from the rest (P < 0.05) by Duncan's test. Using the same statistic parameters for 400 weight class, the yield was higher in T4 not differing from T1. In the same class, T5 and T2 with lower yield differed from T4, T1 and T3. For 500 weight class, T4 with higher yield did not differ from T1; however, both differed from T2 and T5. Significant differences were observed for 600 weight class between T5 and the other treatments. In 700 weight class, T1 and T2 presented higher yield.
Cotrim (2009), employing RDI with 100, 80, 60 and 40% of ETc in the different production phases, both under microsprinkling and under dripping, verified that the highest yields were for weight classes between 321 to 530 g. The results obtained in the present study corroborate those of Cotrim (2009), since yields in weight classes between 301 and 600 g represented 84.35; 79.35; 82.16; 85.57 and 86.49% of the total for T1, T2, T3, T4 and T5, respectively. Considering total yield for fruits between 301 and 700 g, T1, T2, T3, T4 and T5 presented 19.55, 12.88, 15.65, 20.29 and 4.54 t ha-1, respectively.
The water use efficiency for the ‘Tommy Atkins’ mango tree was influenced by the use of RDI. The best water use efficiency for the crop is when it adopts RDI use with 50% of ETc in the third phase of the tree reproduction. The use of RDI with 50% of ETc in the fruit set phase caused yield reduction and, as a consequence, water use efficiency reduction, differing from T4 (P < 0.05) by Duncan's test in the first evaluation cycle. Considering the two evaluation cycles, T4 showed greater efficiency, different from the others.
Similar results with different irrigation regimes were found by Silva et al. (2009) for ‘Tommy Atkins’ mango tree in the region of Petrolina (PE, Brazil) and by Spreer et al. (2009) for ‘Chok Anan’ mango tree in Northern Thailand. Silva et al. (2009) noticed that water use efficiency was influenced by soil water content and it might be improved by programming irrigation with 90% ETo. Spreer et al. (2009) observed that deficient irrigation (30 to 50%) results in high efficient use and great water saving which corroborates with these data.
In view of the results, it was verified that RDI brings satisfactory results both in water saving and in the yield increase of mango tree, corroborating with Spreer et al. (2007, 2009) and Silva et al. (2009). The use of RDI with 50% ETc in the third fruit development phase of ‘Tommy Atkins’ mango tree provides better fruit weight classes considering the demand of main foreign consumer markets.
Conclusions
1. Total or partial ground water deficit causes photosynthesis rate reduction of Tommy ‘Atkins mango’ tree leaves.
2. Regulated deficit irrigation application with 50% ETc during the fruit phy-siologic ripening phase results in higher yield and better water use efficiency.
3. Regulated deficit irrigation application with 50% ETc during the fruit set phase and no irrigation causes significant yield reduction.
Literature Cited
Allen, R. G.; Pereira, L. S.; Raes, D.; Smith, M. Crop evapotranspiration: guidelines for computing crop water requirements. Rome: United Nations Food and Agriculture Organization. 1998. 300p. Irrigation and Drainage Paper 56. Araújo, J. L. P. 2004. Cultivo da mangueira: Mercado
e comercialização da manga. Embrapa Semiárido, Sistemas de Produção, 2 Versão Eletrônica: <http:// sistemasdeproducao.cnptia.embrapa.br/FontesHTML/ Manga/CultivodaMangueira/mercado.htm#caracteristicas>. 21 Mar. 2011.
Cortés, C. F.; Olalla, F. M. S.; Urrea, R. L. Production of garlic (Allium sativum L) under controlled deficit irrigation in semi-arid climate. Agricultural Water Management, v.59, p.155-167, 2003.
Cotrim, C. E. Otimização da irrigação localizada em pomares de manga no semi-árido baiano. 2009. 164p. UFV: Viçosa. Thesis Doctoral
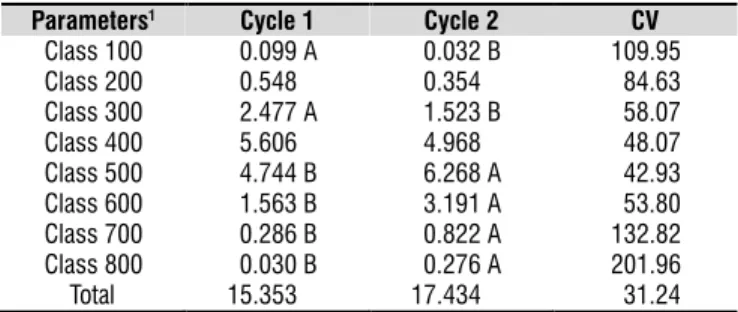
Table 3. Mean yields (t ha-1) per weight class and total
yield for evaluation cycles 1 and 2 in ‘Tommy Atkins’ mango tree in years 2010 and 2011 in Ceraíma,
Guanambi, Bahia, Brazil
Parameters1 Cycle 1 Cycle 2 CV
Class 100 00.099 A 00.032 B 109.95 Class 200 00.548 00.354 084.63 Class 300 02.477 A 01.523 B 058.07 Class 400 05.606 04.968 048.07 Class 500 04.744 B 06.268 A 042.93 Class 600 01.563 B 03.191 A 053.80 Class 700 00.286 B 00.822 A 132.82 Class 800 00.030 B 00.276 A 201.96 Total 15.353 17.434 031.24
Means followed by same capital letter within same line do not differ significantly by Duncan’s test at 0.05 significance level. 1Class 100, fruits weighing between 100 and 200 g; Class 200,
fruits weighing between 201 and 300 g; Class 300, fruits weighing between 301 and 400 g; Class 400, fruits weighing between 4001 and 500 g; Class 500, fruits weighing between 501 and 600 g; Class 600, fruits weighing between 601 and 700 g; Class 700, fruits weighing between 701 and 800 g; Class 800, fruits weighing over 800 g; Total, all fruits
Cotrim, C. E.; Coelho Filho, M. A.; Coelho, E. F.; Ramos, M. M.; Cecon, P. R. Regulated déficit irrigation and Tommy Atkins mango orchard yield under microsprinkling in Brazilian semiarid. Engenharia Agrícola, v.31, p.1052-1063, 2011.
Cuervas, J.; Canete, M. L.; Pinillos, V.; Zapata, A. J; Fernandez, M. D.; Gonzalez, M.; Hueso, J. J. Optimal dates for RDI in ‘Algerie’ loquat (Eriobotrya japonica Lindl) cultivated in southeast Spain. Agricultural Water Management, v.89, p.131–136, 2007. DaMatta, F. M. Ecophysiology of tropical tree crops: An
introduction. Brazilian Journal of Plant Physiology, v.19, p.239-244, 2007.
Fabeiro, C.; Olalla, F. M. S.; Juan, J. A. Production of muskmelon (Cucumis melo L.) under controlled deficit irrigation in a semi-arid climate. Agricultural Water Management, v.54, p.93–105, 2002.
Fabeiro, C.; Olalla, F. M. S.; López, R.; Domínguez, A. Production and quality of the sugar beet (Beta vulgaris L.) cultivated under controlled deficit irrigation conditions in a semi-arid climate. Agricultural Water Management, v.62, p.215–227, 2003.
Ferreyra, E. R.; Selles, V. G.; Peralta, A. J.; Burgos, R. L.; Valenzuela, B. J. Efectos de la restricción del riego en distintos períodos de desarrollo de la vid cv. Cabernet Sauvignon sobre producción y calidad del vino. Agricultura Técnica, v.62, p.406-417, 2002.
Gelly, M.; Recansens, I.; Girana, J.; Mata, M.; Arbones, A.; Rutat, J.; Marsal, J. Effects of stage II and post-harvest deficit irrigation on peach quality during maturation and after cold storage. Journal of the Science of Food and Agriculture, v.84, p.561–568, 2004.
González, A. M.; Bonachela, S.; Fernández, M. D. Regulated deficit irrigation in green bean and watermelon greenhouse crops. Scientia Horticulturae, v.122, p.527–531, 2009. Goodwin, I.; Boland, A. M. Scheduling deficit irrigation of fruit
trees for optimizing water use efficiency In. Deficit Irrigation Practices, Water Reports, FAO: Rome, v. 22, p.67-78, 2000. IBGE - Instituto Brasileiro de Geografia e Estatística - Sistema
IBGE de recuperação automática. <http://www.sidra.ibge. gov.br>. 21 Mar. 2011.
Iniesta, F.;Testi, L.; Orgaz, F.; Villalobos, F. J. The effects of regulated and continuous deficit irrigation on the water use, growth and yield of olive trees. European Journal of Agronomy, v.30, p.258-265, 2009.
Lima, M. A. C. 2007. Manga: Classificação. Agência de Informação Embrapa. <http://www.agencia.cnptia.embrapa. br/Agencia22/AG01/arvore/AG01_193_762006134828. html>21 Mar. 2011.
Manica, I. Clima e solo. In: Manica, I.; Icuma, I. M.; Malavolta, E.; Ramos, V. H. V.; Oliveitra Junior, M. E.; Cunha, M. M.; Junqueira, N. T. V. Manga: Tecnologia, produção, pós-colheita, agroindústria e exportação. Porto Alegre: Cinco Continentes, 2001. 617p.
McCarthy. Regulated deficit irrigation and partial rootzone drying as irrigation management techniques for grape vines. In: Deficit irrigation practices, water reports. Rome: FAO, v.22, 2000. p.79-87.
Mouco, M. A. C.; Albuquerque, J. A. S. Efeito do paclobutrazol em duas épocas de produção da mangueira. Bragantia, v.64, p.219-225, 2005.
Romero, P.; Botía, P. Daily and seasonal patterns of leaf water relations and gas exchange of regulated deficit-irrigated almond trees under semiarid conditions. Environmental and Experimental Botany, v.56, p.158-173, 2006.
Olalla, F. M. S.; Padilla, A. D.; López, R. Production and quality of the onion crop (Allium cepa L.) cultivated under controlled deficit irrigation conditions in a semi-arid climate. Agricultural Water Management, v.68, p.77-89, 2004. Santos, M. R.; Martinez, M. A. Soil water distribution and
extraction by ‘Tommy Atkins’ mango (Mangifera indica
L.) trees under different irrigation regimes. Idesia, v.31, p.7-16, 2013.
Santos, M. R.; Martinez, M. A.; Donato, S. L. R. Gas ex-changes of ‘Tommy Atkins’ mango trees under different irrigation treatments. Bioscience Journal, v.29, p.1141-1153, 2013.
Santos, M. R.; Martinez, M. A.; Donato, S. L. R.; Coelho, E. F. Fruit yield and root system distribution of Tommy Atkins mango under different irrigation regimes. Revista Brasileira de Engenharia Agrícola e Ambiental, v.18, p.362-369, 2014. Savić, S.; Stikić, R.; Radović, B. V.; Bogičević, B.; Jovanović, Z.; Šukalović, V. H. T. Comparative effects of regulated deficit irrigation (RDI) and partial root-zone drying (PRD) on growth and cell wall peroxidase activity in tomato fruits. Scientia Horticulturae, v.117, p.15-20, 2008.
Silva, V. de P. R. da; Campos, J. H. B. C.; Azevedo, P. V. de. Water-use efficiency and evapotranspiration of mango orchard grown in northeastern region of Brazil. Scientia Horticulturae, v.120, p.467–472, 2009.
Spreer, W.; Nagle, M.; Neidhart, S.; Carle, R.; Ongprasert, S; Muller, J. Effect of regulated deficit irrigation and partial rootzone drying on the quality of mango fruits (Mangifera indica L., cv. ‘Chok Anan’). Agricultural Water Management, v.88, p.173–180, 2007.
Spreer, W.; Ongprasert, S.; Hegele, M.; Wunsche, J. N.; Muller, J. Yield and fruit development in mango (Mangifera indica
L. cv. Chok Anan) under different irrigation regimes. Agricultural Water Management, v.96, p.574-584, 2009. Taiz, L.; Zeiger, E. Fisiologia vegetal. 4.ed. Porto Alegre: Artmed,