www.ccarevista.ufc.br ISSN 1806-6690
The relationship between apparent soil electrical conductivity and soil
properties
1Relação entre condutividade elétrica aparente e propriedades do solo
Domingos Sárvio Magalhães Valente2*, Daniel Marçal de Queiroz2, Francisco de Assis de Carvalho Pinto2, Nerilson Terra Santos3 e Fábio Lúcio Santos2
ABSTRACT - Precision agriculture that is based on the physical and chemical properties of soil requires a dense sampling to evaluate spatial variability in the field. This dense sampling is often expensive and time consuming. One technique to reduce the number of samples is to define management zones based on information that is collected in the field. Some researchers have demonstrated the importance of the electrical properties of soil in defining management zones. Thus, the objective of this study was to evaluate the relationship between the apparent soil electrical conductivity and soil properties in mountainous areas of coffee production. The electrical conductivity of soil was evaluated at soil depths ranging from 0.00-0.20 m (EC20) and 0.00-0.40 m (EC40) using a portable meter. The mean values of EC20 and EC40 were 1.80 mS m-1 and 1.22 mS m-1, respectively. Both EC20 and EC40 exhibited comparatively low correlations
with the soil properties, whereas higher correlations were obtained for measurements of remaining phosphorus, wherein values of 0.427 and 0.465, respectively, were obtained.
Key words: Precision agriculture. Management zone. Sensors.
INTRODUCTION
Coffee production in different countries has been transformed into a specialized field. Consumers demand a high quality product, and coffee producers are looking for ways to reduce costs and add value to their product through production systems that provide special attributes to their coffee. Precision agriculture is a technique that may be used to attain these goals. By practicing precision agriculture, it is possible to identify areas that will give higher yields and that have the potential to produce higher quality coffee. Precision agriculture can also be used to optimize the use of inputs in the production system and make business more profitable.
The use of precision agriculture that is based on the chemical and the physical properties of the soil requires a dense sampling to determine spatial variability in the field (SILVA et al., 2010). A decreased density of sampling can lead to errors in estimating the spatial variability of soil nutrients and, consequently, errors in recommendation.
One technique for reducing the number of
samples is to define management zones (MORALet al.,
2010; XIN-ZHONGet al., 2009). The field information
frequently used for defining management zones is based on a digital elevation model, maps of soil fertility that have been generated from systematic sampling in the field and yield maps that have been obtained for more than one season. Recently, some researchers (CORWIN;
LESCH, 2003; CORWINet al., 2003; CORWIN; LESCH,
2005a; CORWIN; LESCH, 2005b; CORWINet al., 2006;
LESCHet al., 2005; MORARIet al., 2009; SAEYet al.,
2009; YANet al., 2007a; YANet al., 2007b; YANet al.,
2007c; YAN et al., 2008) have demonstrated that soil
electrical parameters in the field can be used to explain
variability in the physical and chemical properties of the soil. Additionally, these parameters are reliable and easy to measure. Thus, the objective of this research was to evaluate the relationship between the apparent soil electrical conductivity and soil properties in a coffee production system that is located in a mountainous area.
MATERIAL AND METHODS
The data for apparent soil electrical conductivity were measured on a farm located in Araponga (20°42’33” S, 42°34’17” W, average altitude of 913 m a.s.l.), Minas Gerais, Brazil . This farm has an area of 86 hectares and
is planted with theCoffea arabica L. species. The average
altitude is 904 m, the area is predominantly mountainous, and the soil is classified as Typic Hapludox (SOIL SURVEY STAFF, 2006). According to the Brazilian soil classification
the soil is classified asLatossolo Vermelho Amarelo.
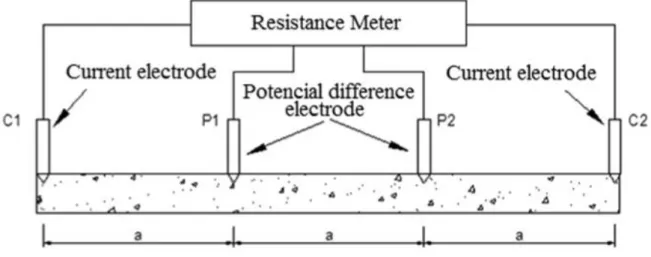
The resistivity method was used to measure the apparent soil electrical conductivity. In this method, four equally spaced electrodes are placed in contact with the soil surface. An electric current is applied between the two external electrodes and the electrical potential difference is measured in the inner electrodes, as shown in Figura 1. This configuration is commonly referred to as the Matrix Wenner configuration (CORWIN; HEDRICKX, 2002; CORWIN; LESCH, 2003).
A portable sensor, model ERM-02, manufactured by Landviser, was used to characterize the apparent soil electrical conductivity by the resistivity method. Two electrode spacing configurations were used: one with 0.20 m (EC20) spacing and another with 0.40 m (EC40) spacing.
The apparent soil electrical conductivity and the soil properties were determined in a 20.20-ha area. The EC20 and EC40 were measured at 141 points in the experimental area. The soil was sampled in the canopy projection of culture and depth of 0-0.20 meters in an
irregular mesh with 141 points (SILVA et al., 2010).
Soil samples were collected at each point in order to determine the soil texture and chemical properties. At each sampling point, three single samples were collected in a radius of 1 m around the point where the EC20 and EC40 were measured. Soil samples were analyzed in order to obtain the soil texture composition (clay, silt, and sand), electrical conductivity in the extract of soil to water ratio (1:5), moisture, and soil fertility (pH; potential
acidity; P, K, Ca2+, Mg2+, Al3+, and H-Al levels; sum of
basis; effective cation exchange capacity (CEC t); cation exchange capacity at pH 7 (CEC T); basis saturation; aluminum saturation; remaining phosphorous; and Zn, Fe, Mn, Cu, and organic matter). The relationship between the apparent electrical conductivity and the soil properties was determined by calculating the Pearson’s correlation coefficient. In order to complement the characterization of the soil, a water retention curve was determined using
Figura 2 - Location of the apparent soil electrical conductivity sampling points in the Brauna Farm
the Extractor Richards method (RICHARDS, 1965). For this test, 15 out of 141 sampling points were randomly selected to perform the measurements.
As can be observed in Figura 2, each sampling point was georeferenced using a DGPS Promark 3, which was manufactured by Magellan. For differential correction, data from the Brazilian Network for Continuous Monitoring (RBMC) were used. GNSS solution software (developed by Magellan) was used to process the data.
RESULTS AND DISCUSSION
The results of the descriptive statistics for EC20, EC40, and the some soil properties are shown in Table 1. Therein, it can be observed that the EC20 exhibited a coefficient of variation that was greater than that for EC40, which indicates a greater variability in EC20 values due to variations in soil properties near the surface.
The average values of EC20 and EC40 were 1.80
and 1.22 mS m-1, respectively. These values are relatively
Table 1 -Summary statistics of the soil data
1/EC20, apparent soil electrical conductivity for the 0 to 0.20 m layer;2/ EC40, apparent soil electrical conductivity for the 0 to 0.40 m layer;3/MC,
Moisture Content;4/ pH, active acidity in water;5/ H + AL, potential acidity;6/SB, sum of basis;7/ CEC t, effective cation exchangeable capacity; 8/ CEC T, cation exchangeable capacity at pH 7;9/ V, basis saturation;10/ m, aluminum saturation;11/OM, Organic Matter; 12/P-rem, remaining
phosphorous;13/ CEe 1:5, electrical conductivity of soil extract at 1:5.; Min = Minimum; Max = Maximum; M = Median; SD = Standard Deviation;
Ck = Coefficient of Kurtosis; Cs = Coefficient of Skewness; CV = Coefficient of Variation
Variable Average Min Max M SD Ck Cs CV
EC201 (mS m-1) 1.80 0.40 5.24 1.62 0.87 1.93 1.16 48.16
EC402 (mS m-1) 1.22 0.40 3.45 1.08 0.53 3.07 1.47 43.28
MC3 (kg kg-1) 0.31 0.21 0.42 0.31 0.04 0.35 0.24 12.40
pH4 5.76 4.83 7.74 5.69 0.50 1.52 0.88 8.63
P (mg dm-3) 4.36 1.10 22.10 3.80 2.53 17.20 3.16 57.90
K (mg dm-3) 89.21 17.00 165.00 81.00 32.06 -0.64 0.39 35.94
Ca2+ (cmol
c dm-3) 2.70 0.43 9.22 2.63 1.20 6.06 1.57 44.66
Mg2+ (cmol
c dm
-3) 1.21 0.21 3.71 1.16 0.48 4.22 1.19 39.52
Al+3 (cmol c dm
-3) 0.20 0.00 1.17 0.09 0.27 2.05 1.59 135.95
H + Al5 (cmol c dm
-3) 7.44 0.50 12.70 7.60 2.45 -0.04 0.31 32.92
SB6 (cmol
c dm-³) 4.13 0.74 11.51 3.98 1.61 2.73 1.00 38.89
CEC t7(cmol
c dm
-3) 4.33 1.71 11.51 4.20 1.44 4.23 1.38 33.30
CEC T8 (cmol
c dm
-3) 11.57 5.62 16.27 11.63 1.91 0.52 0.31 16.50
V9 (%) 36.75 6.50 94.50 34.00 15.59 1.61 0.97 42.41
m10 (%) 6.43 0.00 59.10 2.40 9.96 7.15 2.40 155.02
OM11(dag kg-1) 5.42 2.50 7.96 5.35 1.03 0.04 0.08 18.93
P-rem12 (mg L-1) 19.26 11.30 31.60 18.90 4.17 0.26 0.68 21.64
Zn (mg dm-3) 2.05 0.35 5.75 1.93 1.17 0.26 0.80 57.21
Fe (mg dm-3) 45.13 18.80 120.30 41.70 17.09 4.67 1.72 37.87
Mn (mg dm-3) 9.26 2.30 42.30 8.00 5.73 9.60 2.45 61.94
Cu (mg dm-3) 0.86 0.10 2.88 0.79 0.53 1.69 1.12 61.25
CEe1:513 (mS m-1) 5.00 4.00 9.00 5.00 1.00 0.68 0.72 16.71
Coarse Sand (dag kg-1) 26.78 17.00 41.00 27.00 4.39 0.02 0.28 16.41
Fine Sand (dag kg-1) 12.16 7.00 20.00 12.00 1.90 1.36 0.48 15.59
Silt (dag kg-1) 7.49 4.00 15.00 7.00 2.04 0.91 0.89 27.30
Clay (dag kg-1) 53.57 39.00 66.00 54.00 4.90 -0.04 0.23 9.14
of saline soils at 135.7 and 86.18 mS m-1, as shown by Yan
et al. (2007c) and Yan et al. (2008). In non-saline soils,
Machado et al. (2006) and Aimrun et al. (2007) have
obtained average apparent soil electrical conductivity
values of 5.2 and 5.67 mS m-1, respectively. These
mean values of electrical conductivity are still higher than those found in this study. However, much lower than the values determined in saline soils.
Despite the low values of electrical conductivity, the average apparent soil electrical conductivity values were well within the range of the electrical conductivity of soil extract (1:5) that were determined
in the laboratory, which confirm the results from other studies (CORWIN; LESCH, 2003; CORWIN; LESCH,
2005b; MORAL et al., 2010; YAN et al., 2007c).
The minimum and maximum values of
conductivity were 0.40 and 5.24 mS m-1, respectively.
This amplitude is less than that obtained by Machado
et al. (2006), who recorded minimum and maximum
conductivities of 1.90 and 13.70 mS m-1, respectively.
Aimrun et al. (2007) obtained minimum and the
maximum values of 0.90 and 64.10 mS m-1, whereas
Faulin and Molin (2006) obtained values of apparent soil
electrical conductivity ranging from 0.60 to 16,6 mS m-1.
These differences in amplitude may not relate to soil moisture conditions. As shown in Table 2, for the 15 water retention curves that were obtained in this study, it was found that the soil during the electrical conductivity measurements was at or near field capacity. Thus, the amplitude of variation was low, probably due to the low cation exchange capacity, as shown in Table 1.
The ranking of the Pearson’s correlation coefficients between EC20, EC40, and the soil properties are presented in Table 3. The results in Table 3 indicate that EC20 and EC40 strongly correlate to each other (0.896), which agree with result obtained by Vitharana
et al. (2008) in a similar study. EC40 exhibited higher correlation coefficients with most soil properties in comparison to EC20. This may be due to major changes in the physical and the chemical characteristics that occur near the soil’s surface, which increase the oscillation of EC20 and reduce the coefficient of correlation.
In general, EC20 and EC40 had low correlations with soil properties. The highest correlation coefficients for EC20 and EC40 were found for remaining phosphorus, which had values of 0.427 and 0.465, respectively. Moreover, EC20 and EC40 did not show significant correlations with the physical properties of soil, except for the silt content.
The recommended phosphorus dosage for crops can be obtained as a function of the remaining phosphorus and the clay content. In soils that have been classified as Typic Hapludox (SOIL SURVEY STAFF, 2006), higher clay and oxide contents correlate with lower remaining phosphorus contents due to a higher phosphorous adsorption capacity of the soil. If silt and sand were exclusively composed of primary minerals, soil with a high content of these two types of particles would be expected to have a low phosphorous adsorption
capacity (DONOGEMMAet al., 2008); however, Typic
Hapludox soils have silt-sized microaggregates that are
formed by the cementing action of Fe and Al3+ oxides.
Thus, the apparent soil electrical conductivity becomes an alternative for the estimation of the available phosphorus.
Several authors (LESCH et al., 2005;
MACHADO et al., 2006; MOLIN; CASTRO, 2008)
have shown strong correlations between the soil electrical conductivity and the clay content, whereas
Table 2 - Soil retention curve
Soil Sample Number Soil Moisture (kg kg-1)
Potential kPa
-10 -30 -100 -500 -1500
---Soil Moisture (kg kg-1
)---1 0.344 0.367 0.331 0.306 0.278 0.241
2 0.337 0.312 0.293 0.268 0.24 0.229
3 0.357 0.327 0.301 0.276 0.248 0.226
Table 3 - Ranking of the Pearson’s correlation coefficient between the soil properties and apparent soil electrical conductivities for 0 to 0.20-m and 0 to 0.40-m soil layers
1/ EC20, apparent soil electrical conductivity for the 0 to 0.20 m layer;2/ EC40, soil apparent electrical conductivity for the 0 to 0.40 m layer;3/P-rem,
remaining phosphorous;4/ V, basis saturation;5/ CEC t, effective cation exchangeable capacity;5/SB, exchangeable sum of basis;7/ H + AL, potential
acidity; 8/ pH, active acidity in water;9/OM, organic matter;10/ m, aluminum saturation;11/ CEC T, cation exchangeable capacity at a pH of 7;12/ CEe
1:5, electrical conductivity in the extract of soil to water ratio (1:5); NS - Not Significant at the 5%
Ranking Soil Property EC20(1) Ranking Soil Property EC40(2)
1 EC40 0.896 1 EC20 0.896
2 P-rem(3) 0.427 2 P-rem 0.465
3 Mn 0.377 3 Mn 0.457
4 V(4) 0.375 4 V 0.402
5 CEC t(5) 0.352 5 CEC t 0.393
6 Ca2+ 0.346 6 Ca2+ 0.386
7 SB(6) 0.342 7 SB 0.374
8 H + Al(7) -0.314 8 K 0.318
9 K 0.287 9 H + Al -0.297
10 pH(8) 0.275 10 pH 0.286
11 Mg2+ 0.231 11 Zn 0.245
12 OM(9) -0.205 12 Mg2+ 0.23
13 m(10) -0.202 13 Silt 0.195
14 Silt 0.194 14 m -0.179
15 Zn 0.174 15 OM -0.178
16 Fe -0.174 16 P 0.158
17 Al3+ -0.161 17 CEe(1:5) 0.156
18 Soil Moisture NS 18 Soil Moisture NS
19 P NS 19 Al3+ NS
20 CEC T(11) NS 20 CEC T NS
21 Cu NS 21 Fe NS
22 CEe(1:5)(12) NS 22 Cu NS
23 Coarse Sand NS 23 Coarse Sand NS
24 Fine Sand NS 24 Fine Sand NS
25 Clay NS 25 Clay NS
others (AIMRUNet al., 2007; CARROLL; OLIVER,
2005; CORWIN; LESCH, 2005b; CAMBOURISet al.,
2006; CORWIN et al., 2006; MORARI et al., 2009)
have not found any such correlations. The results of this study indicate that the correlation between apparent soil electrical conductivity and clay content was either low or absent. The observed low correlation coefficient may be due to the low coefficient of variation of the clay content. Although electrical conductivity did not exhibit any correlation with the clay content, its correlation with the remaining phosphorus was related to variability in physical-chemical, mineralogical, and
soil texture characteristics (EBERHARDTet al., 2008;
SILVAet al., 2010; SOUZAet al., 2006).
content that were obtained in the present study are also considered to be low, with values of 9.14 and 12.40%, respectively. These findings explain why there was no relationship between the moisture content and the soil electrical conductivity.
CONCLUSIONS
1. The average values of apparent soil electrical conductivity were low compared to values observed for saline soils and soils with high values of cation exchange capacity;
2. The apparent soil electrical conductivity using electrode distances of 0.00 to 0.20 m and 0.00 to 0.40 m exhibited strongly correlate to each other;
3. The highest correlation coefficient was found between the apparent soil electrical conductivity and the remaining phosphorus;
4. There was no significant correlation between the apparent soil electrical conductivity and the clay content;
5. The soil moisture content was not correlated with the apparent soil electrical conductivity.
ACKNOWLEDGMENTS
The authors thank CNPq (The Brazilian National Counsel for Research and Development), FAPEMIG (The Minas Gerais State Foundation for Research), and Brauna Farm and CENTREINAR (the Brazilian National Center for Training in the Post-Harvest Area) for their support.
REFERENCES
AIMRUN, W. et al. Spatial variability of bulk soil electrical conductivity in a Malaysian paddy field: key to soil management.
Paddy Water Environ, v. 05, n. 02, p. 113-121, 2007.
CORWIN, D. L. et al. Monitoring management-induced spatio-temporal changes in soil quality through soil sampling directed by apparent electrical conductivity. Geoderma, v. 131, n. 03/04, p. 369-387, 2006.
CORWIN, D. L.; HENDRICKX, J. M. H. Electrical resistivity: Wenner array.In: SILVA, J. S. Methods of soil analysis part 4 physical methods. Madison, Wisconsin, USA: Soil Sience society of America, 2002. p. 1282-1287. CORWIN, D. L.; LESCH, S. M. Characterizing soil spatial variability with apparent soil electrical conductivity part II. Case study.Computer and Electronics in Agriculture, v. 46, n. 01/03, p. 135-152, 2005b.
CORWIN, D. L.; LESH, S. M. Apparent soil electrical conductivity measurements in agricultural. Computers and Electronics in Agriculture, v. 46, n. 01/03, p. 11-43, 2005a. CORWIN, D. L.; S. M. LESCH. Application of soil electrical conductivity to precision agriculture: theory, principles, and guidelines. Agronomy Journal, v. 95, n. 03, p. 471-471, 2003.
DONAGEMMA, G. K.et al. Solution equilibrium phosphorus in clay and silt fractions of oxisols after particle size analysis pre-treatments.Revista Brasileira de Ciência do Solo, v. 32, n. 04, p. 1785-1791, 2008.
EBERHARDT, D. N. et al. Influence of soil texture and mineralogy on phosphorus retention in cerrado oxisols under pasture.Revista Brasileira de Ciência do Solo, v. 32, n. 03, p. 1009-1016, 2008.
FAULIN, G. D. C.; MOLIN, J. P. Amplitude dos valores da umidade e sua influência na mensuração da condutividade elétrica do solo. In: CONGRESSO BRASILEIRO DE AGRICULTURA DE PRECISÃO. 2006. São Pedro, SP.Resumos...São Pedro, SP, 2006. LESCH, S. M. et al. Apparent soil electrical conductivity mapping as an agricultural management tool in arid zone soils.Computer and Electronics in Agriculture, v. 46, n. 01/03, p. 351-378, 2005.
BLACK, C.; ESMINGER, L. E. Methods of soil analysis. Madison: American Society of Agronomy, 1965. p. 131-137. SAEY, T. et al. A Pedotransfer function to evaluate the soil profile textural heterogeneity using proximally sensed apparent electrical conductivity.Geoderma, v. 150, n. 03/04, p. 389-395, 2009.
SILVA, S. A.et al. Variabilidade espacial do fósforo e das frações granulométricas de um Latossolo Vermelho Amarelo. Revista Ciência Agronômica, v. 41, n. 01, p. 01-08, 2010.
SOUZA, R. F.et al. Liming and organic fertilizer: influence on phosphorus adsorption in soils.Revista Brasileira de Ciência do Solo, v. 30, n. 06, p. 975-983, 2006.
SOIL SURVEY STAFF. Keys to Soil Taxonomy. 10ed. USDA/ NCRS, Washington, D. C., USA, 2006.
VITHARANA, U. W. A. et al. Key soil and topographic properties to delineate potential management classes for precision agriculture in the European loess area.Geoderma, v. 143, n. 01/02, p. 206-215, 2008.
XIN-ZHONG, W.et al. Determination of management zones for a tobacco field based on soil fertility. Computers and Electronics in Agriculture, v. 65, n. 02, p. 168-175, 2009. YAN, L. et al. Delineation of site-specific management zones using fuzzy clustering analysis in a coastal saline land.
Computers and Electronics in Agriculture, v. 56, n. 02, p. 174-186, 2007c.
YAN, L. et al. Determination of potential management zones from soil electrical conductivity, yield and crop data.
Journal of Zhejiang University Science B, v. 09, n. 01, p. 68-76, 2008.
YAN, L. et al. Optimized spatial sampling scheme for soil electrical conductivity based on variance quad-tree (VQT) method. Agricultural Sciences in China, v. 06, n. 12, p. 1463-1471, 2007b.