Characteristics of the wool produced by ewes raised for meat production
Edson Luis de Azambuja Ribeiro1, Cleber Cassol Pires2, Ivone Yurika Mizubuti1, Leandro das Dores Ferreira da Silva1, Filipe Alexandre Boscaro de Castro3, Natália Albieri Koritiaki4,
Elzânia Sales Pereira5, Andréa Pereira Pinto5
1 Universidade Estadual de Londrina, Departamento de Zootecnia, Londrina, PR, Brasil. 2 Universidade Federal de Santa Maria, Departamento de Zootecnia, Santa Maria, RS, Brasil.
3 Universidade Norte do Paraná, Programa de Pós-graduação em Saúde e Produção de Ruminantes, Arapongas, PR, Brasil. 4 Universidade Estadual de Londrina, Programa de Pós-graduação em Ciência Animal, Londrina, PR, Brasil.
5 Universidade Federal do Ceará, Departamento de Zootecnia, Fortaleza, CE, Brasil.
ABSTRACT - The objective of this study was to evaluate the characteristics of wool produced by ewes of different genetic groups, ages, and reproductive statuses. A total of 115 ewes, of the following genetic groups, were used: 10 Corriedale, 37 Hampshire Down, 26 ½ Hampshire Down + ½ Corriedale, 24 ½ Ile de France + ½ Corriedale, and 18 ½ Suffolk + ½ Corriedale. Age was determined by the number of permanent incisors, ranging from four teeth to eight teeth. Ewes were further classified by their reproductive status into: lambed, having reared one lamb; and not-lambed. Hampshire and half-blood Suffolk ewes were heavier (53.2 and 52.7 kg, respectively), while Corriedale animals were lighter (40.1 kg). Older ewes and not-lambed ewes were heavier as well. Fleece weight was higher for the Corriedale and its crossbred ewes (average of 2.9 kg). Genetic group did not affect yield after scouring (61.6%). Ewe age, reproductive status, and year of evaluation did not affect greasy fleece weight or yield. Fiber diameter and number of crimps were not affected by any tested variables, with mean values of 29.8 μm and 5.8 crimps per centimeter, respectively. Staple length was influenced only by genetic group, in which the Hampshire ewes showed the shortest staple (6.2 cm). In general, the character was classified as good to regular, and the worst was found in the Hampshire. That genetic group grew rough wool, while the others were rated as slightly soft to rough. All genetic groups presented wools with some medullation. The majority of the samples were classified from “Cruza 1” to “Cruza 3” in all five groups and, for quality, the majority of the samples were rated as Good. Wool produced by meat breeds presents variations of quantity and quality that should be considered by producers and industry.
Key Words: crossbreeding, fiber,Ovis aries, sheep
ISSN 1806-9290
www.sbz.org.br R. Bras. Zootec., 44(11):405-411, 2015
Received May 8, 2015 and accepted August 9, 2015. Corresponding author: [email protected]
http://dx.doi.org/10.1590/S1806-92902015001100005
Copyright © 2015 Sociedade Brasileira de Zootecnia. This is an Open Access article distributed under the terms of the Creative Commons Attribution License (http://creativecommons.org/licenses/by/4.0/), which permits unrestricted use, distribution, and reproduction in any medium, provided the original work is properly cited.
Introduction
During the last two decades, the number of sheep has been increasing in Brazil, after a period of severe reduction in population size due to an international crisis in the wool production chain. This fact dramatically reduced the prices paid for wool. Consequently, sheep producers changed their attention to meat production (Viana and Waquil, 2013; Gonzaga et al., 2014).
Some producers are still raising fine wool breeds, but in order to improve their income, part of the females are bred to meat rams. In some cases, all lambs, males and females, are destined to be slaughtered. However, in other cases, the half-blood ewes are kept as breeding females. Greater responses in weights and in daily weight
gains for crossbred animals are presented in the literature (Cunha et al., 2000).
However, as pointed out by Ribeiro et al. (1997), to improve the efficiency of the sheep husbandry, it is necessary that all products be accounted. Despite the poor quality of the wool produced by meat breeds, the utilization of the wool by the textile industry is still possible. Moreover, in order to better classify and remunerate this kind of wool, it is necessary to understand its characteristics, including defects.
Factors affecting the production and the quality of the wool from sheep breeds selected for meat production, or crossbred animals from these breeds, are not well defined or even studied. Therefore, the objective of this study was to evaluate the effects of genetic group, reproductive status, and age on wool production and quality.
.
Material and Methods
located approximately at 23°23' S latitude and 51°11' W longitude. A total of 115 ewes, of the following genetic groups, were used: 10 Corriedale, 37 Hampshire Down, 26 ½ Hampshire Down + ½ Corriedale, 24 ½ Ile de France + ½ Corriedale, and 18 ½ Suffolk + ½ Corriedale. It was not possible to determine their age at the time in years and months, so the animals were classified by the number of permanent incisors, ranging from four to eight teeth. Ewes were further classified by their reproductive status into: lambed, having reared one lamb (99 ewes); and not lambed (16 ewes). Data originated from two production years: 2001 (57 ewes) and 2002 (58 ewes).
The flock was kept all year round on a Coast-cross pasture (Cynodon dactylon (L.) Pers). However, during the winter (dry season), sorghum silage was also supplied as supplement to the animals. Water and mineralized salt were also permanently available.
Shearing was performed in December, after weaning and after a growth period of 12 months. Fleece was weighed immediately after shearing, and one sample of around 100 g was taken from the right side of the animal. The fleece was weighed after skirting, i.e., after the removal of the belly and leg wool, which was weighed separately. Samples were put in plastic bags and sent to the laboratory of wool analysis for subsequent analyses. Ewes were also weighed just after being shorn.
The objective measurements analyzed in the wool samples were: yield after scouring (or percentage of clean wool fibers present in the greasy sample); average fiber diameter (in micrometers); staple length; and crimps per centimeter. And the subjective measurements were: character, defined as the distinctness and depth and evenness of the waves in the staple (classified as great, good, regular, or weak/absent); color after washing (classified as normal/white, cream, yellow, or canary yellow); softness to touch (classified as soft, slightly soft, rough, or very rough); medullation (classified as absent, slightly medullated, medullated, and strongly medullated); quality (classified as “super” = the best, “special”, “good”, or “current” = the worst); and grade (classified as “merina” = the best, “amerinada”, “prima a”, “prima b”, “cruza 1”, “cruza 2”, “cruza 3”, “cruza 4”, or “cruza 5” = the worst). Classifications for quality and grade followed the Brazilian commercial standards.
The response variables that showed homogeneity of variances and normal distribution for the errors were subjected to analysis of variance according to the following statistical model: Yijklm = μ + Gi + Aj + Rk + Yl+ GAij + GRik
+ GYil + ARjk + AYjl + RYkl + Eijklm, in which Yijklm is the value
observed for the response variable; μ is the overall mean;
Gi is the effect of genetic group i; Aj is the effect of age j;
Rk is the effect of reproductive status k; Yl is the effect of
year l; GAij is the genetic group × age interaction; GRik is the
genetic group × reproductive status interaction; GYil is the
genetic group × year interaction; ARjk is the age × reproductive
status interaction; AYjl is the age × year interaction; RYkl is
the reproductive status × year interaction; and Eijklm is the
random error associated with each observation. As the interactions between effects were not significant (P>0.05), they were removed from the final statistical model. For these analyses, the GLM procedure of SAS (Statistical Analysis System, version 9.2) was used.
The variables character, color after washing, softness to touch, medullation, and grade and quality of wool are qualitative variables and do not present homogeneity of variances and normality of residues. For this reason, descriptive statistical analyses and the Kruskal-Wallis and Mann-Whitney tests were performed. The variables were compared among genetic groups, ages, reproductive statuses, and years. Analyses were performed using the NPAR1WAY procedure of SAS (Statistical Analysis System, version 9.2).
Results
Body weight was affected (P<0.05) by genetic group, ewe age, reproductive status, and year (Table 1). The heaviest weight was found in Hampshire and half-blood Suffolk ewes, and the lighest were the Corriedale. The crossbred ½ Hampshire Down + ½ Corriedale and ½ Ile de France + ½ Corriedale ewes had intermediate weight compared with the purebred ewes.
Age also affected (P<0.05) body weight, in which the younger females were lighter than the older ones (Table 1). The reproductive status affected (P>0.05) body weight, in which the ewes that lambed and reared one lamb were 9.7% lighter than the ones that did not lamb. Year was an important source of variation (P<0.05) on ewes weight.
For wool production traits, the results show that genetic group affected (P<0.05) the greasy fleece and skirted wool (from belly and legs) weights; however, it did not affect yield after scouring (Table 1). Corriedale and crossbred Corriedale ewes had similar fleece weights and produced more than Hampshire Down ewes.
Ewe age, reproductive status, and year of evaluation did not affect (P>0.05) greasy fleece weight or yield. These results are quite surprising, especially the reproductive status on fleece weight. In the present study, the only difference (P<0.05) was found for skirted wool weight.
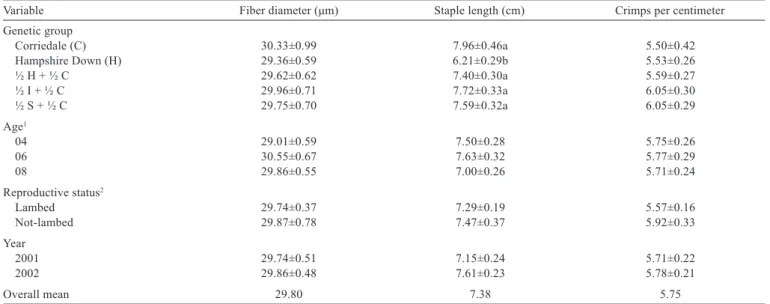
affected (P>0.05) by genetic group (Table 2). The only difference observed (P<0.05) was for staple length, in which the purebred Hampshire ewes presented the shortest staple; there were no differences among the other genetic groups.
Ewe age, reproductive status, and year did not affect (P>0.05) fiber diameter, staple length, or crimps per centimeter (Table 2).
For the subjective measurements of the wool, genetic group only did not affect (P>0.05) color after washing
(Table 3). In general, the character was classified as good to regular, and the worst result was found in the Hampshire wool. All genetic groups presented wool with some medullation.
Ewe age and reproductive status did not affect (P>0.05) the subjective measurements of the wool (Table 3). On the other hand, year was an important source of variation for character and medullation.
There were no differences (P>0.05) among the five genetic groups for grade and quality classifications (Table 4).
Table 1 - Means and standard errors for body weight (kg), wool production (kg), and yield after scouring (%)
Variable Body weight (kg) Greasy fleece weight (kg) Skirted wool weight (kg) Yield (%)
Genetic group
Corriedale (C) 40.06±2.56c 3.02±0.24a 0.49±0.07a 59.89±1.76
Hampshire Down (H) 53.25±1.54a 2.29±0.15b 0.31±0.04bc 61.76±1.05
½ H + ½ C 45.94±1.60b 2.94±0.15a 0.38±0.04ab 62.26±1.10
½ I + ½ C 47.33±1.85b 2.84±0.18a 0.31±0.05bc 61.85±1.27
½ S + ½ C 52.74±1.81a 2.78±0.17a 0.25±0.05c 62.32±1.24
Age1
04 42.95±1.53c 2.77±0.15 0.31±0.04 61.98±1.05
06 47.83±1.74b 2.94±0.17 0.38±0.05 62.35±1.19
08 52.81±1.42a 2.62±0.14 0.36±0.04 60.52±0.97
Reproductive status2
Lambed 45.42±0.96b 2.76±0.09 0.24±0.03b 60.96±0.66
Not-lambed 50.31±2.02a 2.79±0.19 0.45±0.06a 62.27±1.39
Year
2001 44.80±1.32b 2.86±0.13 0.41±0.04a 62.11±0.91
2002 50.93±1.23a 2.70±0.12 0.29±0.03b 61.13±0.85
Overall mean 47.86 2.78 0.35 61.62
a, b, c = P<0.05.
I - Ile de France; S - Suffolk.
1 Number of permanent incisors.
2 Lambed - ewes that lambed and reared one lamb.
Table 2 - Means and standard errors for objective measurements of wool
Variable Fiber diameter (μm) Staple length (cm) Crimps per centimeter
Genetic group
Corriedale (C) 30.33±0.99 7.96±0.46a 5.50±0.42
Hampshire Down (H) 29.36±0.59 6.21±0.29b 5.53±0.26
½ H + ½ C 29.62±0.62 7.40±0.30a 5.59±0.27
½ I + ½ C 29.96±0.71 7.72±0.33a 6.05±0.30
½ S + ½ C 29.75±0.70 7.59±0.32a 6.05±0.29
Age1
04 29.01±0.59 7.50±0.28 5.75±0.26
06 30.55±0.67 7.63±0.32 5.77±0.29
08 29.86±0.55 7.00±0.26 5.71±0.24
Reproductive status2
Lambed 29.74±0.37 7.29±0.19 5.57±0.16
Not-lambed 29.87±0.78 7.47±0.37 5.92±0.33
Year
2001 29.74±0.51 7.15±0.24 5.71±0.22
2002 29.86±0.48 7.61±0.23 5.78±0.21
Overall mean 29.80 7.38 5.75
a, b = P<0.05.
I - Ile de France; S - Suffolk.
1 Number of permanent incisors.
The great majority of the samples were classified from “Cruza 1” to “Cruza 3” in all five groups. The sum of these three grades (Cruza 1 + Cruza 2 + Cruza 3) for the samples were 70.0, 67.5, 88.4, 75.1, and 94.4% for the Corriedale, Hampshire Down, ½ Hampshire Down + ½ Corriedale, ½ Ile de France + ½ Corriedale, and ½ Suffolk + ½ Corriedale genetics groups, respectively.
For quality, the majority of the samples were classified as Good. The mean percentage across all genetic groups was 73.9.
There were no differences (P>0.05) in the grades and qualities according to age and reproductive status of the ewes (Table 5). Following the results for genetic group, the majority of the samples were classified between “Cruza 1” and “Cruza 3” and as Good. The same occurred according to year (P>0.05, means not presented in Tables), in which 73.7 and 82.6% of the samples were classified into the three cited grades, and 61.4 and 82.4% were classified as Good, for the years 2001 and 2002, respectively.
Table 3 - Means and standard errors for subjective measurements of wool
Variable Character3 Color after washing3 Softness to touch3 Medullation3
Genetic group
Corriedale (C) 2.64±0.23b 2.53±0.18 2.48±0.20b 2.21±0.31ab
Hampshire Down (H) 3.46±0.15a 2.36±0.11 2.95±0.13a 1.73±0.19b
½ H + ½ C 3.05±0.15ab 2.31±0.12 2.64±0.13b 2.34±0.20a
½ I + ½ C 2.94±0.17b 2.43±0.13 2.57±0.14b 2.65±0.22a
½ S + ½ C 2.98±0.16b 2.28±0.13 2.44±0.14b 2.53±0.22a
Age1
04 2.88±0.14 2.50±0.11 2.63±0.12 2.13±0.19
06 2.92±0.16 2.35±0.13 2.78±0.14 2.18±0.21
08 3.24±0.13 2.29±0.10 2.45±0.11 2.56±0.17
Reproductive status2
Lambed 2.97±0.09 2.31±0.07 2.62±0.08 2.12±0.12
Not-lambed 3.05±0.18 2.45±0.15 2.61±0.16 2.46±0.25
Year
2001 3.15±0.12a 2.38±0.09 2.58±0.10 2.85±0.16a
2002 2.87±0.12b 2.38±0.09 2.66±0.10 1.73±0.15b
Overall mean 3.01 2.38 2.62 2.29
a, b = P<0.05.
I - Ile de France; S - Suffolk.
1 Number of permanent incisors.
2 Lambed - ewes that lambed and reared one lamb.
3 Character (1 = great, 2 = good, 3 = regular, 4 = weak/absent); Color after washing (1 = normal/white, 2 = cream, yellow, 3 = canary yellow); Softness to touch (1 = soft, 2 = slightly
soft, 3 = rough, 4 = very rough); Medullation (1 = absent, 2 = slightly medullated, 3 = medullated, 4 = strong medullated).
Table 4 - Percentages (and numbers) of samples of wools classified by grade and quality according to genetic group
I - Ile de France; S - Suffolk. P>0.05.
Variable Genetic group
Corriedale (C) Hampshire Down (H) ½ H + ½ C ½ I + ½ C ½ S + ½ C
Grade
Merino 0.00 (0) 0.00 (0) 0.00 (0) 0.00 (0) 0.00 (0)
Amerinada 0.00 (0) 0.00 (0) 0.00 (0) 0.00 (0) 0.00 (0)
Prima A 10.00 (1) 5.41 (2) 11.54 (3) 8.33 (2) 0.00 (0)
Prima B 10.00 (1) 21.62 (8) 0.00 (0) 4.17 (1) 5.56 (1)
Cruza 1 20.00 (2) 27.03 (10) 34.62 (9) 29.17 (7) 44.44 (8)
Cruza 2 20.00 (2) 29.73 (11) 34.62 (9) 29.17 (7) 27.78 (5)
Cruza 3 30.00 (3) 10.81 (4) 19.23 (5) 16.67 (4) 22.22 (4)
Cruza 4 10.00 (1) 5.41 (2) 0.00 (0) 12.50 (3) 0.00 (0)
Cruza 5 0.00 (0) 0.00 (0) 0.00 (0) 0.00 (0) 0.00 (0)
Total 100 (10) 100 (37) 100 (26) 100 (24) 100 (18)
Quality
Super 0.00 (0) 0.00 (0) 0.00 (0) 0.00 (0) 0.00 (0)
Special 10.00 (1) 0.00 (0) 4.00 (1) 4.17 (1) 0.00 (0)
Good 80.00 (8) 58.06 (18) 76.00 (19) 66.67 (16) 88.89 (16)
Current 10.00 (1) 41.94 (13) 20.00 (5) 29.17 (7) 11.11 (2)
Discussion
Differences in body weight were expected because the Hampshire Down, as a meat-type breed, was selected for weight gain and or body weight, while the Corriedale was formed to be a double-purpose breed, wool and meat. Consequently, selection for body size was not the first goal in this breed. In the same way, Suffolk is known as one of the largest breeds raised in Brazil (Cunha et al., 2000; ARCO, 2013). The average weight of the Hampshire Down ewes in this study (53.2 kg) is slightly lower than the weight observed (54.8 kg) by Ribeiro et al. (1997) for ewes of the same breed.
The intermediate weights presented by the crossbred Hampshire Down and Ile de France ewes probably indicate that there was no heterosis for body weight. However, crossing ewes of a double-purpose breed, as Corriedale, with meat-type breeds, as Ile de France, Hampshire Down, and Suffolk, can be practiced to improve meat production. On the other hand, it is important to stay alert because when these half-blood females are incorporated at the flock, as reproductive ewes, the feed requirements will also increase, mainly for maintenance. This happens because of the heavier weights of these animals.
Regarding the lower weights of younger ewes, it can be considered that the four-teethed ewes were still growing, and when the nutrition is not optimum, the development of the body structure is somehow decreased (Castro et al., 2012a). In this situation, the adult weights can also be lower. In the same way, lactation is a period with great energy demand, and ewes usually lose condition score and
weight, during this phase (Castro et al., 2012b). Studying a purebred Hampshire Down flock, Ribeiro et al. (1997) observed that dry ewes were 10.6% heavier (P<0.05) than those that reared lambs.
Environmental aspects, such as precipitation and temperature, can affect pasture production and quality, as well as the health condition of the animals (Ramos et al., 2004; Ribeiro et al., 2008).
For wool-production traits, as pointed out before, the Corriedale breed was formed as a double-purpose breed, in which fleece production was, and still is, an important trait considered.
Differences for wool production traits among ages in Hampshire ewes were not observed by Ribeiro et al. (1997); however, they observed that dry ewes (not-lambed) produced 19% more wool than the ewes that reared one lamb.
Summer and McCall (1989) observed that ewes rearing lambs, single or twins, produced less wool than ewes that did not rear lambs. The authors also concluded that despite the apparent advantage of dry ewes for wool production, the sum of wool and lamb would be more profitable for the entire system. However, this may vary, depending on the prices paid in a particular year.
In the study of Ribeiro et al. (1997), the average staple length for Hampshire ewes was 7.5 cm, close to the overall mean at the present study, but much longer than the average observed for the Hampshire (6.2 cm).
The lack of differences for age, reproductive status, and year on fiber diameter, staple length, and crimps per centimeter are in accordance with Ribeiro et al. (1997). However, these authors observed smaller fiber diameter for
Table 5 - Percentages (and numbers) of samples of wools classified by grade and quality according to age and reproductive status
Variable Age Reproductive status
4 teeth 6 teeth 8 teeth Lambed Not-lambed
Grade
Merino 0.00 (0) 0.00 (0) 0.00 (0) 0.00 (0) 0.00 (0)
Amerinada 0.00 (0) 0.00 (0) 0.00 (0) 0.00 (0) 0.00 (0)
Prima A 7.41 (2) 0.00 (0) 10.00 (6) 7.07 (7) 6.25 (1)
Prima B 3.70 (1) 7.14 (2) 13.33 (8) 11.11 (11) 0.00 (0)
Cruza 1 55.56 (15) 28.57 (8) 21.67 (13) 27.27 (27) 56.25 (9)
Cruza 2 25.93 (7) 35.71 (10) 28.33 (17) 32.32 (32) 12.50 (2)
Cruza 3 3.70 (1) 25.00 (7) 20.00 (12) 18.18 (18) 12.50 (2)
Cruza 4 3.70 (1) 3.57 (1) 6.67 (4) 4.04 (4) 12.50 (2)
Cruza 5 0.00 (0) 0.00 (0) 0.00 (0) 0.00 (0) 0.00 (0)
Total 100 (27) 100 (28) 100 (60) 100 (99) 100 (16)
Quality
Super 0.00 (0) 0.00 (0) 0.00 (0) 0.00 (0) 0.00 (0)
Special 8.00 (2) 0.00 (0) 1.75 (1) 3.23 (3) 0.00 (0)
Good 64.00 (16) 69.23 (18) 75.44 (43) 68.82 (64) 86.67 (13)
Current 28.00 (7) 30.77 (8) 22.81 (13) 27.96 (26) 13.33 (2)
Total 100 (25) 100 (26) 100 (57) 100 (93) 100 (15)
two-teethed ewes. The authors also observed greater staple length in younger ewes. Minola and Goyenechea (1975) stated that the fiber diameter increases up to the second or third fleeces of an animal, and after the third fleece it decreases again. Likewise, Minola and Goyenechea (1975) stated that at the first fleece the staple is the longest, and afterwards it decreases linearly.
Fiber diameter means are in accordance with the standard patterns for these breeds raised in Brazil. According to ARCO (2013), the fiber diameters ranges from 26.5 to 30.9 µm in Corriedale wool, from 27.0 to 31.0 µm in Hampshire Down wool, from 23.0 to 27.0 µm in Ile de France wool, and from 25.0 to 29.0 µm in Suffolk wool.
According to Minola and Goyenechea (1975), lactation is an important factor negatively affecting the characteristics of the wool. However, the authors pointed out that this happens when the nutrition of the ewe is not sufficient to meet its requirements during this stage. In this case, ewes lose body weight and body condition score (Sezenler et al., 2011). In the present study, there was no difference in body weight between lambed and not-lambed ewes.
After washed, the wool should be as white as possible, in order to be better utilized by the industry, mainly concerning the dying processes (Rey, 1977). Because wools were classified as cream to yellow, prices paid by the industry probably would be negatively affected. This trait is dependent on the environment, with high precipitations resulting in wool tending to be more yellow than with normal or desirable color, i.e., white (Ribeiro et al., 1997). The wool character is more evident in breeds with high selection for wool quality, as the Australian Merino breed (ARCO, 2013). The same can be said for softness to touch, in which high-quality wools are known to present great softness (ARCO, 2013). In this way, wool from meat-type breeds is expected to present the poorest scores for these traits, as observed for Hampshire Down (Table 3).
The presence of medullation is an important negative aspect of the wool for the industry, because medullated wools are usually less soft and more difficult to be dyed. According to Minola and Goyenechea (1975), medullation also causes a greater refraction of the light, which causes the dyed fibers to appear lighter, resulting in devaluation of the produced fabric.
There is no clear reason for the effect of year on character and medullation, since it has an environmental influence, and according to Resende and Rosa-Perez (2002), medullation presents a moderate to high heritability, varying from 0.34 to 0.80.
The results for wool grade agree with the standards cited by ARCO (2013). Ribeiro et al. (1997) cited a value of
88.9% for the sum of “Cruza 1”, “Cruza 2”, and “Cruza 3” grades, for wool samples from Hampshire Down ewes.
For quality, Ribeiro et al. (1997), in wool samples from Hampshire Down ewes, found that 57.1% were classified as Good and 33.3% were classified as Current. In the present study, the Current classification varied from 10.0 to 41.9% of the samples. These results showed that these wools lacked quality for a better utilization by the industry.
Conclusions
Age and reproductive status are not important sources of variation on wool characteristics; however, wool produced by meat breeds presents variations of quantity and quality that should be considered by producers and industry.
Acknowledgments
The authors are deeply grateful to CNPq and Fundação Araucária for the financial support.
References
ARCO - Associação Brasileira de Criadores de Ovinos. 2013. Padrões raciais. Available at: <http://www.arcoovinos.com.br/sitenew/ index.asp?pag=padroes.asp> Accessed on: Dec. 10, 2013. Castro, F. A. B.; Ribeiro, E. L. A.; Koritiaki, N. A.; Mizubuti, I. Y.;
Silva, L. D. F.; Pereira, E. S.; Pinto, A. P.; Constantino, C. and Fernandes Junior, F. 2012a. Desempenho de cordeiros Santa Inês do nascimento ao desmame filhos de ovelhas alimentadas com diferentes níveis de energia. Semina: Ciências Agrárias 33:3379-3388.
Castro, F. A. B.; Ribeiro, E. L. A.; Mizubuti, I. Y.; Silva, L. D. F.; Pereira, E. S.; Barbosa, M. A. A. F.; Sousa, C. L.; Paiva, F. H. P. and Koritiaki, N. A. 2012b. Influence of pre and postnatal energy
restriction on the productive performance of ewes and lambs.
Revista Brasileira de Zootecnia 41:951-958.
Cunha, E. A.; Santos, L. E.; Bueno, M. S.; Roda, D. S.; Leinz, F. F. and Rodrigues, C. F. C. 2000. Utilização de carneiros de raças de corte para obtenção de cordeiros precoces para abate em plantéis produtores de lã. Revista Brasileira de Zootecnia 29:243-252.
Gonzaga, S. S.; Ferreira, O. G. L. and Oliveira, M. M. 2014. Agronegócio da lã. p.583-588. In: Produção de ovinos no Brasil. 1.ed. Selaive-Villaroel, A. B. and Osório, J. C. S., eds. Roca, São Paulo.
Minola, J. and Goeyeneche, J. 1975. Praderas & Lanares. Producción ovina en alto nível. Hemisfério Sur, Montevideo.
Ramos, C. I.; Bellato, V.; Souza, A. P.; Avila, V. S.; Coutinho, G. C. and Dalagnol, C. A. 2004. Epidemiologia das helmintoses gastrintestinais de ovinos no Planalto Catarinense. Ciência Rural 34:1889-1895.
Resende, M. D. V. and Rosa-Perez, J. R. H. 2002. Genética e melhoramento de ovinos. Editora UFPR, Curitiba.
Ribeiro, E. L. A.; Rocha, M. A.; Mizubuti, I. Y. and Figueiró, P. R. P. 1997. Aspectos quantitativos e qualitativos da lã de ovelhas Hampshire Down. Ciência Rural 27:657-661.
Ribeiro, E. L. A.; Mizubuti, I. Y.; Silva, L. D. F.; Rocha, M. A. and Mori, R. M. 2008. Desempenho produtivo de ovelhas submetidas a acasalamentos no verão ou no outono no norte do Paraná. Semina: Ciências Agrárias 29:229-236.
Sezenler, T.; Ozder, M.; Yildirir, M.; Ceyhan, A. and Yuksel, M. A. 2011. The relationship between body weight and body condition
score in some indigenous sheep breeds in Turkey. The Journal of Animal & Plant Sciences 21:443-447.
Summer, R. M. W. and McCall, D. G. 1989. Relative wool production of wethers and ewes of different rearing status. Proceedings of the New Zealand Society of Animal Production 49:209-214.