http://dx.doi.org/10.1590/1516-635x1703363-370
Author(s)
Araújo WAGI
Albino LFTII
Rostagno HSII
Pessoa GBSIII
Cruz SCSIII
Lelis GRIII
Carneiro PROIII
Vieira RAIII
I Federal Institute of Education, Science and
Technology of Northern Minas Gerais.
II Department of Animal Science/ UFV.
III Doctorate Program, DZO/ UFV.
Project financed by FAPEMIG.
Mail Address
Corresponding author e-mail address Wagner Azis Garcia de Araújo
Rua Itagiba de Oliveira, nº 317, Muriaé, MG, Brazil. Zip code: 36880-000. E-mail: [email protected]
Keywords
Alternative feedstuffs, eggs quality, feed costs, poultry.
Submitted: October/2014 Approved: March/2015
ABSTRACT
The objective of this experiment was to evaluate the performance of 64- to 79-wk-old laying hens fed diets supplemented with an enzyme complex (EC) and containing increasing sunflower meal (SFM) levels. A total of 384 Hy-Line Brown layers were distributed according to a randomized block design in a 4 × 2 factorial arrangement (four levels of SFM, and inclusion or not of EC), with eight replicates of six birds each unit. The levels of SFM inclusion were 0, 8, 16 and 24%, utilized in two distinct diets. Diets were calculated to meet all the nutritional requirements of birds, except for the nutrients that would be made available by the nutritional matrix of the enzyme complex, with or without utilization of EC. The parameters analyzed were feed intake (g/bird/day), egg production (%/bird/day), egg weight, egg mass (g/ bird/day), feed conversion ratio per egg mass, feed conversion ratio per dozen eggs, body weight gain, egg components (yolk, albumen and eggshell) and the economic efficiency index (EEI). There was no interaction between EC addition and the SFM levels in the diet. The addition of EC in the diets of laying hens did not affect egg productive or components parameters. The increase in the SFM levels in the diet presented quadratic effect on egg production and feed conversion ratio per dozen eggs, with calculated optimal sunflower meal inclusion levels of 6.72% and 5.83%, respectively, for each parameter. The best economic efficiency per dozen eggs was obtained with the diet with 16.0% SFM and EC inclusion, whereas per egg mass with the diet with of 24.0% SFM and no EC addition.
INTRODUCTION
Sunflower meal is a byproduct from the oil industry, but there are few studies on its inclusion in layers diets to date. Its high fiber content, of 45.19 neutral detergent fiber (NDF) and 21.35 acid detergent fiber (ADF) limits its inclusion of the meal in diets for those birds (NRC 1994; FEDNA 2003; INRA 2004). The utilization of exogenous enzymes could enhance fiber digestibility or phytic phosphorus solubilization in sunflower meal, thereby reducing the negative effects on layer performance.
Few studies on the inclusion of sunflower meal in diets for laying hens have been reported. Vieira et al. (1992) replaced all the soybean meal by sunflower meal (40.5%) and added lysine in layers diets without compromising production parameters. However, feed conversion ratio (FCR) and feed intake showed positive linear behavior as a function of the inclusion of sunflower meal in the diets (Vieira et al., 1992).
The genetic development in laying birds is dynamic, resulting in more productive and consequently more nutrient-requiring animals (Hy Line, 2009). Under this new scenario, it would be difficult to include such high inclusion levels of sunflower meal, such as those reported by Vieira
et al. (1992), without compromising layer performance. Serman et al.
feed intake, egg mass and weight gain. However, in that study, the diets did not contain synthetic amino acids, which may explain those results.
Studies found that it was possible to include up to 5.6% ground whole sunflower seeds in layer diets without affecting performance or egg quality (Tsuzuki et al., 2003). However, sunflower meal is a byproduct from the oil industry that contains less energy and higher fiber than the ground whole seed. Working with sunflower meal under partial oil extraction, Secoylu et al. (2004) included up to 20.0% in layer diets and did not observe any differences in egg mass or feed intake values.
Current studies have used lower addition levels of sunflower meal in the diets of laying hens. Up to 10% sunflower meal can be added to diets with the same protein content, but with the same energy content, without compromising intake, egg mass or egg quality parameters (Rezaei & Hafezian 2007). Casartelli et al. (2006) reported that inclusion of up to 12.0% sunflower meal in layer feeds did not affect productive parameters or egg internal quality parameters. Additionally, the inclusion of sunflower meal in diets improved eggshell thickness. Recently, Junqueira et al. (2010), evaluating the economic viability of the inclusion of enzyme phytase and sunflower meal in layer diets, concluded that the addition of phytase reduced phosphorus excretion and improved the economic parameters. However, the maximum level of sunflower meal inclusion that did not negatively affect productive parameters was 4%.
It is known that the higher the sunflower meal inclusion in the diets, the higher the inclusion of soybean meal as well, due to the low energy content of the material (Rezaei & Hafezian 2007). Oil is one of the most expensive ingredients used in commercial layer feed formulation, and therefore, may significantly increase production costs. The objective of this study was to evaluate the effects of increasing levels of sunflower meal inclusion and the supplementation of an enzyme complex, containing carbohydrases and phytase, on egg production and economic parameters of layers from 64 to 79 weeks of age.
MATERIAL AND METHODS
The experiment was conducted between May and September 2011, in the facilities of the poultry sector of the Department of Animal Science of Universidade Federal de Viçosa, MG, Brazil. In total, 384 Hy-Line Brown layers in the second laying cycle, with 1.675±0.088 g body weight, were evaluated during the period of 64 to 79 weeks of age. Birds were distributed
in a completely randomized design in a 4 × 2 factorial arrangement (diets with four sunflower meal inclusion levels and the addition or not of an enzyme complex), with eight replicates of six birds each.
Birds were housed in an open-sided masonry shed (5-m wide and 2-m high) with wire-mesh sides and covered with clay tiles. Layers remained in galvanized-wire cages, each divided in four 25 × 45 × 40 cm compartments, distributed in two tiers, and 0.80-m distant fro0.80-m the floor. Cages were equipped with galvanized-iron trough feeders and drinkers that covered the entire frontal extension of the cages.
Sunflower meal (SFM) was included in the diets at the levels of 0, 8, 16 and 24%, and the enzyme complex was added at 0.005% or not (Table 1). The enzyme complex (carbohydrases and phytase) aimed at increasing the digestibility of substrates to the action of these enzymes. Dietes were formulated to supply the requirements recommended by Rostagno et al. (2005).
The chemical composition values applied for sunflower meal (Table 3) used for diet formulation were those analyzed in the laboratory of feed analysis of the Department of Animal Science of Universidade Federal de Viçosa, and the average values reported by several authors (NRC, 1994; FEDNA, 2003; INRA, 2004; Tavernari et al. 2010).
During the entire experimental period, house temperature inside was monitored daily (at 16 h), using minimum-maximum thermometers. Birds received feed and water ad libitum and 16 hours of light per day during the entire experimental period, in compliance with the management recommendations of genetic company’s manual. Eggs were collected twice daily (8 and 16 h), and egg-laying frequency and mortality were recorded. Birds and diets were weighed at the beginning and at the end of each 28-d period (from 64 to 71 weeks of age) to determine weight gain, feed intake, FCR per dozen eggs and FCR per egg mass.
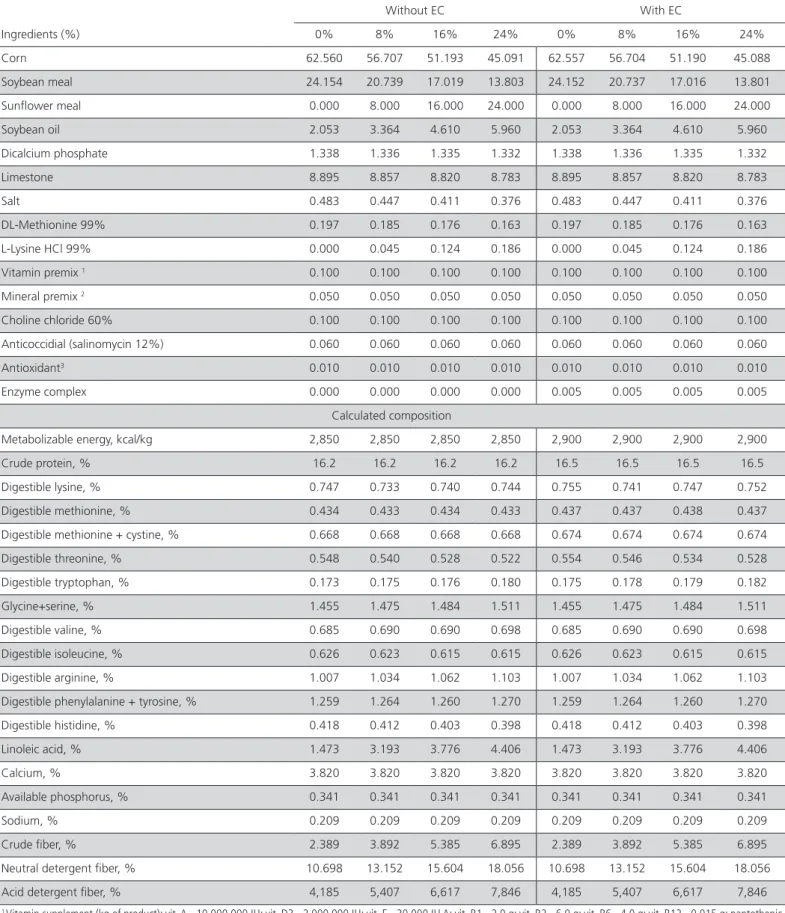
Table 1 – Percentage and chemical composition of the experimental (on “as-fed” basis) containing different sunflower meal inclusion levels and supplemented or not with the enzyme complex (EC)
Without EC With EC
Ingredients (%) 0% 8% 16% 24% 0% 8% 16% 24%
Corn 62.560 56.707 51.193 45.091 62.557 56.704 51.190 45.088
Soybean meal 24.154 20.739 17.019 13.803 24.152 20.737 17.016 13.801
Sunflower meal 0.000 8.000 16.000 24.000 0.000 8.000 16.000 24.000
Soybean oil 2.053 3.364 4.610 5.960 2.053 3.364 4.610 5.960
Dicalcium phosphate 1.338 1.336 1.335 1.332 1.338 1.336 1.335 1.332
Limestone 8.895 8.857 8.820 8.783 8.895 8.857 8.820 8.783
Salt 0.483 0.447 0.411 0.376 0.483 0.447 0.411 0.376
DL-Methionine 99% 0.197 0.185 0.176 0.163 0.197 0.185 0.176 0.163
L-Lysine HCl 99% 0.000 0.045 0.124 0.186 0.000 0.045 0.124 0.186
Vitamin premix 1 0.100 0.100 0.100 0.100 0.100 0.100 0.100 0.100
Mineral premix 2 0.050 0.050 0.050 0.050 0.050 0.050 0.050 0.050
Choline chloride 60% 0.100 0.100 0.100 0.100 0.100 0.100 0.100 0.100
Anticoccidial (salinomycin 12%) 0.060 0.060 0.060 0.060 0.060 0.060 0.060 0.060
Antioxidant3 0.010 0.010 0.010 0.010 0.010 0.010 0.010 0.010
Enzyme complex 0.000 0.000 0.000 0.000 0.005 0.005 0.005 0.005
Calculated composition
Metabolizable energy, kcal/kg 2,850 2,850 2,850 2,850 2,900 2,900 2,900 2,900
Crude protein, % 16.2 16.2 16.2 16.2 16.5 16.5 16.5 16.5
Digestible lysine, % 0.747 0.733 0.740 0.744 0.755 0.741 0.747 0.752
Digestible methionine, % 0.434 0.433 0.434 0.433 0.437 0.437 0.438 0.437
Digestible methionine + cystine, % 0.668 0.668 0.668 0.668 0.674 0.674 0.674 0.674
Digestible threonine, % 0.548 0.540 0.528 0.522 0.554 0.546 0.534 0.528
Digestible tryptophan, % 0.173 0.175 0.176 0.180 0.175 0.178 0.179 0.182
Glycine+serine, % 1.455 1.475 1.484 1.511 1.455 1.475 1.484 1.511
Digestible valine, % 0.685 0.690 0.690 0.698 0.685 0.690 0.690 0.698
Digestible isoleucine, % 0.626 0.623 0.615 0.615 0.626 0.623 0.615 0.615
Digestible arginine, % 1.007 1.034 1.062 1.103 1.007 1.034 1.062 1.103
Digestible phenylalanine + tyrosine, % 1.259 1.264 1.260 1.270 1.259 1.264 1.260 1.270
Digestible histidine, % 0.418 0.412 0.403 0.398 0.418 0.412 0.403 0.398
Linoleic acid, % 1.473 3.193 3.776 4.406 1.473 3.193 3.776 4.406
Calcium, % 3.820 3.820 3.820 3.820 3.820 3.820 3.820 3.820
Available phosphorus, % 0.341 0.341 0.341 0.341 0.341 0.341 0.341 0.341
Sodium, % 0.209 0.209 0.209 0.209 0.209 0.209 0.209 0.209
Crude fiber, % 2.389 3.892 5.385 6.895 2.389 3.892 5.385 6.895
Neutral detergent fiber, % 10.698 13.152 15.604 18.056 10.698 13.152 15.604 18.056
Acid detergent fiber, % 4,185 5,407 6,617 7,846 4,185 5,407 6,617 7,846
1 Vitamin supplement (kg of product): vit. A - 10,000,000 IU; vit. D3 - 2,000,000 IU; vit. E - 30,000 IU A; vit. B1 - 2.0 g; vit. B2 - 6.0 g; vit. B6 - 4.0 g; vit. B12 - 0.015 g; pantothenic
acid - 12.0 g; biotin - 0.1 g; vit. K3 - 3.0 g; folic acid - 1.0 g; nicotinic acid - 50.0 g; Se - 250.0 mg.
2 Mineral supplement (kg of product): Fe - 80 g; Cu - 10 g; Co - 2 g; Mn - 80 g; Zn - 50 g; I - 1 g.
Table 2 – Nutritional values attributed to the enzyme
complex1
Nutritional matrix Per kg Added with inclusion
Metabolizable energy, kcal/kg 1,000,000 50
Crude protein, % 7,200 0.360
Digestible lysine, % 150 0.008
Digestible methionine, % 70 0.004
Methionine + digestible cystine, % 120 0.006
Digestible threonine, % 120 0.006
Digestible tryptophan, % 35 0.002
Digestible arginine, % 170 0.009
Enzyme complex content (%)
Endo-1,3(4)-beta-glucanase 14.0
Xylanase 11.0
6-Phytase 5.0
Inert 70.0
1Rovabio Excel AP®
Table 3 – Chemical composition of sunflower meal
Sunflower meal dry matter1 91.37
Metabolizable energy, kcal/kg2 1,983
Crude protein, %1 25.00
Digestible lysine, %2 0.634
Digestible methionine, %2 0.504
Methionine + cystine, %2 0.858
Digestible threonine, %2 0.765
Digestible tryptophan, %2 0.315
Total glycine + serine, %2 2.560
Digestible valine, %2 1.140
Digestible isoleucine, %2 0.970
Digestible arginine, %2 2.080
Digestible phenylalanine + tyrosine, %2 2.050
Digestible histidine, %2 0.570
Linoleic acid, %2 0.600
Ether extract, %1 2.120
Mineral matter %1 4.730
Calcium, %1 0.140
Total phosphorus, %1 0.939
Available phosphorus, %2 0.310
Sodium, %2 0.200
Crude fiber, %1 22.37
Neutral detergent fiber, %1 45.19
Acid detergent fiber, %1 21.35
1 Analysis performed in the Laboratory of Animal Nutrition of UFV.
2Average values obtained from the NRC (1998), FEDNA (2003), INRA (2004), and
Tavernari et al. (2010).
In order to verify the economic viability of including sunflower meal in the diet, the cost of the diet was determined in Brazilian real (R$) per dozen of eggs produced and per kilogram of eggs produced (Yi). The equation was adapted from the methodology of
Bellaver et al. (1985): Yi = (Pi * Qi) / Ei, where Yi = diet cost per dozen of eggs produced and per kilogram of eggs produced in the i-th treatment (sunflower meal level); Pi = price per kilogram of the diet utilized in the i-th treatment; Qi, quantity of diet consumed in the i-th treatment; and Ei = dozen of eggs produced and kilogram of eggs produced. Next, the economic efficiency index (EEI) was calculated: EEI = (LCe / CTei) * 100, where LCe = lowest cost of diet per dozen of eggs produced and kilogram of eggs produced observed between the treatments; and CTEi = cost of the i-th treatment.
The values (price/kg) of the ingredients used to calculate the costs were those practiced in the region of Viçosa, in May 2010, as follows: butylated hydroxytoluene (R$ 6.82), limestone (R$ 0.028), choline chloride (R$ 2.92), enzyme complex (R$ 6.43), DL-methionine (R$ 8.15), soybean meal (R$ 0.63), sunflower meal (R$ 0.31), dicalcium phosphate (R$ 1.18), L-lysine (R$ 4,84), L-threonine (R$ 8.15), corn (R$ 0.53), oil (R$ 2.57), salt (R$ 0.19), vitamin supplement for growth (R$ 2.195), vitamin supplement (R$ 3.30), and mineral supplement (R$ 1.86).
Data were statistically analyzed using the PROC GLM procedure of the software SAS® (Statistical Analysis
System, 2002) was employed in a factorial arrangement, adopting 5% as significance level. Initial live weight was utilized as co-variable for the performance of the ANOVA. Linear and quadratic functions were utilized for the determination of the ideal level of sunflower meal, and the Student-Newmann-Keul test was used for the evaluation of enzyme complex inclusion.
RESULTS AND DISCUSSION
Mean temperatures recorded during the experiment were 20.5 ºC (15.2 and 25.7 °C minimum and maximum, respectively). No interaction was verified between EC inclusion and sunflower meal levels (p<0.05; Tables 3 to 10). Junqueira.et al. (2010) also did not verify any effects of the interaction between sunflower meal and the addition of phytase in the layer diets on most production parameters, except for egg mass.
minimum point at 5.83% inclusion level . These results are considerably different from the findings of Vieira et al. (1992), who reported that dietary sunflower meal levels up to 40.5% did not affect layer performance. However, current commercial layer strains are more nutrient-demanding (Hy Line, 2009), and therefore, high levels of SFM in the diet would compromise their performance. Other authors have also reported the inclusion of high SFM levels (20.0%) in commercial
layer diets (Senkoylu et al., 2004). However, the sunflower meal utilized in the diets were submitted only to partial oil extraction, and therefore nutritional value was much higher than that of the SFM utilized in the present study. Most of the results reported in the literature recommend the utilization of SFM levels close to those included here (Tsuzuki et al., 2003; Casartelli
et al., 2006; Rezaei & Hafezian 2007; Junqueira et al., 2010).
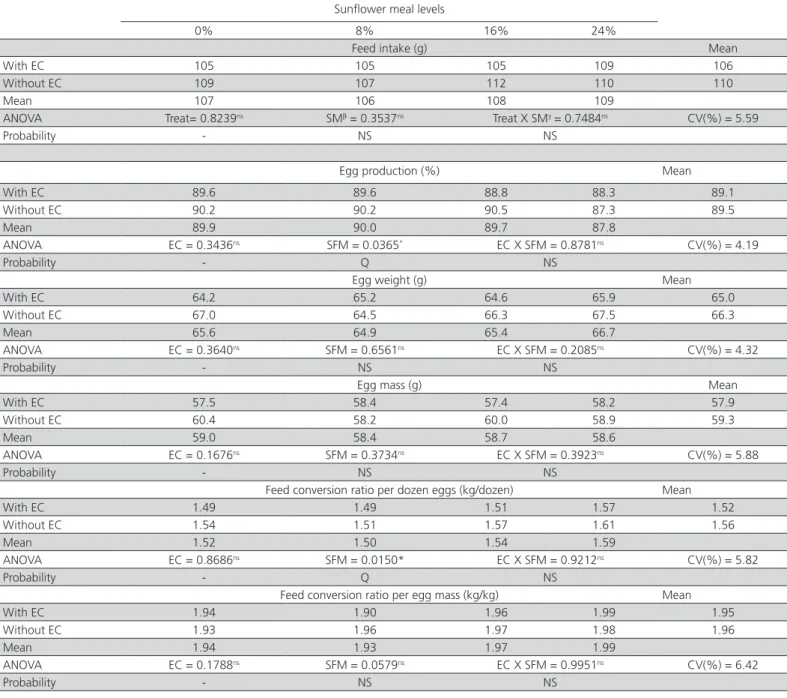
Table 4 – Feed intake, egg production, egg weight, egg mass, and feed conversion ratio per dozen eggs and per egg mass in 64- to 79-week-old layers fed diets with increasing sunflower meal (SFM) levels and supplemented or not with an enzyme complex (EC)
Sunflower meal levels
0% 8% 16% 24%
Feed intake (g) Mean
With EC 105 105 105 109 106
Without EC 109 107 112 110 110
Mean 107 106 108 109
ANOVA Treat= 0.8239ns SMβ = 0.3537ns Treat X SMγ = 0.7484ns CV(%) = 5.59
Probability - NS NS
Egg production (%) Mean
With EC 89.6 89.6 88.8 88.3 89.1
Without EC 90.2 90.2 90.5 87.3 89.5
Mean 89.9 90.0 89.7 87.8
ANOVA EC = 0.3436ns SFM = 0.0365* EC X SFM = 0.8781ns CV(%) = 4.19
Probability - Q NS
Egg weight (g) Mean
With EC 64.2 65.2 64.6 65.9 65.0
Without EC 67.0 64.5 66.3 67.5 66.3
Mean 65.6 64.9 65.4 66.7
ANOVA EC = 0.3640ns SFM = 0.6561ns EC X SFM = 0.2085ns CV(%) = 4.32
Probability - NS NS
Egg mass (g) Mean
With EC 57.5 58.4 57.4 58.2 57.9
Without EC 60.4 58.2 60.0 58.9 59.3
Mean 59.0 58.4 58.7 58.6
ANOVA EC = 0.1676ns SFM = 0.3734ns EC X SFM = 0.3923ns CV(%) = 5.88
Probability - NS NS
Feed conversion ratio per dozen eggs (kg/dozen) Mean
With EC 1.49 1.49 1.51 1.57 1.52
Without EC 1.54 1.51 1.57 1.61 1.56
Mean 1.52 1.50 1.54 1.59
ANOVA EC = 0.8686ns SFM = 0.0150* EC X SFM = 0.9212ns CV(%) = 5.82
Probability - Q NS
Feed conversion ratio per egg mass (kg/kg) Mean
With EC 1.94 1.90 1.96 1.99 1.95
Without EC 1.93 1.96 1.97 1.98 1.96
Mean 1.94 1.93 1.97 1.99
ANOVA EC = 0.1788ns SFM = 0.0579ns EC X SFM = 0.9951ns CV(%) = 6.42
Probability - NS NS
EC – enzyme complex addition;CV - coefficient of variation; βFG (%) - percentage of sunflower meal in the diet; γ -Interaction between the presence of EC and SFM (%); ns –not
Feed intake, egg mass, egg weight, and feed conversion ratio per egg mass were not influenced by the treatments (p>0.05; Table 4). Secoylu et al. (2004) did not find any differences in these parameters either, when including up to 20.0% sunflower meal in the diets of commercial strains. On the other hand, Casartelli et al. (2006) reported that the dietary inclusion of 12.0% sunflower meal did not affect layer feed intake or egg mass. Similar results were found with when up to 10.0% sunflower meal was included in layer diets containing equal energy and protein levels (Rezaei & Hafezian, 2007).
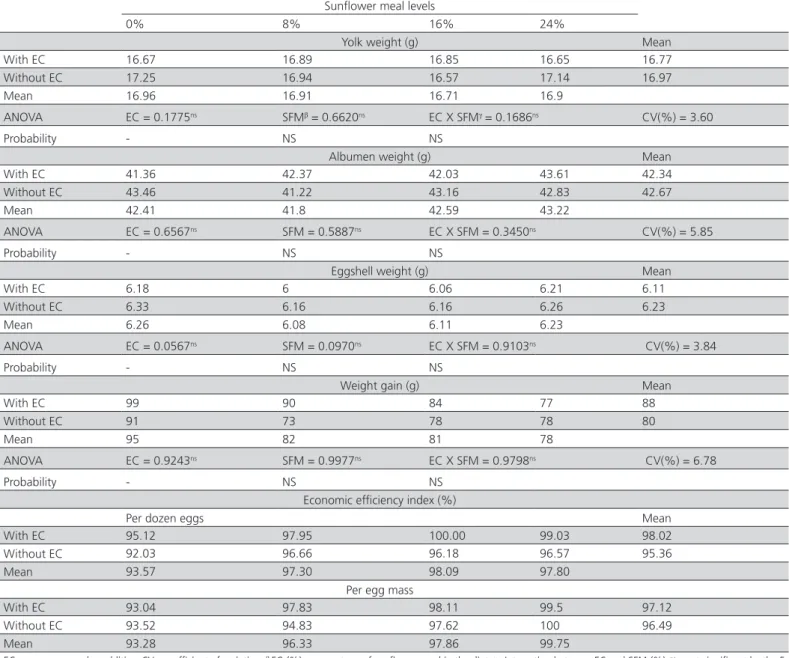
During the evaluation period, egg components were not affected by the treatments (p>0.05; Table 5). These results are consistent with those reported in literature (Tsuzuki et al., 2003; Secoylu et al., 2004; Rezaei & Hafezian, 2007). Only Casartelli et al. (2006) showed an improvement in eggshell parameter as a function of increasing sunflower meal inclusion levels in the diet of commercial layers. In spite of the positive result reported by these authors, it is not likely that the dietary sunflower meal inclusions result in eggshell improvement, because this feedstuff is not very rich in nutrients and has high fiber content.
Table 5 – Yolk weight, albumen weight, eggshell weight, and weight gain 64- to 79-week-old layers fed diets with increasing sunflower meal (SFM) levels and supplemented or not with an enzyme complex (EC)
Sunflower meal levels
0% 8% 16% 24%
Yolk weight (g) Mean
With EC 16.67 16.89 16.85 16.65 16.77
Without EC 17.25 16.94 16.57 17.14 16.97
Mean 16.96 16.91 16.71 16.9
ANOVA EC = 0.1775ns SFMβ = 0.6620ns EC X SFMγ = 0.1686ns CV(%) = 3.60
Probability - NS NS
Albumen weight (g) Mean
With EC 41.36 42.37 42.03 43.61 42.34
Without EC 43.46 41.22 43.16 42.83 42.67
Mean 42.41 41.8 42.59 43.22
ANOVA EC = 0.6567ns SFM = 0.5887ns EC X SFM = 0.3450ns CV(%) = 5.85
Probability - NS NS
Eggshell weight (g) Mean
With EC 6.18 6 6.06 6.21 6.11
Without EC 6.33 6.16 6.16 6.26 6.23
Mean 6.26 6.08 6.11 6.23
ANOVA EC = 0.0567ns SFM = 0.0970ns EC X SFM = 0.9103ns CV(%) = 3.84
Probability - NS NS
Weight gain (g) Mean
With EC 99 90 84 77 88
Without EC 91 73 78 78 80
Mean 95 82 81 78
ANOVA EC = 0.9243ns SFM = 0.9977ns EC X SFM = 0.9798ns CV(%) = 6.78
Probability - NS NS
Economic efficiency index (%)
Per dozen eggs Mean
With EC 95.12 97.95 100.00 99.03 98.02
Without EC 92.03 96.66 96.18 96.57 95.36
Mean 93.57 97.30 98.09 97.80
Per egg mass
With EC 93.04 97.83 98.11 99.5 97.12
Without EC 93.52 94.83 97.62 100 96.49
Mean 93.28 96.33 97.86 99.75
EC – enzyme complex addition;CV - coefficient of variation; βFG (%) - percentage of sunflower meal in the diet; γ -Interaction between EC and SFM (%); ns –not significant by the F
The best economic efficiency per dozen eggs and per egg mass was obtained with the diet containing 16.0% sunflower meal and supplemented with the enzyme complex, and with the diet with 24% sunflower meal and not supplemented with the enzyme complex, respectively. These results are contradictory A similar situation was also verified by Junqueira et al. (2010), who obtained better economic efficiency on diets with 4.0% sunflower meal and the addition of phytase. As it is an alternative feedstuff, its economic efficiency is essentially to its low price relative to typical feedstuffs (corn and soybean meal). This feedstuff tends to become increasingly cheaper because the sunflower crop is expanding in Brazil. However, the present results are consistent with current prices, and therefore, future studies estimating the economic viability of the utilization of this feedstuff in commercial layer diets are warranted.
The inclusion of the enzyme complex in layer diets did not affect their performance or egg components (p>0.05; Tables 4 and 5). These results are different from the findings of Junqueira et al. (2010), who found better efficiency of phytase added to layer diets, as shown by the higher egg mass obtained with 8% sunflower meal inclusion and the addition of phytase in comparison with 4.0% SFM and no phytase inclusion. Bess et al. (2006) did not observed any significant differences in the utilization of phytase in broiler breeder diets, using an experimental design very similar to that applied in the present study. Sunflower meal is rich in fiber and phytic acid, and therefore, a positive effect with the addition of the enzyme complex in the diets was expected; however, no such effect was verified in the present experiment.
Liu et al. (2007) and Viana et al. (2009) also verified that the addition of phytase to diets with reduced nutrient levels did not improve egg production, egg weight, or feed conversion per dozen eggs of layers. The results of these authors were very similar to those found in the present study, where no influence of enzyme complex on those parameters were detected.
There was no interaction between the dietary addition of enzyme complex and sunflower meal levels (p>0.05). The addition of the enzyme complex in the diets did not affect egg-production parameters or egg components (p>0.05). Increasing dietary SFM levels had a quadratic effect on egg production and feed conversion ratio per dozen eggs (P<0.05), with ideal points of sunflower meal inclusion of 6.72 and 5.83%, respectively. The best economic efficiency per dozen eggs and per egg mass was obtained with the diet
containing 16.0% sunflower meal and supplemented with the enzyme complex, and with the diet with 24% sunflower meal and not supplemented with the enzyme complex, respectively
CONCLUSIONS
The addition of the evaluated enzyme complex in layer diets does not improve egg-production parameters or egg components. Dietary sunflower meal levels of 6.72 and 5.83%, promote the best egg production and feed conversion ratio per dozen eggs. The inclusion of sunflower meal in layer diets improves the economic efficiency index per dozen eggs and per egg mass provided feedstuff prices are similar to those applied in the present study.
ACKNOWLEDGEMENTS
We are grateful to the Research Support Foundation of the State of Minas Gerais (FAPEMIG) for their support.
REFERENCES
Bellaver C, Fialho ET, Protas JFS. Radícula de malte na alimentação de suínos em crescimento e terminação. Pesquisa Agropecuária Brasileira 1985;20(8): 969-974.
Bess F, Rosa AP, Krabbe EP. Efeito da adição de fitase sobre a porcentagem de postura e densidade de ovos em matrizes de corte. Brazilian Journal of Poultry Science 2006;8:106.
Casartelli EM, Filardi RS, Junqueira OM. Sunflower meal in commercial layer diets formulated on total and digestible amino acids basis. Brazilian Journal of Poultry Science 2006;8(3): 167-171.
FEDNA- Fundacíon Española para el Desarrollo de la Nutrición Animal. Tablas de composición y valor nutritivo de alimentos para la fabricación
de piensos compuestos. 2nd ed. Madrid: Ediciones Mundi Prensa; 2003.
Liu N, Liu GH, Li FD. Efficacy of phytases on egg production and nutrient
digestibility in layers fed reduced phosphorus diets. Poultry Science 2007;86(11):2337-2342.
NRC- National Research Council. Nutrient requirements of poultry. 9th ed.
Washington: National Research Council; 1994. 155p.
Hy Line. Manual da variedade Brown. Uberlândia; 2009.
Junqueira OM, Filardi RS, Ligeiro EC. Avaliação técnica e econômica da matriz nutricional da enzima fitase em rações contendo farelo de girassol para poedeiras comerciais. Revista Brasileira de Zootecnia 2010;39(10):2200-2206.
Rostagno HS, Albino LFT, Donzele JL. Tabelas brasileiras para aves e
suínos: composição de alimentos e exigências nutricionais. Viçosa: Universidade Federal de Viçosa; 2005.
SAS Institute. User guide for personal computer. Cary;2002.
Sauvant D, Perez JM, Tran G. Tablas de composición y de valor nutritivo de las materias primas destinadas a los animales de interés ganadero:
cerdos, aves, bovinos, ovinos, caprinos, conejos, caballos, peces. 2nd
ed. Madrid: Institute National de la Recherche Agronomique, Ediciones Mundi Prensa; 2004. p.194-197.
Senkoylu N, Akyurek H, Samli HE. The possibilities of using high oil-sunflower meal and enzyme mixture in layer diets. Pakistan Journal of Nutrition 2004;3(5):285-289.
Serman V, Mas N, Melenjuk V. Use of sunflower meal in feed mixtures for laying hens. Acta Veterinaria Brunensis 1997;66(4):219-227.
Tavernari FC, Morata RL, Ribeiro Jr V. Avaliação nutricional e energética do farelo de girassol para aves. Arquivos Brasileiros de Medicina Veterinária e Zootecnia 2010;62(1):172-177.
Tsuzuki ET, Garcia ERM, Murakami AE. Utilization of sunflower seed in laying hen rations. Brazilian Journal of Poultry Science 2003;5(3):179-182.
Viana MTS, Albino LFT, Rostagno HS. Efeito da suplementação de enzima
fitase sobre o metabolismo de nutrientes e o desempenho de poedeiras. Revista Brasileira de Zootecnia 2009; 38(6):1074-1080.