WATER PERCOLATION ESTIMATED WITH TIME DOMAIN
REFLECTOMETRY (TDR) IN DRAINAGE LYSIMETERS
(1)Alisson Jadavi Pereira da Silva(2) & Eugênio Ferreira Coelho(3)
SUMMARY
Due to the difficulty of estimating water percolation in unsaturated soils, the purpose of this study was to estimate water percolation based on time-domain reflectometry (TDR). In two drainage lysimeters with different soil textures TDR probes were installed, forming a water monitoring system consisting of different numbers of probes. The soils were saturated and covered with plastic to prevent evaporation. Tests of internal drainage were carried out using a TDR 100 unit with constant dielectric readings (every 15 min). To test the consistency of TDR-estimated percolation levels in comparison with the observed leachate levels in the drainage lysimeters, the combined null hypothesis was tested at 5 % probability. A higher number of probes in the water monitoring system resulted in an approximation of the percolation levels estimated from TDR–based moisture data to the levels measured by lysimeters. The definition of the number of probes required for water monitoring to estimate water percolation by TDR depends on the soil physical properties. For sandy clay soils, three batteries with four probes installed at depths of 0.20, 0.40, 0.60, and 0.80 m, at a distance of 0.20, 0.40 and 0.6 m from the center of lysimeters were sufficient to estimate percolation levels equivalent to the observed. In the sandy loam soils, the observed and predicted percolation levels were not equivalent even when using four batteries with four probes each, at depths of 0.20, 0.40, 0.60, and 0.80 m.
Index terms: drainage, water flow in the soil, soil moisture.
RESUMO:PERCOLAÇÃO DE ÁGUA ESTIMADA COM REFLECTOMETRIA NO
DOMÍNIO DO TEMPO (TDR), EM LISÍMETROS DE DRENAGEM
Em razão da dificuldade em se estimar a percolação de água em solos não saturados, realizou-se este trabalho com o objetivo de examinar a estimativa da percolação de água, utilizando TDR. Em dois lisímetros de drenagem com solos de texturas diferentes,
instalaram-(1) Received for publication on July 17, 2012 and approved on April 26, 2013.
(2) Prof. Dr., Federal Institute of Education, Science and Technology Baiano. Igara Road. Senhor do Bonfim (BA), Brazil. CEP 48970-000. E-mail: [email protected]
se sondas de TDR para formar baterias de monitoramento de água compostas por diferentes números de sondas. Os solos foram saturados e cobertos com lona plástica para evitar a evaporação. Assim, procedeu-se a um ensaio de drenagem interna, utilizando-se de uma TDR 100 programada para realizar leituras de constante dielétrica a cada 15 min. Para testar a adequação dos valores de laminas de percolação estimada pela TDR aos valores observados na coleta de drenos dos lisímetros de drenagem, utilizou-se do teste da hipótese da nulidade conjunta com 5 % de probabilidade. O incremento da quantidade de sondas no perfil de monitoramento de água aproximou os valores das laminas de percolação estimada por TDR aos valores das laminas observadas nos lisímetros. A definição do número de sondas necessárias para o monitoramento de água com fins de estimar a percolação por TDR depende das propriedades físicas do solo. Para solos de textura argiloarenosa, três baterias com quatro sondas às profundidades 0,10; 0,30; 0,50; e 0,70 m a 0,20; 0,40; e 0,60 m do centro do lisímetro são suficientes para estimar a percolação equivalente à observada. Em solos de textura areia-franca, não há equivalência entre as laminas de percolação estimadas e observadas, mesmo para quatro baterias de quatro sondas cada, nas profundidades 0,10; 0,30; 0,50; e 0,70 m.
Termos de indexação: drenagem, fluxo de água no solo, umidade do solo.
INTRODUCTION
The precise and accurate knowledge of water flow below the effective root zone in an unsaturated medium is essential for the planning and management of irrigation systems and the evaluation of soil dynamics of water and ions under irrigated and rainfed conditions. The Buckingham-Darcy equation quantifies the vertical water flow in unsaturated soils (Skaggs et al., 2006; Ji et al., 2007; Jiménez-Martíneza et al., 2009), despite some difficulties of use, as described by Reichardt & Timm (2012). The use of unsaturated hydraulic conductivity K(θ) in exponential form has been criticized due to the large error margins induced by minor variations in soil moisture (Mubarak et al., 2010; Ghiberto & Moraes, 2011).
Despite some limitations, the relationship between unsaturated hydraulic conductivity and soil moisture [relationship K(θ)] has been found to be successful in the calculation of the soil water balance (Campos et al., 2007; Silva et al., 2009b). On the other hand, the determination of soil water flow by K(θ) was unsatisfactory in some studies (Willis et al., 1997; Selle et al., 2011).
In recent studies, TDR is being used to predict behavioral processes of soil water for different purposes (Previati et al., 2012; Cataldo et al., 2012; Schelde et al., 2011; Souza & Folegatti, 2010), with some specific studies on percolation (Wessolek et al., 2008; Selle et al., 2011; Baram et al., 2012). In this case, only the calibration of the TDR probe set as a function of the variability of soils is needed, rather than the hydraulic properties such as water retention curve and the ratio of unsaturated hydraulic conductivity with moisture K(θ). Although the use of time domain reflectometry in unsaturated medium to assess percolation is theoretically well-founded (Silva et al., 2009a), the accuracy of this method is limited by the number and location of the probe readings. This paper presents a TDR-based method to estimate percolation using different numbers, reading positions and monitoring planes of soil moisture.
MATERIAL AND METHODS
The experiment was conducted on an experimental field of Embrapa Cassava and Fruits, Cruz das Almas - BA, (latitude 12o 48’ S, longitude 39o 06’ W; 225 m
asl). The experimental plots consisted of two drainage lysimeters of fiberglass (volume 5.00 m3, width 2.0
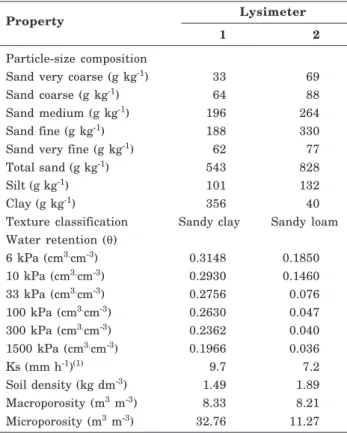
m, length 2.5 m, depth 1.0 m). To establish a free drainage system, the top 0.2 m of the profile was divided in two layers of 0.1 m, of which the lower consisted of a drainage system with perforated 50 mm PVC pipes and gravel and the upper of washed sand. The lysimeters were completely filled with two soils of different textures. Particle size distribution analysis according to the method proposed by Embrapa (1997) classified the soils as sandy loam and sandy clay. The hydro-physical description of the soils used in the lysimeters is presented in table 1.
TDR probes were constructed with the following components: three stainless steel rods (effective length 0.1 m) without resin, spaced 0.017 m apart; coaxial cables (50 ohm); polyester resin layer covering 0.05 m at the beginning of the rods. Soil moisture was determined based on the set of values obtained by gravimetry, in comparison with the measured dielectric constant (Ka) data, as proposed by Topp et al. (1980). This study was developed based on equations resulting from the ratio of Ka and gravimetric moisture values (Figure 1), using volumetric soil-water content intervals, in ranges from 0.0408 to 0.3749 cm3 cm-3
and from 0.0157 to 0.3056 cm3 cm-3, for the sandy clay
and sandy loam soils, respectively.
P2-monitoring with 8 probes; P3 - monitoring with 12 probes; P4 - monitoring with 16 probes.
The plots were saturated and covered with plastic to prevent evaporation. Tests of internal drainage were performed with an automatic data acquisition system (model TDR 100, Campbell Scientific), connected to multiplexers to perform Ka readings in 15-min intervals that were filed in a data logger, model CR1000, for 670 h. Ka were transformed into volumetric moisture values by which it was possible
to calculate, for each period of interest (t), the amount of stored water in the monitoring plane:
( )
zdz hRnL
0
L=
ò
q (3)where: θ(z) is the representative function of the moisture profile and dz the differential of the independent variable z. L is the total depth of the plane (L = 0.8 m). To solve the integral numerically we used Simpson’s rule.
The levels drained in the lysimeters were measured at the outlets of the drainage systems in time intervals (∆t) from 1 to 24 h; the collection period was increased according to the observation of decreasing water redistribution in the soil. For these same time intervals, the variation in water storage was calculated by the TDR-based data. Therefore, since the drainage was the only water outlet of the plot, the percolation levels (PL) were estimated, based on the reduction of the amounts of storage between the water collection periods, by the following equations: For 1P:
( )
( )
[
z
z
]
dz
PL
L
t t
ò
-
+=
01
q
q
(4)For 2P, 3P and 4P:
n dZ dZ PL n 1 R L 0 L 0 1 t t
å ò
ò
= + ÷÷ ø ö ç ç è æ -= q q (5)
where: PL is the percolated level estimated by TDR (mm) in the time interval Dt; θtis the moisture at
the beginning of time interval Dt (mm cm-1); θ t+1 is
moisture at the beginning of time interval Dt; Z is the depth (cm); R is the maximum distance in the considered plane (cm); L is the total depth of the
Property Lysimeter
1 2
Particle-size composition
Sand very coarse (g kg-1) 33 69
Sand coarse (g kg-1) 64 88
Sand medium (g kg-1) 196 264
Sand fine (g kg-1) 188 330
Sand very fine (g kg-1) 62 77
Total sand (g kg-1) 543 828
Silt (g kg-1) 101 132
Clay (g kg-1) 356 40
Texture classification Sandy clay Sandy loam Water retention (θ)
6 kPa (cm3.cm-3) 0.3148 0.1850 10 kPa (cm3.cm-3) 0.2930 0.1460 33 kPa (cm3.cm-3) 0.2756 0.076 100 kPa (cm3.cm-3) 0.2630 0.047 300 kPa (cm3.cm-3) 0.2362 0.040 1500 kPa (cm3.cm-3) 0.1966 0.036
Ks (mm h-1)(1) 9.7 7.2
Soil density (kg dm-3) 1.49 1.89 Macroporosity (m3 m-3) 8.33 8.21 Microporosity (m3 m-3) 32.76 11.27 Table 1. Hydro-physical properties of the soils used
to fill the lysimeters
(1) Ks: saturated hydraulic conductivity
θ Sandy clay = 0.528860 - 0.090141 ka + 0.003979 ka2- 0.000065ka3
R2= 0.9806
θ Sandy loam = 0.238436 + 0.082236 ka - 0.008828 ka2- 0.000227 ka3
R² = 0.9926
0 0,05 0,1 0,15 0,2 0,25 0,3 0,35 0,4
5 10 15 20 25 30 35
Soil moisture, cm
cm
3
-3
Dielectric constant, Ka
Figure 1. Relations between soil moisture (θθθθθ) and dielectric constant (Ka) for the two soil texture classes used in the experiment.
1.0 m
0.8 m
Washed sand 0,1 m PVC pipes and gravel 0.1 m
2.0 m 1.0 m TDR Probe 0.1 m 0.2 m 0.1 m 0.2 m 0.2 m Z 0.1 m 0.2 m R P1P2 P3 P4
considered plane (cm); n is the number of planes used for the estimation.
The normality of distribution of moisture in the profile was tested by the method recommended by Jones (1969), at 5 % probability. The TDR-estimated percolation levels were compared with the values measured at the drain outlets of the drainage lysimeters by an adjusted simple linear regression model with the observed y over the estimated x values by equations such as: y = ax+b+ε subject to the combined null hypothesis of the estimated parameters
a and b: H0: a=1 and H0: b= 0 (Mayer et al., 1994). If
either of the two null hypothesis is rejected at 5 % probability, the values estimated with TDR percolation are not equivalent to those observed at the drain outlet from the drainage lysimeters. The homoscedasticity of the ε residues was checked in a diagnostic test recommended by Draper & Smith (1981). The root mean square error (RMSE) was used for a complementary evaluation of the estimates of the percolation levels (Willmott, 1981):
(
)
0,51
2 1
ú
û
ù
ê
ë
é
-=
å
= - N
i
i
i
O
P
N
RMSE
(6)where: Pi values are estimated percolation levels (mm); Oi the observed percolation levels and N is the number of pairs of values.
RESULTS AND DISCUSSION
Homogeneity of the experimental plot
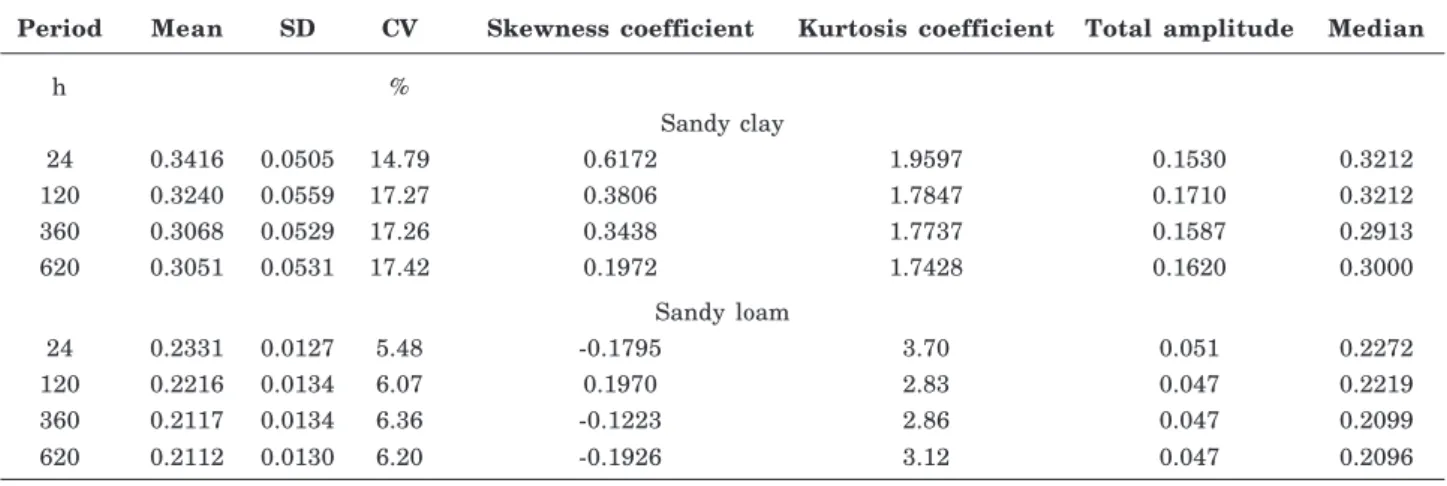
The coefficients of skewness and kurtosis indicated normal distribution of moisture in the monitored profile in the four evaluation periods, according to the criteria established by Jones (1969), at a confidence level of 95 % (Table 2). Based on the values of the
variation coefficients and the mean and median values, it was concluded that the system of initial soil saturation adequately supplied the lysimeters with water, ensuring the desired homogeneity for the experiment.
In figure 3, the behavior of the average moisture values over time at four depths is shown for both soils. Apparently, at the depths (z), z- 0.2, z-0.4, z-0.6 and z0.8 m, the moisture values obtained by the averages of the four horizontal distances (r) of monitoring peaked, respectively, in 0.367±0.010, 0.3360±009, 0.3460±019 and 0.3540±012 cm3 cm-3 in the sandy
clay soil and 0.2550±017, 0.2800±016, 0.2780±039 and 0.3040±004 cm3 cm-3 in the sandy loam soil.
These were below the maximum moisture values obtained when calibrating the Ka and θ values of the probes in the laboratory (Figure 1). Since the reduction rates of moisture with time (curve slope) were similar at all evaluated depths (Figure 3), Libardi & Melo Filho (2006) suggested that the redistribution and drying process was rather uniform throughout the period of evaluation.
Period Mean SD CV Skewness coefficient Kurtosis coefficient Total amplitude Median
h %
Sandy clay
24 0.3416 0.0505 14.79 0.6172 1.9597 0.1530 0.3212
120 0.3240 0.0559 17.27 0.3806 1.7847 0.1710 0.3212
360 0.3068 0.0529 17.26 0.3438 1.7737 0.1587 0.2913
620 0.3051 0.0531 17.42 0.1972 1.7428 0.1620 0.3000
Sandy loam
24 0.2331 0.0127 5.48 -0.1795 3.70 0.051 0.2272
120 0.2216 0.0134 6.07 0.1970 2.83 0.047 0.2219
360 0.2117 0.0134 6.36 -0.1223 2.86 0.047 0.2099
620 0.2112 0.0130 6.20 -0.1926 3.12 0.047 0.2096
Table 2. Descriptive statistics for soil moisture (cm3 cm-3) at the 16 monitoring points in four periods during
the redistribution of water in soil
0.4
0.35
0.3
0.25
0.2
0.15
0 100 200 300 400 500 600 700
z-0.2 m (Sandy Loam) z-0.6 m (Sandy Loam) z-0.2 m (Sandy Clay) z-0.6 m (Sandy Clay)
X
+
z-0.4 m (Sandy Loam) z-0.8 m (Sandy Loam) z-0.4 m (Sandy Clay) z-0.8 m (Sandy Clay)
X
_
Time, h
Soil moisture, cm
cm
3
-3
Diagnosis of the estimated percolation levels
The linear regressions between the observed and estimated percolation data for the different scenarios are shown in figure 4. The coefficients of determination indicated that the quality of regression generally increased with the increase in the number of
monitoring probes, which was reinforced by the reduction in the RMSE values (Table 2). Nevertheless, based on the values of the regression coefficients, it was observed that the unit values (1 mm) of observed percolation levels corresponded in the mean to estimated values in the order of 0.786, 0.838, 1.06, and
Figure 4. TDR-estimated and lysimeter-measured percolation levels.
TDR-estimated percolation, mm
12S 16S Sandy clay
4S 8S
12S 16S
Sandy-loam
4S 8S
L
ysimeter
-measured Percolation, mm
y = 0.5162 + 0.6156 x
R2 = 0.6842
y = 0.3728 + 0.7494 x
R2 = 0.7804
y = 0.0201 + 0.9196 x
R2 = 0.8884
y = -0.0474 + 1.0732 x
R2 = 0.8937
y = 0.0073 + 0.3989 x
R2 = 0.8782
y = -0.0492 + 0.6324 x
R2 = 0.9192
y = 0.2892 + 0.6661 x
R2 = 0.967
y = 0.1821 + 0.63 x
R2 = 0.9536
^ ^
^ ^
^ ^
0.88 mm when using 4, 8, 12, and 16 probes, respectively, in the evaluation of the sandy clay soil. For the sandy loam soil, the regression coefficients indicated that the average variation per unit in
observed percolation levels corresponded to 2.49, 1.50, 1.29, and 1.06 mm of the estimated variable. Despite the apparent consistence of the observed percolation levels with the estimated values using the TDR (R2
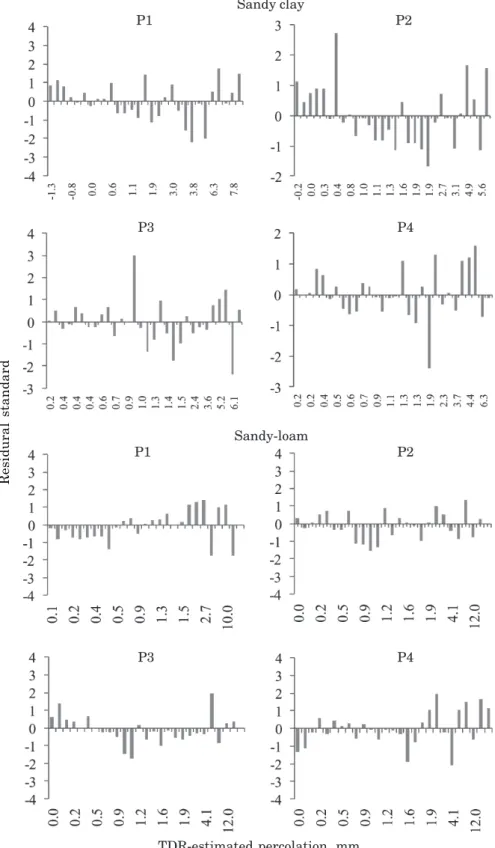
Figure 5. Residual standard errors of regression coefficients of the TDR-estimated and lysimeter-measured percolation levels.
P3 P4 Sandy clay
P1 P2
Sandy-loam
P1 P2
P3 P4
TDR-estimated percolation, mm
of 0.87-0.96), the combined null hypotheses were rejected, i.e., the percolation estimates differed from the data measured in the drainage lysimeter using up to 16 probes in the sandy loam soil (p<0.05). For the sandy clay soil the observed and estimated percolation values were best adjusted with 3-4 probe batteries at each of the four depths (12 and 16 monitoring probes); the combined null hypothesis was true (p>0.05), i.e., the estimated and observed percolation levels were equivalent (Table 3). Although these results were obtained in an experiment assuming a unidimensional flow (Libardi, 2005; Reichardt & Timm, 2012), an accurate monitoring of the drainage process in the profile requires more than two probe batteries monitoring the moisture. Quantifying the percolation in an area planted with
Pinus sylvestris, Wessolek et al. (2008) used 95 TDR
probes in a profile (depth 1 m, width 2.9 m) and identified a preferential flow in the soil. An evaluation of the accuracy of percolation estimated with HYDROS 1-D in drainage lysimeters by Selle et al. (2011) was, according to the authors unsuccessful, since the model was not able to identify the preferential flow. The same problem was mentioned by Séré et al. (2012).
The residuals standard error of regressions obtained based on the TDR-estimated and lysimeter-measured percolation levels was diagnosed from the distribution of values around zero (Figure 5). The effect of the increased percolation levels did not influence the estimates of equations 4 and 5. The residual standard remained constant with this increase, i.e., no tendency was observed at the points, which were randomly distributed around zero. Thus, according to Draper & Smith (1966), the variance of residues of the estimated percolation levels by the method presented can be considered homoscedastic. Two outliers were detected among the confidence intervals of these residues in the sector P3 of sandy clay soil, whereas in the other cases, 95 % or more of the residual values were within the limits (-2.2).
CONCLUSIONS
1. A higher number of probes in the water monitoring system results in an approximation of the percolation levels estimated from TDR–based moisture data to the levels measured by lysimeters for soils with different textures.
2. For sandy clay soils, three batteries with four probes at depths of 0.20, 0.40, 0.60 and 0.80 m at a distance of 0.20, 0.40 and 0.6 m from the center of lysimeters are sufficient to estimate the percolation with similar values to the observed levels.
3. In sandy loam soils, the observed and predicted percolation levels were not equivalent, even when using four batteries with four probes each, at depths of 0.20, 0.40, 0.60, and 0.80 m.
LITERATURE CITED
BARAM, S.; KURTZMAN, D. & DAHAN, O. Water percolation through a clayey vadose zone. J. Hydrol., 424/425, 165-171, 2012.
CAMPOS, J.H.B.; SILVA, V.P.R.; AZEVEDO, P.V.; BORGES, C.J.R.; SOARES, J.M.; MOURA, M.S.B. & SILVA, B.B. Evapotranspiração e produtividade da mangueira sob diferentes tratamentos de irrigação. R. Bras. Eng. Agríc. Amb., 12:150-156, 2008.
CATALDO, A.; CANNAZZA, G.; BENEDETTO, E. & GIAQUINTO, N. A new method for detecting leaks in underground water pipelines. IEEE Sens. J., 12: 1660-1667, 2012.
DRAPER, N.R. & SMITH, H. Applied regression analysis. New York, J. Wiley, 1966. 709p.
EMPRESA BRASILEIRA DE PESQUISA AGROPECUÁRIA -EMBRAPA. Manual de métodos de análises de solo. 2.ed. Rio de Janeiro, 1997. 212p.
GHIBERTO, P.J. & MORAES, S.O. Comparação de métodos de determinação da condutividade hidráulica em um Latossolo Vermelho-Amarelo.R. Bras. Ci. Solo, 35:1177-1188, 2011. JI, X.B.; KANG, E.S.; CHEN, R.S.; ZHAO, W.Z.; ZHANG, Z.H. & JIN, B.W.A. Mathematical model for simulating water balances in cropped sandy soil with conventional flood irrigation applied. Agric. Water Manage., 87:337-346, 2007. JIMÉNEZ-MARTÍNEZA, J.; SKAGGS, T.H.; van GENUCHTEN, M.Th. & CANDELA, L. A root zone modelling approach to estimating groundwater recharge from irrigated areas. J. Hydrol., 367:138-149, 2009. JONES, T.A. Skewness and kurtosis as criteria of normality
in observed frequency distributions. J. Sedim. Petrol., 39:1622-1627, 1969.
LIBARDI, P.L. Dinâmica da água no solo. São Paulo, EDUSP, 2005. 335p.
Item P1 P2 P3 P4
Sandy clay
Intercept 0.615 0.372 0.479 -0.047
Slope 0.516 0.749 0.919 1.073
Valor P (H0: a = 0 and b = 1) <0.01 <0.01 0.2447 0.469
RMSE 1.566 1.115 0.703 0.670
Sandy loam
Intercept 0.007 -0.049 0.182 0.144
Slope 0.3989 0.632 0.629 0.666
Value P (H0: a = 0 and b = 1) <0.01 <0.01 <0.01 <0.01
RMSE 3.758 1.601 1.383 1.108
LIBARDI, P.L. & MELO FILHO, J.F. Análise exploratória e variabilidade dos parâmetros da equação da condutividade hidráulica, em um experimento de perfil instantâneo. R. Bras. Ci. Solo, 30:197-206, 2006.
MAYER, D.G.; STUART, M.A. & SWAIN, A.J. Regression of real-world data on model output: An appropriate overall test of validity. Agric. Syst., 45:93-104, 1994.
MUBARAK, I.; ANGULO-JARMILLO, R.; MAILHOL, J.C.; RUELLE, P.; KHALEDIAN, M. & VAUCLIN, M. Spatial analysis of soil surface hydraulic properties: Is infiltration method dependent? Agric. Water Manage., 97:1517-1526, 2010. PREVIATI, M.; CANONE, D.; BEVILACQUA, I.; BOETTO, G.; POGNANT, D. & FERRARIS, S. Evaluation of wood degradation for timber check dams using time domain reflectometry water content measurements. Ecol. Eng., 44:259-268, 2012.
REICHARDT, K. & TIMM, L.C. Solo, planta e atmosfera: Conceitos, processos e aplicações. 2.ed. Barueri, Manole, 2012. 524p.
SCHELDE, K.; RINGGAARD, R.; HERBST, M.; THOMSEN, A.; FRIBORG, T. & SOGAARD, H. Comparing evapotranspiration rates estimated from atmospheric flux and TDR soil moisture measurements. Vadose Zone J., 10:78-83, 2011.
SELLE, B.; MINASNY, B.; BETHUNE, M.; THAYALAKUMARAN, T. & SUBHASH, C. Applicability of Richards’ equation models to predict deep percolation under surface irrigation. Geoderma, 160:569-578, 2011.
SÉRÉ, G.; OUVRARD, S.; MAGNENET, V.; PEY, B.; MOREL, J.L. & SCHWARTZ, C. Predictability of the evolution of the soil structure using water flow modeling for a constructed Technosol. Vadose Zone J., 11: doi:10.2136/ vzj2011.0069, 2012.
SILVA, A.J.P.; COELHO, E.F.; MIRANDA, J.H. & WORKMAN, S.R. Estimating water application efficiency for drip irrigation emitter patterns on banana. Pesq. Agropec. Bras., 44: 730-737, 2009a.
SILVA, M.M.; LIBARD, P.L. & FERNANDES, F.C.S. Nitrogen doses and water balance components at phenological stages of corn. Sci. Agríc., 66:515-521, 2009b.
SKAGGS, T.H.; SHOUSE, P.J. & POSS, J.A. Irrigating forage crops with saline waters: 2. Modeling root uptake and drainage. Vadose Zone J., 5:824-837, 2006.
SOUZA, C.F. & FOLEGATTI, M.V. Spatial and temporal characterization of water and solute distribution patterns. Sci. Agric. Braz., 67:9-15, 2010.
TOPP, G.C.; DAVIS, J.L. & ANNAN, A. Electromagnetic determination of soil water content: measurement in coaxial transmission lines. Water Resour. Res., 16:574-582, 1980. WESSOLEK, G.; SCHWARZEL, K.; GREIFFENHAGEN, A.
& STOFFREGEN, H. Percolation characteristics of a water-repellent sandy forest soil. Eur. J. Soil Sci., 59:14-23, 2008.
WILLIS, T.M.; SCOTT BLACK, A. & MEYER, S.W. Estimates of deep percolation beneath cotton in the Macquarie Valley. Irrig. Sci., 17:141-150, 1997.