Evapotranspiration and crop
coefficient of cucumber in greenhouse
Revista Brasileira de Engenharia Agrícola e Ambiental, v.7, n.2, p.285-291, 2003Campina Grande, PB, DEAg/UFCG - http://www.agriambi.com.br
Flávio F. Blanco1 & Marcos V. Folegatti2
1 USP/ESALQ, Depto. de Engenharia Rural, CP 9, CEP 13418-900, Piracicaba, SP. Fone: (19) 3429-4217, Ramal: 268.
E-mail: [email protected] (Foto)
2 USP/ESALQ, Depto. de Engenharia Rural. Fone: (19) 3429-4380. E-mail: [email protected]
Abstract: The evapotranspiration (ETc) and crop coefficient (Kc) of cucumber in a greenhouse were determined during the winter-spring season in Piracicaba, SP, Brazil. Crop was irrigated with water of three different levels of salinity: S1 = 1.5, S2 = 3.1 and S3 = 5.2 dS m-1. Electrical conductivity
of S1 was obtained only by addition of fertilizers, as fertigation was used, and the S2 and S3 levels in addition to fertilizers received magnesium sulphate, calcium chloride and sodium chloride. Cucumber seedlings, cv. Hokushin, were grafted on squash, transplanted on beds in double rows and directed vertically with a single stem. Irrigation was performed when soil matric potential reached -30 kPa, which was determined by the mean matric potential at 0.15 and 0.30 m depths, and the depth of irrigation was calculated from a reduced-evaporation pan. A randomized block design was adopted with three replications. The ETc and Kc were found to reduce linearly by the salinity of the irrigation water with reduction in ETc of 4.6% for unit increase of salinity. Due to the reduced evapotranspiration in saline treatments, deep percolation was increased by saline water and corresponded to 4, 7 and 17% of the total applied water in S1, S2 and S3, respectively. Measured Kc values for S1 were very close to the estimated values thus the combined use of tensiometers and evaporation pan was found to be adequate for irrigation management in greenhouse.
Key words: water balance, water flow, deep percolation, evaporation pan
Evapotranspiração e coeficiente de cultivo
do pepino em ambiente protegido
Resumo: Determinaram-se a evapotranspiração (ETc) e o coeficiente de cultivo (Kc) do pepino em ambiente protegido durante o período de inverno-primavera em Piracicaba, SP, Brasil. A cultura foi irrigada com água de três diferentes níveis de salinidade: S1 = 1,5, S2 = 3,1 e S3 = 5,2 dS m-1. A condutividade elétrica de S1 foi obtida apenas pelos fertilizantes, uma vez
que se utilizou a fertirrigação, e os níveis S2 e S3 além de fertilizantes receberam sulfato de magnésio, cloreto de cálcio e cloreto de sódio. Mudas de pepino, cv. Hokushin, foram enxertadas em abóbora, transplantadas em canteiros em filas duplas e conduzidas na vertical em haste simples. As irrigações foram realizadas quando o potencial mátrico do solo atingia -30 kPa, o qual foi determinado pelo potencial mátrico médio a 0,15 e 0,30 m de profundidade e a lâmina de irrigação foi calculada com base em um minitanque de evaporação. O delineamento experimental foi em blocos casualizados com três repetições. A ETc e o Kc diminuíram linearmente com a salinidade da água de irrigação, com redução da ETc de 4,6% para cada unidade de salinidade. Devido à menor evapotranspiração nos tratamentos salinos, a percolação profunda aumentou com a salinidade da água e correspondeu a 4, 7 and 17% da lâmina total de água aplicada em S1, S2 e S3, respectivamente. Os valores medidos de Kc para S1 foram muito próximos dos valores estimados; portanto, o uso combinado de tensiômetros e tanque de evaporação foi adequado para o manejo da irrigação em ambiente protegido.
Palavras-chave: balanço hídrico, fluxo de água, percolação profunda, tanque de evaporação
Protocolo 3 - 11/3/2003 - Aprovado em 24/7/2003
INTRODUCTION
Cucumber demands high temperatures and soil moisture for satisfactory yield and under unfavourable climatic conditions, several problems may occur, such as the reduction of female flowers (Cantliffe, 1981), delay in fruit growth (Liebig,
autumn-winter season due to the higher temperature promoted by the cover, thus allowing the cultivation in periods of larger profitability.
Knowledge of the water uptake of greenhouse crops, or evapotranspiration (ETc), is one of the most important factors as irrigation is responsible for the totality of soil available water in the root zone. Various methods may be used to estimate ETc inside greenhouses, but the method based on pan evaporation (Epan) is the most common and easy to use, since the ETc is estimated by:
ETc = Kc Kp Epan
where:
ETc - crop evapotranspiration, mm Kc - crop coefficient
Kp - pan coefficient
Epan - Class A pan evaporation, mm
The advantage of using Kc for estimating the irrigation requirement is that generalized tables of Kc vs. time or crop development stage can be readily determined from field experiments and these tables are usually transferable over a large range of climates (Allen, 1993). While the tables of Kc for a given crop usually consider the same value for a given growth period (Doorenbos & Pruitt, 1977; Chamundeshwari et al, 1997; Roca et al., 1998), it has been shown that Kc varies constantly along the crop season (Loomis & Crandall, 1977; Eliades, 1988; Ells et al., 1989). With annual crops, an increase is observed in the ETc/Epan ratio from planting to the middle of the growing period and during the last stages of crop growth there is a decrease (Doorenbos & Kassam, 1979).
The salinity of the irrigation water affects the amount of deep percolation for a given amount of applied water because evapotranspiration is related to salinity; salinity results in stunted growth of the crop, thus reducing evapotranspiration (Letey, 1999). Rhoades & Loveday (1990) state that the salinity effects on evapotranspiration are predominantly related to water stress, with a decrease in osmotic potential of soil water reducing the water availability for plants. Probably, both effects influence ETc and their combined effects result in the reduction of ETc and, consequently, in the reduction of the plant development and yield.
The objective of the study reported here was to determine the evapotranspiration of cucumber irrigated with water of different salinities in a greenhouse.
MATERIAL AND METHODS
The experiment was conducted in a greenhouse located in the experimental area of the Department of Rural Engineering of the Escola Superior de Agricultura “Luiz de Queiroz” - USP, in Piracicaba, SP. Area of the greenhouse was 110 m2 (6.3 x 17.5
m) with 2.8 m height of lateral openings, covered with a polyethylene film of 0.15 mm thickness and with lateral curtains which were closed at night and during rainy season in order to avoid the rain water wetting the experimental plots. Soil was of clay texture with percentages of clay, silt and sand of 50, 13
and 37%, respectively, in the 0-0.2 m layer, with good internal drainage.
Cucumber seedlings, cv. Hokushin, grafted on squash,
Cucurbita spp., were transplanted to three beds on June 23,
1999. Each bed was divided into nine plots and each plot received two rows of plants, spaced at 0.7 m between rows and 0.4 m between plants, giving a planting density of 2.5 plants m-2.
A drip irrigation system was used with a 4 L h-1 dripper per
plant, located at 0.02 m from the plant. Plants were directed with a single stem along and around a vertical plastic string.
Treatments were composed of three irrigation water salinities: S1 = 1.5, S2 = 3.1 and S3 = 5.2 dS m-1. Ammonium sulphate,
calcium nitrate, potassium nitrate, potassium chloride, phosphoric acid and magnesium sulphate fertilizers were applied through the irrigation system in all irrigations. Details about the fertigation management are presented elsewhere (Blanco & Folegatti, 2002). S1 water received only the fertilizers, while for S2 and S3, calcium chloride, magnesium sulphate and sodium chloride were added in order to obtain the desired salinity. The salts were mixed in order to obtain a nutritive solution for S2 and S3 with (Na+K)/Ca:Mg ratio of 5:3:2.
A reduced-evaporation pan located in the middle of the greenhouse between two beds and tensiometers installed at 0.15 and 0.30 m depths, placed at 0.10 m from the plant and dripper, determined irrigation requirements. Water was applied whenever the mean soil matric potential was below -30 kPa in the S1 plots. Irrigation water depth calculation was based on pan evaporation:
ETc* = Kc Kp Erpan C
where:
ETc*- estimated crop evapotranspiration, mm
Kc - adopted value of Kc Kp - pan coefficient
Erpan - reduced pan evaporation, mm
C - correction factor to convert the reduced pan evapora-tion into the Class A pan evaporaevapora-tion (C = 0.88; Medeiros et al., 1997)
The Kp value was assumed to be 1.0, as recommended by Martínez-Raya & Castilla (1989) and Castilla et al. (1990) for greenhouse conditions. The Kc value adopted in each irrigation was adjusted from the tensiometer readings at 0.30 m depth. When 0.30 m tensiometer indicated that soil moisture did not reach field capacity 24 h after irrigation, the Kc adopted for the next irrigation was increased, thus increasing the irrigation depth. On the other hand, if the 0.30 m tensiometer indicated an overirrigation on the previous day, Kc adopted was reduced in next irrigation.
Controlled irrigations started 19 days after transplanting (DAT) because no response of the tensiometers was observed before. Tensiometers were also installed at 0.5 and 0.7 m depth in order to estimate the crop water uptake or ETc. Estimations of ETc were made by the soil water balance:
ETc -q R I P
W r
± ± + = ∆
(1)
(2)
where:
∆W - change in water content, mm P - precipitation, mm
I - irrigation, mm R - runoff, mm q - soil water flux, mm
ETc - crop evapotranspiration, mm
Under the conditions of the present study, the terms P and R could be considered zero and, after rearrangement, the general equation becomes (Chartzoulakis & Drosos, 1995):
q I
ETc r
± =
which assumes that the ETc between two successive irrigations is a sum of the water depth added to the soil by I and capillary raise (+q) or deep percolation (-q).
It was assumed that there were no roots beyound 0.60 m depth because: i) the presence of a compacted layer at 0.20-0.30 m depth due to successive ploughing along the years and ii) irrigation frequency was high and soil moisture in the shallower layers was close to field capacity. Thus, q was calculated for the boundary depth of 0.60 m, that corresponds to the effective rooting depth of cucumber (Loomis & Crandall, 1977; Ells et al., 1989), from the tensiometer readings at 0.50 and 0.70 m depth by the Richard’s equation (Richards, 1928), adapted by Kemper & Evans (1963) for soils with an osmotic potential gradient:
( )
è[
H o]
K
q=− ∇φ +σ∇φ
r r
r
where:
K(θ) - hydraulic conductivity in relation to θ, mm d-1
∇φH - total hydraulic potential gradient of soil water, m m-1
σ - osmotic efficiency factor
∇φo - osmotic potential gradient, m m-1
The φH is the sum of the matric (φm) and gravitational (φg) potentials. Soil samples for salinity measurements were collected on 20, 76 and 116 DAT and the osmotic potential was calculated from Eq. (6) proposed by Jurinak & Suarez (1990):
U Us ECe 40 -o = φ
where:
φo - osmotic potential of the soil solution, kPa
ECe - electrical conductivity of the soil saturation extract, dS m-1
Us - soil water content at saturation, g g-1
U - actual soil water content, g g-1
The effect of ∇φo on water flow is debatable (Kemper & Evans, 1963; Kemper & Rollins, 1966; Letey, 1968; Nielsen et al., 1972). Richard’s equation has been used to describe water flow through soils, while using this equation, it must be
assumed that osmotic pressure does not exist or, if such gradient exists, its effects on water movement are negligible. However, in the present study, the ∇φo exists and its effects on water flow should be taken into account. Based on the Letey (1968) statements, for a soil that does not restrict the solute movement, the following approach was used:
If -25 < φm < 0 kPa →σ = 0
If φm < -25 kPa →σ = 0.03
The unsaturated hydraulic conductivity at 0.60 m depth was obtained by Medeiros (1998):
-3.7 h 6000
K(h)=
where K(h) is the hydraulic conductivity, in mm d-1, as a function
of the module of matric potential (h, kPa) of the soil water. The K(h) function was preferred instead of K(θ) because the function adjusted better with h than with θ, probably because the soil moisture readings were made by tensiometers.
Adjustments of calculated q were needed because only a fraction of the soil was wetted by the drip irrigation system. Calculated q values were adjusted according to the procedure described by Medeiros (1998).
With values of ETc determined by Eq. 4, the Kc values were calculated for each irrigation interval by the rearrangement of the Eq. 2:
0.88 Erpan
ETc
Kc=
where ETc and Erpan were the accumulated values between two successive irrigations.
Experimental design was in randomized blocks with three replications. The analysis of variance was performed to verify the effects of the water salinity levels on ETc and q.
RESULTS AND DISCUSSION
Temperature data recorded outside the greenhouse and estimated Class A pan evaporation (Epan) inside the greenhouse are shown in Figure 1. Average temperature and Epan were 19.3 ºC and 1.7 mm d-1, respectively. Due to the low
atmospheric water demand, expressed by the low values of Epan, mean irrigation interval was 3.3 days, that is, approximately ten irrigations per month, which is below the frequency commonly used by greenhouse-cucumber growers of São Paulo State.
In the early growing season, Kc adopted was about 0.8 and increased to 1.6 in the late season following a sigmoid function (Figure 2). It can be seen from Figure 2 that Kc was not constant for any specific phenological stage and using a fixed value could result in an over- or underestimation of the water depth to be applied, which may reduce significantly the crop yield as
→
→ →
→
→
→
→
→
→
→
→
(4)
(5)
(6)
to 17.9, 17.1 and 14.2 mm week-1, respectively, due to higher
atmospheric (Epan) and plant demand, once the yield increased after the lateral stems began producing.
0 5 10 15 20 25 30 35
40 Tmax
Tav Tmin
A.
B.
0 20 40 60 80 100 120
0 1 2 3 4
Epan (mm)
T
emperature (
oC)
DAT
Figure 1. Daily observed temperature outside and Class A pan evaporation (Epan) inside the greenhouse for each day after transplanting (DAT) during the cucumber-growing season
0.0 0.4 0.8 1.2 1.6 2.0
0 20 40 60 80 100 120
D A T
0.0054
0.29131 52 DAT -EXP 1
1.547 -0.024
Kc
+
+ + =
r2= 0.85
Figure 2. Values of Kc adopted and the regression curve in each irrigation during the cucumber growing season in relation to the days after transplanting (DAT)
cucumber and most vegetable crops are sensitive to water stress (Ells et al., 1989).
ETc was slightly reduced by S2 treatment and to a great extent by S3 in relation to S1 (Figure 3). Water uptake rate was very low in the first 17 DAT and increased rapidly there after, when plants overcame the transplanting stress and the root and shoot development rate increased. Mean weekly water uptake from 17 to 82 DAT was 11.8, 11.5 and 10.7 mm week-1 for
S1, S2 and S3, respectively. Uptake rate increased after 82 DAT
DAT
0 20 40 60 80 100 120
0 50 100 150
200 S1
S2 S3
ET
c (mm)
Figure 3. Accumulated cucumber evapotranspiration (ETc) for different water salinity treatments along the growing season
Total ETc was linearly reduced by water salinity, with a reduction of 8.7 mm or 4.6% for each unit of water salinity increased (Figure 4). This result is close to that observed for various other crops, like barley and wheat (Heakal et al., 1990), maize and sunflower (Katerji et al., 1996), sugar beet (Katerji et al., 1997) and pepper (Medeiros, 1998).
y = -8.67x + 204 r2 = 0.93**
150 160 170 180 190 200
0 1 2 3 4 5 6
ECiw (dS m -1
)
ET
c
(m
m
)
Figure 4. Relation between cucumber evapotranspiration (ETc) and the electrical conductivity of the irrigation water (ECiw)
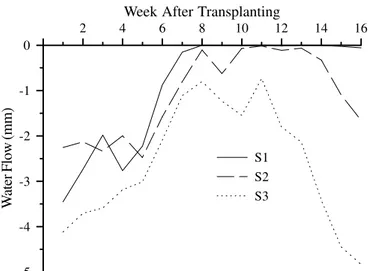
Water flow at 0.60 m depth was always negative, that is, only deep percolation (D) occurred at the bottom of the root system and capillary rise did not contribute to ETc at any time during the growing season (Figure 5). Deep percolation was higher in the first five weeks after transplanting for all treatments, when ETc was low because of shallow root system in the early season. After that, pronounced decrease of D was observed, which assumed negligible values for S1 after the eighth week. Very low values of D were observed for S2 between the eighth and fourteenth weeks, with an increase after that due to the yield reduction and leaf senescence in the late season, which reduced ETc and, consequently, increased D. For S3 the variation of D along the growing season was similar to that for S2, although the values of D were always higher for S3 than for the other treatments.
W ater depth drained below the root zone increased linearly with irrigation water salinity and corresponded to 4, 7 and 17% of the total irrigation applied (Figure 6). The effect of salinity on D is a function of the lower ETc for the plants irrigated with higher water salinities. Soil water content at the moment of irrigation and during the redistribution process is higher for saline soils, which allows soil to maintain a high hydraulic conductivity and hydraulic gradient, favouring the occurrence of higher deep percolation compared to a soil that is drying rapidly, as demonstrated by Meiri et al. (1977).
dependent of the plant demand, increasing its value. On the other hand, under high temperature and low relative humidity conditions, Kc tends to decrease due to the higher Epan where there is no restriction of water to evaporate. Fluctuations in Kc values in the midseason were also found for other crops, like watermelon (Freitas et al., 1999), grapes (Teixeira et al., 1999), melon (Miranda et al., 1999) and corn (Bezerra & Oliveira, 1999).
0 2 4 6 8 10 12 14 16
-5 -4 -3 -2 -1 0
S1 S2 S3
Week After Transplanting
W
ater Flow (mm)
Figure 5. Water flow at the 0.60 m soil depth on plots irrigated with water of different levels of salinity for each week after transplanting
y = 7.62x r2 = 0.91**
0 10 20 30 40 50
0 1 2 3 4 5 6
ECiw (dS m -1
)
Figure 6. Relation between deep percolation (beyond 0.60 m soil depth) and the electrical conductivity of the irrigation water (ECiw)
Kc values calculated by Eq. 8 for each treatment are shown in Figure 7. Constant and rapid increase of Kc was observed in the first 45 DAT, growing from 0.19, 0.22 and 0.06 at 5 DAT to 1.49, 1.44 and 1.41 at 45 DAT for S1, S2 and S3, respectively. Between 55 and 105 DAT, Kc values oscillated and the mean values were 1.49, 1.45 and 1.26, and decreased to 0.73, 0.62 and 0.44 at 115 DAT. Oscillation of Kc in the midseason was due to the oscillation of the meteorological variables with consequent effects on Epan. As ETc is a function of the atmospheric and plant water demand, when the former is decreased, Kc is more
DAT
0 20 40 60 80 100 120
Kc
0,0 0,5 1,0 1,5 2,0
S1 S2 S3
Figure 7. Calculated values of the crop coefficient (Kc) for cucumber for different salinities of the irrigation water along the crop-growing season (DAT - days after transplanting)
Allen et al. (1998) stated that Kc of 1.15 can be taken for cucumber grown on stalks in the midseason for open field conditions. However, Kc reached 1.5 ten days after the begin-ning of the productive period of picking cucumber, hybrid Pioneer, cultivated in open field (Loomis & Crandall, 1977). In greenhouse, the Kc of the cv. Maram was about 1.2 at the end of the season (Eliades, 1988); however, Kc was obtained by the ratio ETc/Epan, with ETc measured in lysimeter and the evaporation pan installed outside the greenhouse. This Kc value should be at least 1.6 if the pan was installed inside the greenhouse, as evaporation reduction of about 30-50% was observed inside greenhouses, mainly due to the reduction of the solar radiation and heat transfer by advection on evaporation (Abou-Hadid et al., 1991; Medeiros et al., 1997).
Values of Kc were very close to Kc adopted in irrigations and the deep percolation for S1 plots were low and occurred mainly in the initial stages of the crop development, when root system was restricted to a few centimeters depth. Thus, the method used here to estimate Kc, based on pan evaporation and tensiometer readings, was found to be suitable for most purposes where the real values of Kc are unknown.
CONCLUSIONS
1. Cucumber evapotranspiration reduced linearly with irrigation water salinity, with a reduction of 4.6% for each unit increase of electrical conductivity (dS m-1).
2. Deep percolation increased with water salinity, as a result of the reduction in evapotranspiration and higher soil moisture before irrigation.
3. Crop coefficient was decreased by water salinity and oscillated along the growing period accordingly to the variations in meteorological variables and plant development.
ACKNOWLEDGMENTS
To Fundação de Amparo à Pesquisa no Estado de São Paulo, FAPESP, for the financial support.
LITERATURE CITED
Abou-Hadid, A.F.; El-Beltagy, A.S.; El-Khima, S. Pan evaporation as affected by plastic house microclimate. Acta Horticulturae, The Hague, n.287, p.35-46, 1991.
Allen, R.G. New approaches to estimating crop evapotrans-piration. Acta Horticulturae, The Hague, n.335, p.287-293, 1993.
Allen, R.G.; Pereira, L.S.; Raes, D.; Smith, M. Crop evapotrans-piration: guidelines for computing crop water require-ments. Rome: FAO, 1998. 300p. Irrigation and Drainage Paper, 56
Bakker, J.C.; Sonneveld, C. Calcium deficiency of glasshouse cucumber as affected by environmental humidity and mineral nutrition. Journal of Horticultural Science, London, v.63, n.2, p.241-246, 1988.
Bezerra, F.M.L.; Oliveira, C.H.C. Evapotranspiração máxima e coeficientes de cultura para o milho em Fortaleza, CE. Engenharia Agrícola, Jaboticabal, v.19, n.1, p.8-17, 1999.
Blanco, F.F.; Folegatti, M.V. Manejo da água e nutrientes para o pepino em ambiente protegido sob fertirrigação. Revista Brasileira de Engenharia Agrícola e Ambiental, Campina Grande, v.6, n.2, p.251-255, 2002.
Cantliffe, D.J. Alteration of sex expression in cucumber due to changes in temperature, light intensity, and photope-riod. Journal of the American Society of Horticultural Science, Geneva, v.106, n.2, p.133-136, 1981.
Castilla, N.; Elias, F.; Fereres, E. Evapotranspiracion de cultivos horticolas en invernadero en Almeria. Investigacion Agraria: Produccion y Proteccion Vegetal, Madrid, v.5, p.117-125, 1990.
Chamundeshwari, C.; Rao, V.P.; Sarma, P.S.; Rao, P.R. Crop coefficients for sunflower (Helianthus annuus) as influenced by water deficit at different crop-growth subperiods. Indian Journal of Agricultural Sciences, Delhi, v.67, n.3, p.136-138, 1997.
Chartzoulakis, K.; Drosos, N. Water use and yield of green-house grown eggplant under drip irrigation. Agricultural Water Management, Amsterdam, v.28, n.2, p.113-120, 1995. Doorenbos, J.; Kassam, A.H. Yield response to water. Rome:
FAO, 1979. 193p. Irrigation and Drainage Paper, 33 Doorenbos, J.; Pruitt, W.O. Guidelines for predicting crop water
requirements. 2.ed. Rome: FAO, 1977. 179p. Irrigation and Drainage Paper, 24
Eliades, G. Irrigation of greenhouse-grown cucumbers. Journal of Horticultural Science, London, v.63, n.2, p.235-239, 1988. Ells, J.E.; Kruse, G.; McSay, A.E. Scheduling irrigations for cucumbers. HortScience, St. Joseph, v.24, n.3, p.448-452, 1989.
Freitas, A.A.; Bezerra, F.M.L.; Fontenele, F.C.B. Determinação da evapotranspiração máxima e real e do fator de sensibi-lidade ao déficit hídrico da melancia em Canindé, CE. Revista Brasileira de Engenharia Agrícola e Ambiental, Campina Grande, v.3, n.3, p.298-303, 1999.
Heakal, M.S.; Modaihsh, A.S.; Mashhady, A.S.; Metwally, A.I. Combined effects of leaching fraction, salinity, and potassium content of water on growth and water-use efficiency of wheat and barley. Plant and Soil, Dordrecht, v.125, n.2, p.177-184, 1990.
Jurinak, J.J.; Suarez, D.L. The chemistry of salt-affected soils and waters. In: Tanji, K.K. (ed.) Agricultural salinity assessment and management. New York: ASCE, 1990. cap3, p.42-63. Manuals and Reports on Engineering Practice, 71 Katerji, N.; Hoorn, J.W.; Hamdy, A.; Karam, F.; Mastrorilli, M. Effect of salinity on water stress, growth, and yield of maize and sunflower. Agricultural Water Management, Amsterdam, v.30, n.3, p.237-249, 1996.
Katerji, N.; Hoorn, J.W.; Hamdy, A.; Mastrorilli, M.; Karzel, E.M. Osmotic adjustment of sugar beets in response to soil salinity and its influence on stomatal conductance, growth and yield. Agricultural Water Management, Amsterdam, v.34, n.1, p.57-69, 1997.
Kemper, W.D.; Evans, N.A. Movement of water as affected by free energy and pressure gradients: III. Restriction of solutes by membranes. Soil Science Society of America Proceedings, Madison, v.27, n.5, p.485-490, 1963.
Kemper, W.D.; Rollins, J.B. Osmotic efficiency coefficients across compacted clays. Soil Science Society of America Proceedings, Madison, v.30, n.5, p.529-534, 1966.
Letey, J. Movement of water through soil as influenced by osmotic pressure and temperature gradients. Hilgardia, Berkeley, v.39, n.14, p.405-417, 1968.
Letey, J. Irrigation-drainage interaction. In: Skaggs, R.W.; Schilfgaarde, J. (ed.) Agricultural drainage. Madison: ASA/ CSSA/SSSA, 1999. cap.16, p.567-578. Agronomy, 38 Liebig, H.P. Physiological and economical aspects of cucumber
crop density. Acta Horticulturae, The Hague, n.118, p.149-164, 1981.
Loomis, E.L.; Crandall, P.C. Water consumption of cucumbers during vegetative and reproductive stages of growth. Journal of the American Society for Horticultural Science, Geneva, v.102, n.2, p.124-127, 1977.
Marcelis, L.F.M.; Baan Hofman-Eijer, L.R. Effect of temperature on the growth of individual cucumber fruits. Physiologia Plantarum, Kobenhavn, v.87, n.3, p.321-328, 1993.
Martínez-Raya, A.; Castilla, N. Evapotranspiracion del pimiento en invernadero en Almeria. ITEA: Produccion Vegetal, Zaragoza, n.85, p.57-62, 1989.
Medany, M.A.; Wadid, M.M.; Abou-Hadid, A.F. Cucumber fruit growth rate in relation to climate. Acta Horticulturae, The Hague, n.486, p.107-111, 1999.
Medeiros, J.F. Manejo da água de irrigação salina em estufa cultivada com pimentão. Piracicaba: ESALQ/USP, 1998. 152p. Tese Doutorado
Medeiros, J.F.; Pereira, F.A.C.; Folegatti, M.V.; Pereira, A.R.; Villa Nova, N.A. Comparação entre a evaporação em tanque Classe-A padrão e em minitanque, instalados em estufa e estação meteorológica. In: Congresso Brasileiro de Agrome-teorologia, 10, 1997, Piracicaba. Anais… Piracicaba: SBA,
Meiri, A.; Kamburov, J.; Shalhevet, J. Transpiration effects on leaching fractions. Agronomy Journal, Madison, v.69, n.5, p.779-782, 1977.
Miranda, F.R.; Souza, F.; Ribeiro, R.S.F. Estimativa da evapo-transpiração e do coeficiente de cultivo para a cultura do melão plantado na região litorânea do estado do Ceará. Engenharia Agrícola, Jaboticabal, v.18, n.4, p.63-70, 1999. Nielsen, D.R.; Jackson, R.D.; Cary, J.W.; Evans, D.D. Soil
water. Madison: ASA, SSSA, 1972. 175p.
Richards, L.A. The usefulness of capillary potential to soil moisture and plant investigators. Journal of Agricultural Research, Washington, v.37, p.719-742, 1928.
Rhoades, J.D.; Loveday, J. Salinity in irrigated agriculture. In: Stewart, B.A.; Nielsen, D.R. (ed.) Irrigation of agricultural crops. Madison: ASA/CSSA/SSSA, 1990. cap.36, p.1089-1142. Agronomy, 30