Incidence of
Sclerotinia sclerotiorum
and the physical and
physiological quality of soybean seeds based on processing stages
1Heria de Freitas Teles
2*, Larissa Leandro Pires
2, Marcos Gomes da Cunha
2,
Flavio Pereira dos Santos
2, Francisco Ameloti Neto
2ABSTRACT – Soybean (Glycine max L. Merrill) is infected by a large number of fungal pathogens, among them white mold agent [Sclerotinia sclerotiorum (Lib) de Bary]. The objective of this study was to verify the effect of the seed-processing stages on the physical and physiological qualities and on the incidence of S. sclerotiorum in soybean seeds. In this study, seeds from
eight cultivars coming from production fields naturally infested in the counties of the State of Goiás, Brazil, from two harvests
(2009/2010 and 2010/2011), were used. Samples were collected in the processing stages: hopper, pre-cleaning, discard one
(from pre-cleaning), cleaning, sieve classifiers, spiral, gravity table, and discard two (after cleaning until processing ending). The following parameters were evaluated: seed- moisture content, physical purity, germination and tetrazolium. Additional
tests and the detection of S. sclerotiorum in paper roll and the neon method were performed. The processing of soybean seeds improves the physical and physiological quality of the seed lots, in addition to eliminating sclerotia. The stages of pre-cleaning
and cleaning significantly reduce sclerotia in seed lot. The amount of sclerotia in the sample is not necessarily correlated with
the incidence of S. sclerotiorum in mycelial form.
Index terms: white mold, physical purity, germination, seed health tests, neon method.
Incidência de
Sclerotinia sclerotiorum
e qualidade física e fisiológica
em função das etapas do beneficiamento de sementes de soja
RESUMO - A soja (Glycine max L. Merrill) é infectada por grande número de patógenos, entre eles o agente causal do mofo-branco [Sclerotinia sclerotiorum (Lib) de Bary]. O objetivo deste trabalho foi verificar o efeito das etapas de beneficiamento nas qualidades física e fisiológica e na incidência de S. sclerotiorum em sementes de soja. Trabalhou-se com sementes de oito
cultivares provenientes de campos de produção naturalmente infestados em municípios do Estado de Goiás, de duas safras. Foram coletadas amostras nas etapas do beneficiamento: moega, pré-limpeza, descarte um (da pré-limpeza), limpeza, classificadores de peneira, espiral, mesa de gravidade e descarte dois (após a limpeza até o final do beneficiamento). Realizaram-se análises de grau de umidade, pureza física, germinação e tetrazólio, além dos testes para a detecção de S. sclerotiorum em rolo de papel e método
neon. O beneficiamento de sementes de soja aprimora as qualidades física e fisiológica do lote, além de eliminar os escleródios. As etapas de pré-limpeza e limpeza reduzem significativamente os escleródios das sementes. A quantidade de escleródios na amostra não está necessariamente correlacionada com a incidência de S. sclerotiorum na forma micelial.
Termos para indexação: mofo-branco, pureza física, germinação, teste de sanidade, método neon.
Submitted on 11/09/2012. Accepted for publication on 03/11/2013.
2Universidade Federal de Goiás, Escola de Agronomia, Caixa Postal 131, 74001-970 - Goiânia, GO, Brasil. *Corresponding author: <[email protected]>
Introduction
Soybean (Glycine max L. Merrill) is currently one of the most important crops in the world. In Brazil, 40% of the total grain producing area was grown with this legume during the 2011/2012 crop season. The main producers were the states of Mato Grosso, Paraná, Rio Grande do Sul and Goiás (CONAB, 2012). One of the main problems of the crop has been white mold, which
Because of this, seed processing may be a useful tool for the control of S. sclerotiorum, reducing or eliminating the contaminated/infected seeds and the sclerotia associated with them. It may still improve the physical and physiological quality of the lot by separating the seeds from impurities.
A relationship between the physical properties of seeds and their viability and vigor makes the stages of separation and classification even more important in view of the fact that larger seeds may have superior germination and vigor than the smaller ones, as verified in soybean (Pádua et al., 2010) and fodder radish (Nery et al., 2009). The physiological quality may also be improved by the removal of lower density seeds, normally badly formed, broken, attacked by insects or pathogens or deteriorated (Fessel et al., 2003). Thus, it is important to use gravity table and air-screen machines in order to improve the physical, physiological, and sanitary conditions of the seed lots, as observed by Fessel et al. (2003) in corn, by Giomo et al. (2004) in arabica coffee and by Gadotti et al. (2006) in borecole broccolis.
The objective of this work was to analyze the effect of the processing stages in the physical and physiological qualities of the seed and in Sclerotinia sclerotiorum incidence in seeds of eight soybean cultivars.
Material and Methods
In this study, the soybean seeds that were used were
produced in fields naturally infested by S. sclerotiorum, situated
in Vianópolis, Silvânia, Luziânia and Orizona, State of Goiás, Brazil, from two crops seasons: 2009/2010 with five cultivars (NA 7255 RR, A 7002, NS 7476, AN 8500 and BRS Valiosa RR); and 2010/2011 with six cultivars (NA 7255 RR, NA 7337 RR, NA 7620 RR, NA 8015 RR, AN 8500 and BRS Valiosa RR). In each flow stage in the Seed Processing Plant (SPP) a sample was collected (approximately 1.5 kg) of seeds (14 samples total), as follows: 1- in hopper (reception); 2- after pre-cleaning; 3- in discard one (from pre-cleaning); 4- after cleaning; 5 to 7- after sieve classifiers (three sizes of sieves); 8 to 10 - after spiral (three sizes of sieves); 11 to 13- after gravity table (three sizes of sieves); and 14- in discard two (from stages after cleaning until seed processing ending). However, in the 2009/2010 crop season, seeds from cultivars NS 7476 and AN 8500 passed by only two sieve classifications and, in consequence, two classifications in spiral and two in gravity table.
The samples were homogenized, divided, and used as a working sample between 500 g to 515 g. The following analyses were performed (Brasil, 2009b): moisture content, physical purity (count and weighing of sclerotia),
germination and tetrazolium tests. For the detection of S.
sclerotiorum, two methods were used (Brasil, 2009a): 1- paper roll (four replications of 50 seeds) and 2- Neon or agar-bromophenol medium (eight replications of 25 seeds), with
some modification, using 75 mg.L-1 of bromophenol blue and
50 mg.L-1 of chloramphenicol (Napoleão et al., 2006a). The
bromophenol blue and the antibiotics were incorporated to the molten PDA medium (50 ºC) after autoclaving. The Petri dishes were incubated in the dark at 18 ºC for 7-12 days with readings performed from day three.
The study of relations between the processing stages and the analyzed parameters was conducted by examining the correlation of those variables with the ordination axes generated by the multivariate analysis technique PCA (Principal Component Analysis). The PCA was performed from a mathematical matrix, correlating stages of processing
(14) versus analyzed variables (8), by the statistical program
PAST (Hammer et al., 2001). The variables included in the matrix were: moisture content, physical purity, sclerotia mass, germination, viability, vigor, sclerotia incidence by the sanitary analysis of paper roll and neon. The following procedures were recommended by Ter Braak (1986) and Palmer (1993), before the analysis was made the standardization of those variable values to mean zero and variance equal to unity, to remove disparities in the units of measurement of the different variables, so that all the variables had the same weight in the analysis (Hammer et al., 2001). Analyses of PCA were made for each cultivar in separate, generating ordination diagrams.
Results and Discussion
Physical quality
From reception in SPP until the evaluation moment, the moisture of seeds reduced from 13.4% to 8.2% in the 2009/2010 crop season, and from 13.0% to 10.0% in the 2010/2011 crop season.
In both crop seasons, the physical purity varied from 17.23% to 100% with lower values in the samples from discarded one. Right after cleaning, it already had values over 99%; exception to cultivar AN 8500 (crop season 2009/2010), with 97.85% in sample 4 (Table 1). According to Brazilian law, the minimum standard of physical purity for the commercialization of soybean seeds of certified (C1 and C2), S1 and S2 categories is 99% (Brasil, 2005). It was noticed that, through seed processing, from the stages of pre-cleaning and cleaning (samples 2 and 4), it was possible to reach the minimum required standard, reaching 100% of physical purity in the final stage (after gravity table).
of the lots. Later, the association of classification equipment in sieves, spiral separator, and gravity table has standardized the seeds based on their physical characteristics. Nery et al. (2009)
concluded that the association of ASM with gravity table is efficient for separating the fodder radish seed lots into fractions with different physical qualities.
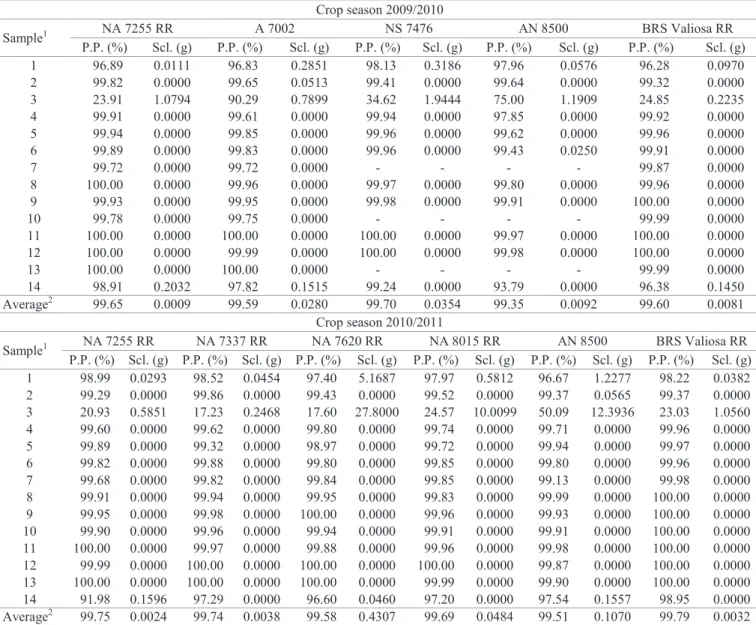
Table 1.Physical purity (P.P.) and sclerotia mass (Scl.) in soybean (Glycine max) seeds, crops seasons 2009/2010 and 2010/2011, as a function of seed processing.
Crop season 2009/2010
Sample1 NA 7255 RR A 7002 NS 7476 AN 8500 BRS Valiosa RR
P.P. (%) Scl. (g) P.P. (%) Scl. (g) P.P. (%) Scl. (g) P.P. (%) Scl. (g) P.P. (%) Scl. (g)
1 96.89 0.0111 96.83 0.2851 98.13 0.3186 97.96 0.0576 96.28 0.0970
2 99.82 0.0000 99.65 0.0513 99.41 0.0000 99.64 0.0000 99.32 0.0000
3 23.91 1.0794 90.29 0.7899 34.62 1.9444 75.00 1.1909 24.85 0.2235
4 99.91 0.0000 99.61 0.0000 99.94 0.0000 97.85 0.0000 99.92 0.0000
5 99.94 0.0000 99.85 0.0000 99.96 0.0000 99.62 0.0000 99.96 0.0000
6 99.89 0.0000 99.83 0.0000 99.96 0.0000 99.43 0.0250 99.91 0.0000
7 99.72 0.0000 99.72 0.0000 - - - - 99.87 0.0000
8 100.00 0.0000 99.96 0.0000 99.97 0.0000 99.80 0.0000 99.96 0.0000
9 99.93 0.0000 99.95 0.0000 99.98 0.0000 99.91 0.0000 100.00 0.0000
10 99.78 0.0000 99.75 0.0000 - - - - 99.99 0.0000
11 100.00 0.0000 100.00 0.0000 100.00 0.0000 99.97 0.0000 100.00 0.0000
12 100.00 0.0000 99.99 0.0000 100.00 0.0000 99.98 0.0000 100.00 0.0000
13 100.00 0.0000 100.00 0.0000 - - - - 99.99 0.0000
14 98.91 0.2032 97.82 0.1515 99.24 0.0000 93.79 0.0000 96.38 0.1450
Average2 99.65 0.0009 99.59 0.0280 99.70 0.0354 99.35 0.0092 99.60 0.0081 Crop season 2010/2011
Sample1 NA 7255 RR NA 7337 RR NA 7620 RR NA 8015 RR AN 8500 BRS Valiosa RR
P.P. (%) Scl. (g) P.P. (%) Scl. (g) P.P. (%) Scl. (g) P.P. (%) Scl. (g) P.P. (%) Scl. (g) P.P. (%) Scl. (g)
1 98.99 0.0293 98.52 0.0454 97.40 5.1687 97.97 0.5812 96.67 1.2277 98.22 0.0382 2 99.29 0.0000 99.86 0.0000 99.43 0.0000 99.52 0.0000 99.37 0.0565 99.37 0.0000 3 20.93 0.5851 17.23 0.2468 17.60 27.8000 24.57 10.0099 50.09 12.3936 23.03 1.0560
4 99.60 0.0000 99.62 0.0000 99.80 0.0000 99.74 0.0000 99.71 0.0000 99.96 0.0000
5 99.89 0.0000 99.32 0.0000 98.97 0.0000 99.72 0.0000 99.94 0.0000 99.97 0.0000 6 99.82 0.0000 99.88 0.0000 99.80 0.0000 99.85 0.0000 99.80 0.0000 99.96 0.0000
7 99.68 0.0000 99.82 0.0000 99.84 0.0000 99.85 0.0000 99.13 0.0000 99.98 0.0000 8 99.91 0.0000 99.94 0.0000 99.95 0.0000 99.83 0.0000 99.99 0.0000 100.00 0.0000
9 99.95 0.0000 99.98 0.0000 100.00 0.0000 99.96 0.0000 99.93 0.0000 100.00 0.0000
10 99.90 0.0000 99.96 0.0000 99.94 0.0000 99.91 0.0000 99.91 0.0000 100.00 0.0000 11 100.00 0.0000 99.97 0.0000 99.88 0.0000 99.96 0.0000 99.98 0.0000 100.00 0.0000 12 99.99 0.0000 100.00 0.0000 100.00 0.0000 100.00 0.0000 99.87 0.0000 100.00 0.0000 13 100.00 0.0000 100.00 0.0000 100.00 0.0000 99.99 0.0000 99.90 0.0000 100.00 0.0000
14 91.98 0.1596 97.29 0.0000 96.60 0.0460 97.20 0.0000 97.54 0.1557 98.95 0.0000 Average2 99.75 0.0024 99.74 0.0038 99.58 0.4307 99.69 0.0484 99.51 0.1070 99.79 0.0032 11-hopper; 2-after pre-cleaning; 3-discard one; 4-after cleaning; 5 to 7-after sieve classifiers; 8 to 10-after spiral separator; 11 to 13-after gravity table; 14- discard two; 2 not considering the samples from discard (3 and 14).
The presence of sclerotia was observed during the first stage of seed processing (hopper) and in samples from the discard one stage in all cultivars, and in discard two for 54.4% of them, in both crop seasons. The higher amount of sclerotia in discard one demonstrates the importance of pre-cleaning. It was found between two to 201 sclerotia (0.1110 g to 1.9444 g), and between one to more than 3,000 sclerotia (0.0293 g to 27.800 g) by sample, in the 2009/2010 and 2010/2011 crop seasons, respectively. After pre-cleaning, associated to cleaning, no sclerotia were found, with
in Diamante Negro, because this is an erect bearing variety whose pods rarely touch the ground and it does not differ from plants, and the sclerotia are taken together with the pods for processing. If white mold in soybean is considered a predominantly monocyclic disease, that is, only the initial inoculum is responsible for the amount of disease (Vanderplank, 1963), proper seed processing may represent an important step to reduce this inoculum and, in consequence, the disease incidence in the field.
Physiological quality
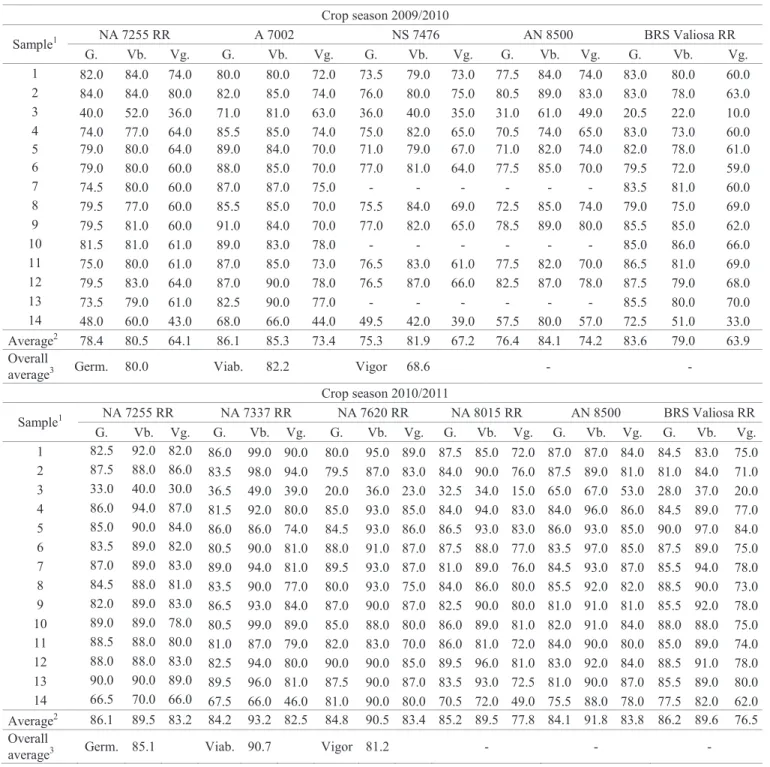
Considering the seed processing stages, except discards (samples 3 and 14), during the 2009/2010 crop season, the seeds had lower germination, viability and vigor than during the 2010/2011 crop season (Table 2). However, the average values of germination are acceptable, according to Brazilian seed law (2003), where the minimum standard for the commercialization of soybeans from the certified, S1, and S2 categories is 80% (Brasil, 2005). Overall, among the processing stages and among the cultivars, the germination percentages were lower than the viability ones according to the tetrazolium test, probably due to the presence of fungi, such as Phomopsis spp. and Fusarium semitectum. According to França-Neto et al. (1998) differences are acceptable to 5% between the viability test by the tetrazolium and germination test.
An opposite behavior was observed in cultivars A 7002 and BRS Valiosa RR (crop season 2009/2010), the germination percentages were higher than those of viability by the tetrazolium test. In both cultivars there was an increase of the vigor percentage with processing, which was not observed in other cultivars, in both crop seasons (Table 2).
The physical properties may be related to the viability and vigor of seeds, as verified by Pádua et al. (2010) in soybean seeds, and by Perin et al. (2002) in bean seeds, reported that small seeds reduced the stand of cultivar Carioca. Differently, Costa et al. (2004) concluded that the physiological quality is not affected by the size of soybean seeds. In this work, larger seeds had germination and vigor superior to smaller ones and in some cultivars and after some processing stages: AN 8500 (spiral separator and gravity table) and NS 7476 (gravity table) during the crop season 2009/2010; NA 7255 RR and NA 7337 RR (gravity table), NA 7620 RR, AN 8500 and BRS Valiosa RR (gravity table only for variable vigor) in the crop season 2010/2011 (Table 2). For most of the cultivars, seeds with higher density had more vigor after the gravity table stage.
Giomo et al. (2004) related that it is important to remove less dense seeds from the lot, because their small amount of reserve substances may lead to a slow growth of seedlings. The exclusive use of ASM did not improve the lot of seeds quality, but
associated to gravity table, there was efficiency in the separation and distribution of superior quality portions in Vigna unguiculata
(Mertz et al., 2007) and in coffee (Giomo et al., 2008).
The results of the tetrazolium test (level 1-8), notes that the damage caused to the seeds were higher in the 2009/2010 crop season (average of 22.3%) compared to 2010/2011 (average of 17.2%), especially those damaged by stinkbugs in both crop seasons, being, on average, 22.0%, followed by mechanical (20.2%) and by moisture (17.1%). Among the cultivars, the values of damage varied from 10.0% to 32.0% (mechanical), from 9.8% to 37.0% (stinkbugs) and from 3.5% to 32.0% (by moisture).
Sclerotinia sclerotiorum incidence
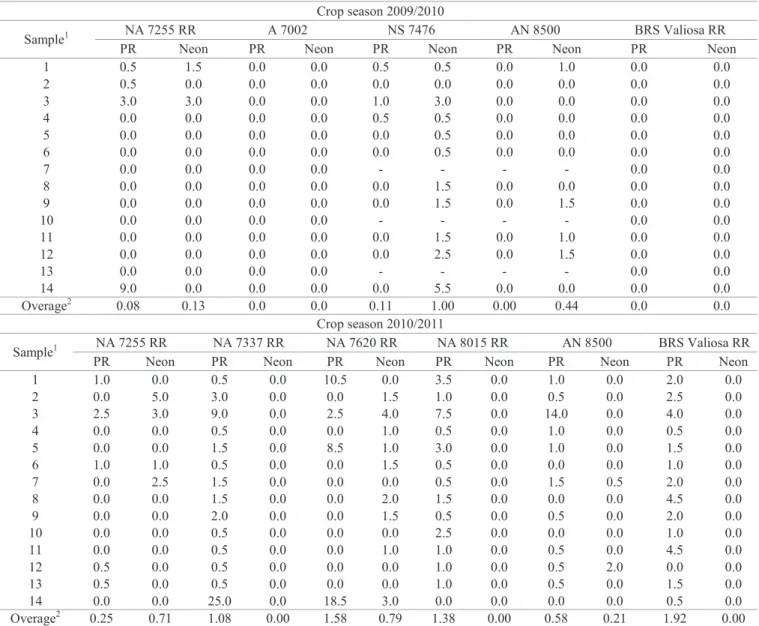
The incidence of S. sclerotiorum in seeds was not detected in cultivars A 7002 and BRS Valiosa RR (crop season 2009/2010) by any of the methods. There was also a difference between the method results with regard to the evaluation of fungus incidence. In the 2009/2010 crop season, for the same cultivar, a greater incidence of fungus was found by neon; the opposite happened during the 2010/2011 crop season, when the larger incidence was obtained by paper roll, with the exception of cultivar NA 7255 RR. In additon, there were situations where the incidence was detected only by paper roll (NA 7337 RR, NA 8015 RR and BRS Valiosa RR – crop season 2010/2011) and by neon only (AN 8500 – crop season 2009/2010) (Table 3).
The neon method is quicker, but the execution is more laborious and costly. The paper roll has a longer incubation period, but a lower cost and simpler execution. However, it may also overestimate the fungus incidence because of cross contamination among seeds. The higher incidences of fungus were obtained in samples from discard (3 and 14), followed by the one from hopper (sample 1). Regardless of the processing stage, the cultivars had different percentages of infection among themselves, varying from 0.0% to 9.0% (crop season 2009/2010) and from 0.0% to 25.0% - samples from discard (crop season 2010/2011), by the paper roll method; as for neon, this percentage varied from 0.0% to 5.5% and from 0.0% to 5.0%, respectively (Table 3). This difference between cultivars may be due to factors related to the different production fields, chemical control, if used, as well as the efficiency of the fungicides applied, field localization and planting density (stand).
not only for sclerotia quantification by purity analysis, whose standard of tolerance is zero, but also for the sensitivity of
the seed health test to detect the presence of the pathogen as dormant mycelium in the seeds.
Table 2.Germination percentage (G.), viability (Vb.) and vigor (Vg.) of soybean (Glycine max), crops seasons 2009/2010 and 2010/2011, on seed-processing stages.
Crop season 2009/2010
Sample1 NA 7255 RR A 7002 NS 7476 AN 8500 BRS Valiosa RR
G. Vb. Vg. G. Vb. Vg. G. Vb. Vg. G. Vb. Vg. G. Vb. Vg.
1 82.0 84.0 74.0 80.0 80.0 72.0 73.5 79.0 73.0 77.5 84.0 74.0 83.0 80.0 60.0
2 84.0 84.0 80.0 82.0 85.0 74.0 76.0 80.0 75.0 80.5 89.0 83.0 83.0 78.0 63.0
3 40.0 52.0 36.0 71.0 81.0 63.0 36.0 40.0 35.0 31.0 61.0 49.0 20.5 22.0 10.0
4 74.0 77.0 64.0 85.5 85.0 74.0 75.0 82.0 65.0 70.5 74.0 65.0 83.0 73.0 60.0
5 79.0 80.0 64.0 89.0 84.0 70.0 71.0 79.0 67.0 71.0 82.0 74.0 82.0 78.0 61.0
6 79.0 80.0 60.0 88.0 85.0 70.0 77.0 81.0 64.0 77.5 85.0 70.0 79.5 72.0 59.0
7 74.5 80.0 60.0 87.0 87.0 75.0 - - - 83.5 81.0 60.0
8 79.5 77.0 60.0 85.5 85.0 70.0 75.5 84.0 69.0 72.5 85.0 74.0 79.0 75.0 69.0
9 79.5 81.0 60.0 91.0 84.0 70.0 77.0 82.0 65.0 78.5 89.0 80.0 85.5 85.0 62.0
10 81.5 81.0 61.0 89.0 83.0 78.0 - - - 85.0 86.0 66.0
11 75.0 80.0 61.0 87.0 85.0 73.0 76.5 83.0 61.0 77.5 82.0 70.0 86.5 81.0 69.0
12 79.5 83.0 64.0 87.0 90.0 78.0 76.5 87.0 66.0 82.5 87.0 78.0 87.5 79.0 68.0
13 73.5 79.0 61.0 82.5 90.0 77.0 - - - 85.5 80.0 70.0
14 48.0 60.0 43.0 68.0 66.0 44.0 49.5 42.0 39.0 57.5 80.0 57.0 72.5 51.0 33.0
Average2 78.4 80.5 64.1 86.1 85.3 73.4 75.3 81.9 67.2 76.4 84.1 74.2 83.6 79.0 63.9
Overall
average3 Germ. 80.0 Viab. 82.2 Vigor 68.6 - -
Crop season 2010/2011
Sample1 NA 7255 RR NA 7337 RR NA 7620 RR NA 8015 RR AN 8500 BRS Valiosa RR
G. Vb. Vg. G. Vb. Vg. G. Vb. Vg. G. Vb. Vg. G. Vb. Vg. G. Vb. Vg. 1 82.5 92.0 82.0 86.0 99.0 90.0 80.0 95.0 89.0 87.5 85.0 72.0 87.0 87.0 84.0 84.5 83.0 75.0 2 87.5 88.0 86.0 83.5 98.0 94.0 79.5 87.0 83.0 84.0 90.0 76.0 87.5 89.0 81.0 81.0 84.0 71.0 3 33.0 40.0 30.0 36.5 49.0 39.0 20.0 36.0 23.0 32.5 34.0 15.0 65.0 67.0 53.0 28.0 37.0 20.0
4 86.0 94.0 87.0 81.5 92.0 80.0 85.0 93.0 85.0 84.0 94.0 83.0 84.0 96.0 86.0 84.5 89.0 77.0
5 85.0 90.0 84.0 86.0 86.0 74.0 84.5 93.0 86.0 86.5 93.0 83.0 86.0 93.0 85.0 90.0 97.0 84.0 6 83.5 89.0 82.0 80.5 90.0 81.0 88.0 91.0 87.0 87.5 88.0 77.0 83.5 97.0 85.0 87.5 89.0 75.0
7 87.0 89.0 83.0 89.0 94.0 81.0 89.5 93.0 87.0 81.0 89.0 76.0 84.5 93.0 87.0 85.5 94.0 78.0 8 84.5 88.0 81.0 83.5 90.0 77.0 80.0 93.0 75.0 84.0 86.0 80.0 85.5 92.0 82.0 88.5 90.0 73.0 9 82.0 89.0 83.0 86.5 93.0 84.0 87.0 90.0 87.0 82.5 90.0 80.0 81.0 91.0 81.0 85.5 92.0 78.0 10 89.0 89.0 78.0 80.5 99.0 89.0 85.0 88.0 80.0 86.0 89.0 81.0 82.0 91.0 84.0 88.0 88.0 75.0 11 88.5 88.0 80.0 81.0 87.0 79.0 82.0 83.0 70.0 86.0 81.0 72.0 84.0 90.0 80.0 85.0 89.0 74.0 12 88.0 88.0 83.0 82.5 94.0 80.0 90.0 90.0 85.0 89.5 96.0 81.0 83.0 92.0 84.0 88.5 91.0 78.0 13 90.0 90.0 89.0 89.5 96.0 81.0 87.5 90.0 87.0 83.5 93.0 72.5 81.0 90.0 87.0 85.5 89.0 80.0
14 66.5 70.0 66.0 67.5 66.0 46.0 81.0 90.0 80.0 70.5 72.0 49.0 75.5 88.0 78.0 77.5 82.0 62.0 Average2 86.1 89.5 83.2 84.2 93.2 82.5 84.8 90.5 83.4 85.2 89.5 77.8 84.1 91.8 83.8 86.2 89.6 76.5 Overall
average3 Germ. 85.1 Viab. 90.7 Vigor 81.2 - - -
Table 3.Incidence (%) of Sclerotinia sclerotiorum, detected by seed health tests in the paper roll (PR) and neon method (Neon), in soybean (Glycine max) seeds, crop seasons 2009/2010 and 2010/2011, on the seed-processing stages.
Crop season 2009/2010
Sample1 NA 7255 RR A 7002 NS 7476 AN 8500 BRS Valiosa RR
PR Neon PR Neon PR Neon PR Neon PR Neon
1 0.5 1.5 0.0 0.0 0.5 0.5 0.0 1.0 0.0 0.0
2 0.5 0.0 0.0 0.0 0.0 0.0 0.0 0.0 0.0 0.0
3 3.0 3.0 0.0 0.0 1.0 3.0 0.0 0.0 0.0 0.0
4 0.0 0.0 0.0 0.0 0.5 0.5 0.0 0.0 0.0 0.0
5 0.0 0.0 0.0 0.0 0.0 0.5 0.0 0.0 0.0 0.0
6 0.0 0.0 0.0 0.0 0.0 0.5 0.0 0.0 0.0 0.0
7 0.0 0.0 0.0 0.0 - - - - 0.0 0.0
8 0.0 0.0 0.0 0.0 0.0 1.5 0.0 0.0 0.0 0.0
9 0.0 0.0 0.0 0.0 0.0 1.5 0.0 1.5 0.0 0.0
10 0.0 0.0 0.0 0.0 - - - - 0.0 0.0
11 0.0 0.0 0.0 0.0 0.0 1.5 0.0 1.0 0.0 0.0
12 0.0 0.0 0.0 0.0 0.0 2.5 0.0 1.5 0.0 0.0
13 0.0 0.0 0.0 0.0 - - - - 0.0 0.0
14 9.0 0.0 0.0 0.0 0.0 5.5 0.0 0.0 0.0 0.0
Overage2 0.08 0.13 0.0 0.0 0.11 1.00 0.00 0.44 0.0 0.0
Crop season 2010/2011
Sample1 NA 7255 RR NA 7337 RR NA 7620 RR NA 8015 RR AN 8500 BRS Valiosa RR
PR Neon PR Neon PR Neon PR Neon PR Neon PR Neon
1 1.0 0.0 0.5 0.0 10.5 0.0 3.5 0.0 1.0 0.0 2.0 0.0
2 0.0 5.0 3.0 0.0 0.0 1.5 1.0 0.0 0.5 0.0 2.5 0.0
3 2.5 3.0 9.0 0.0 2.5 4.0 7.5 0.0 14.0 0.0 4.0 0.0
4 0.0 0.0 0.5 0.0 0.0 1.0 0.5 0.0 1.0 0.0 0.5 0.0
5 0.0 0.0 1.5 0.0 8.5 1.0 3.0 0.0 1.0 0.0 1.5 0.0
6 1.0 1.0 0.5 0.0 0.0 1.5 0.5 0.0 0.0 0.0 1.0 0.0
7 0.0 2.5 1.5 0.0 0.0 0.0 0.5 0.0 1.5 0.5 2.0 0.0
8 0.0 0.0 1.5 0.0 0.0 2.0 1.5 0.0 0.0 0.0 4.5 0.0
9 0.0 0.0 2.0 0.0 0.0 1.5 0.5 0.0 0.5 0.0 2.0 0.0
10 0.0 0.0 0.5 0.0 0.0 0.0 2.5 0.0 0.0 0.0 1.0 0.0
11 0.0 0.0 0.5 0.0 0.0 1.0 1.0 0.0 0.5 0.0 4.5 0.0
12 0.5 0.0 0.5 0.0 0.0 0.0 1.0 0.0 0.5 2.0 0.0 0.0
13 0.5 0.0 0.5 0.0 0.0 0.0 1.0 0.0 0.5 0.0 1.5 0.0
14 0.0 0.0 25.0 0.0 18.5 3.0 0.0 0.0 0.0 0.0 0.5 0.0
Overage2 0.25 0.71 1.08 0.00 1.58 0.79 1.38 0.00 0.58 0.21 1.92 0.00
11-hopper; 2-after pre-cleaning; 3-discard one; 4-after cleaning; 5 to 7-after sieve classifiers; 8 to 10-after spiral separator; 11 to 13-after gravity table; 14- discard two; 2 not considering the samples from discard (3 and 14).
Principal Components Analysis (PCA)
In relation to variable behavior as a function of processing stages, the discard samples (3 and 14) had lower values of physical purity, germination, viability and vigor, and larger masses of sclerotia. The physical purity increased from stage 1 to 2, remaining practically constant from the cleaning stage (4) until the end of processing. The values of germination, viability and vigor increased, with small changes during the processing line (Tables 1 and 2).
In both crop seasons, the percentage of variance accumulated in the first two PC was superior to 80%. According to PCA cultivars, the pre-cleaning procedure was efficient in
the removal of sclerotia, together with the other processing stages. In addition, after the classification stages, the samples made a homogeneous group with a high correlation with the physical and physiological quality of seeds (Figures 1 and 2).
9, 11 and 12 correlated with the neon method due to the fact that fungus incidence was detected in those samples by this method. In the same way as in cultivar A 7002, in BRS Valiosa RR the fungus was not detected by those seed heath tests and, therefore, they were not included in the PCA
analysis (Figure 1). In crop season 2010/2011, sample 3 correlated more with paper roll (NA 8015 RR, BRS Valiosa RR and AN 8500), while in cultivars NA 7337 RR and NA 7620 RR, it was sample 14 that correlated more with this method (Figure 2).
Mo PP Scl G Vb Vb VbVg PR N 1 2 3 4 5 6
78 11 9 10
12 13
14
-8 -7 -6 -5 -4 -3 -2 -1 1
Component 1 -4 -3.2 3. -2.2.4 -1.6 -0.8 0.8 0. 1.6 Mo 1. 1. 2.4 C o m p on ent 2 Mo PP Scl G VbVg 1 2 3
456 7 8 9 10 11 Vg 12 13 14
-4.8 -4 -3.2 -2.4 -1.6 -0.8 0.8 1.6
Component 1 -3 -2.2.4 -1.81. -1.21. -0.6 0.6 0. 1.2 1. 1.8 1. 2.4 C om p on ent 2 B Mo PP Mo Scl G Vb Vb Vb Vg Scl Scl PR N 1 2 3 4
5 6 8 9 11 PP PP 12 14
-7 -6 -5 -4 -3 -2 -1 1
Component 1 -3.6 3.
-3 -2.2.4 -1.8 1. -1.2 1. -0.6 0.6 0. 0. 1.2 C om p on ent 2 Mo PP Scl G Vb Vg N
1 2
3
4 5
6 VbVb Vg Vg 8 9 11 12 14
-7 -6 -5 -4 -3 -2
Scl
-1 1 2
Component 1 -2 -1.6 -1.2 1. -0.8 0. -0.4 0.4 0.8 0. 0. 1.2 1. 1.6 C om p on ent 2 Mo PP
Scl G
Vb PP PP PP PP PP PP PPVg 1 2 3 45 6 7 8 9 11 10
12
Vb Vb
13
14
-8 -7 -6 -5 -4 -3 -2 -1 1
Component 1
-2 -1.6 1. -1.2 1. -0.8 0. -0.4 0.4 0. 0.8 0. 0. 1.2 1. 1. 1.6 C om p on ent 2 A C D Scl: sclerotia G: germination N: test in neon medium PP: physical purity PR: test in paper roll Mo: moisture Vb: viability Vg: vigor
1: hopper 8: spiral 2: pre-cleaning 9: spiral 3: discard 1 10: spiral 4: cleaning 11: gravity table 5: sieve classifier 12: gravity table 6: sieve classifier 13: gravity table 7: sieve classifier 14: discard 2
E
Figure 1. Ordination diagram by Principal Components Analysis (PCA) with stages of processing of soybean seeds from cultivars NA 7255 RR (A), A 7002 (B), NS 7476 (C), AN 8500 (D) and BRS Valiosa RR (E), crop season 2009/2010, and variables of physical and physiological qualities and Sclerotinia sclerotiorum incidence.
Component 1
Component 2
Component 1
Component 1 Component 1
Component 1
Component 2
Component 2
Component 2
Component 2
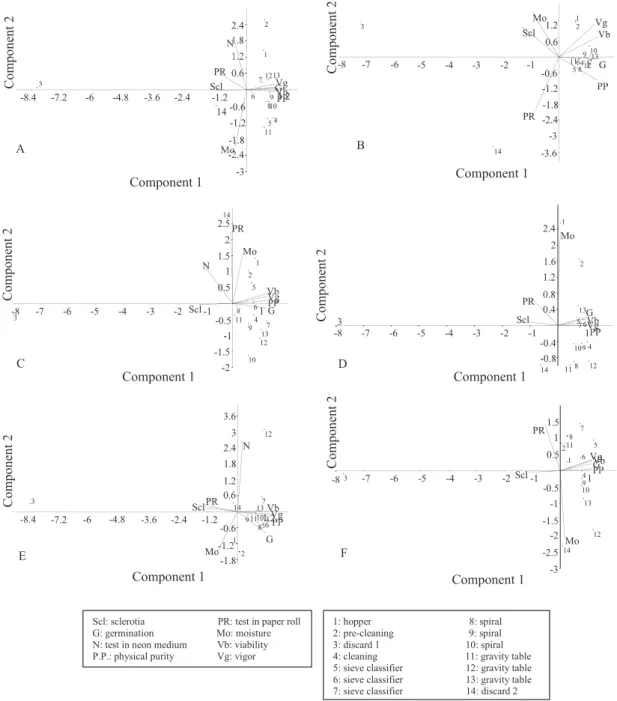
With these analyses, for the two crop seasons, it was observed that most of the processing stages, for each cultivar, had a high correlation with those variables (Figures 1 and 2). The values of physical purity, germination, viability and vigor correlated positively between themselves and negatively with sclerotia mass, that is, the larger the sclerotia mass combined with seeds, the lower the values of those variables were.
Furthermore, a larger sclerotia mass does not necessarily correspond to a larger incidence of white mold in seeds because in some cultivars (A 7002, AN 8500 and BRS Valiosa RR), even having sclerotia in seed samples, there was no detection of fungus by the two methods.
sclerotiorum detection and, consequently, the applicability in routine analysis.
The sample 3 correlated with the sclerotia mass in all cultivars of the 2010/2011 crop season (Figure 2) and in A 7002, NS 7476, AN 8500 and BRS Valiosa RR (Figure 1) from the 2009/2010 crop season; the same happened with sample 14 in cultivars A 7002 and BRS Valiosa RR (crop
season 2009/2010) and NA 7255 RR (crop season 2010/2011). Moreover, there was a negative correlation of S. sclerotiorum
incidence detected by the paper roll method with physical purity, germination, viability and vigor for four cultivars (NA 7255 RR, NA 7337 RR, NA 8015 RR and AN 8500), and a positive correlation of those methods with sclerotia mass, except in cultivar NA 7337 RR.
Mo
PP Scl G Vb PP Vb Vb Vb PP Vb PP Vb Vb Vb Vb Vg Scl Scl PR N 1 2 3 4 5 6 7 8 9 10 11 12 Vb Vg Vg Vg Vg Vb Vg Vb Vb Vb Vb Vb 13 14 -8.4 -7.2 -6 -4.8 -3.6 -2.4
14
-1.2 VbVbVbVbVbVbVbVbVbVbPPPPPPPPPPPP1.2
Component 1 -3 Mo-2.4 Mo Mo2.2. Mo2. Mo
-1.8 1.1. -1.2 1.1. -0.6 0.6 0. 1.2 1. 1. 1. 1.8 2.4 C om p on ent 2 Mo PP Scl PP G Vb Vb Vg PR 1 2 3 4 56 8 7
9 10 11 12 13
14
-8 -7 -6 -5 -4 -3 -2 -1 1
Component 1 -3.6 -3 -2.4 -1.8 -1.2 -0.6 0.6 Mo 1.2 C om p on ent 2 Mo PP
Scl G
Vb PP PP PP Vb Vb Vg Mo PR
N 1
2
3 4
5 6 7 8 9 10 11 12 13 14
-8 -7 -6 -5 -4 -3 -2 -1 1
Component 1 -2 -1.5 -1 -0.5 0.5 1 1.5 2 2.5 C om p on ent 2 Mo PP Scl G Vb PP PP Vb Vb PP PP Vb Vb Vg Scl PR Mo 1 2 3 4 576 VbVgVbVgVbVgVg
8 9 10 11 12
13
14
-8 -7 -6 -5 -4 -3 -2 -1 1 VgVg
Component 1 -0.8 -0.4 0.4 0.8 1.2 1.6 2 2.4 C om p on ent 2 Mo PP Scl G Vb PP PP Vb PP PP Vb Vg PR N 1 2 3 4 5 6
7
8 9 10 11 12
13
14
-8.4 -7.2 -6 -4.8 -3.6 -2.4 -1.2 1.2 VgVgVgPPPPPP
Component 1 -1.8 Mo Mo-1.2 -0.6 0.6 1.2 1.8 2.4 3 3.6 C o m p on ent 2 Mo PP Scl G PP Vb PP PP PP PP PP PP Vb Vb Vb Vb Vb Vb Vb Vb Vb Vb Vb Vg PR 1 2
3 4
Vb Vg VgVb VgVbVb VgVbVb VgVb 5 6 7 8 9 10 11 12 13 14
-8 -7 -6 -5 -4 -3 -2 -1 1
Component 1 -3 -2.5 -2 -1.5 -1 -0.5 0.5 1 1.5 C om p on ent 2
A B
C D
E F
Scl: sclerotia PR: test in paper roll G: germination Mo: moisture N: test in neon medium Vb: viability P.P.: physical purity Vg: vigor
1: hopper 8: spiral 2: pre-cleaning 9: spiral 3: discard 1 10: spiral 4: cleaning 11: gravity table 5: sieve classifier 12: gravity table 6: sieve classifier 13: gravity table 7: sieve classifier 14: discard 2
Figure 2. Ordination diagram by Principal Components Analysis (PCA) with the stages of processing of soybean seeds from cultivars NA 7255 RR (A), NA 7337 RR (B), NA 7620 RR (C), NA 8015 RR (D), AN 8500 (E) and BRS Valiosa RR (F), crop season 2010/2011, and variables of the physical and physiological qualities and Sclerotinia sclerotiorum incidence.
Component 2 Component 2 Component 2 Component 2 Component 2 Component 2
Component 1 Component 1
Component 1 Component 1
It is perceived that the response of each cultivar to post-harvest handling is distinct, needing to be studied not only for its effects, but also its causes under different approaches. This will allow for the identification of the type, intensity and moment of an action that is able to affect the seed quality, mainly the sanitary quality.
In 2009/2010, the pathogen was not detected in the soybean seeds of cultivar BRS Valiosa RR by any of the sanity methods used; contrary to what was observed in the 2010/2011 crop season, when it was detected by paper roll. The cultivar NA 7255 RR had a larger infection percentage, considering the two methods used in 2010/2011, and AN 8500 had no infected seeds in 2009/2010 by paper roll, occurring on the next crop.
Napoleão et al. (2006b) also observed differences working with bean cultivars in different cropping seasons. The cultivar Diamante Negro had infected seeds in the first evaluated year, in the second year this happened only to cultivar Pérola. The author presumes that seed infection happens randomly. However, in this work, other factors may also be influencing fungus detection, since the cultivars are submitted to different field conditions (uncontrolled conditions) that strongly influence the seeds infection, mainly climatic conditions.
In fact, it was observed that, on both crops and in different cultivars, processing may be a useful tool to control this pathogen, since it can reduce or eliminate the sclerotia associated with them. With that, the processing may help to reduce the amount of inoculum that might be introduced in planting areas.
Conclusions
The processing of soybean seeds improves the lot quality in terms of physical purity, germination, viability and vigor, in addition to eliminating the sclerotia of S. sclerotiorum.
The pre-cleaning and cleaning stages, performed by the air-screen machines, significantly reduce the amount of sclerotia from soybean seeds.
The amount of sclerotia in the sample is not necessarily correlated to S. sclerotiorum incidence in mycelial form in seeds.
Not all of the seeds with seedborne S. sclerotiorum, incidence in dormant internal mycelial form are discarded by processing. Seeds with incipient infections may not be eliminated during seed processing and consequently they could be taken to the new field.
References
BOLTON, M.D.; THOMMA, B.P.H.J.; NELSON, B.D. Sclerotinia sclerotiorum (Lib.) de Bary: biology and molecular traits of a cosmopolitan pathogen. Molecular Plant Pathology, v.7, n.1, p. 1-16, 2006. http://library.
wur.nl/WebQuery/wurpubs/346021
BRASIL. Ministério da Agricultura, Pecuária e Abastecimento. Instrução Normativa nº 25 de 16 de dezembro de 2005. Diário Oficial da União:
Brasília, seção 1, p.18-26, 20 de dezembro de 2005.
BRASIL. Ministério da Agricultura, Pecuária e Abastecimento. Manual de análise sanitária de sementes. Ministério da Agricultura, Pecuária e Abastecimento.
Secretaria de Defesa Agropecuária. Brasília: MAPA/ACS, 2009a. 200p. http:// www.agricultura.gov.br/arq_editor/file/12261_sementes_-web.pdf.
BRASIL. Ministério da Agricultura, Pecuária e Abastecimento. Regras para análise de sementes. Ministério da Agricultura, Pecuária e Abastecimento.
Secretaria de Defesa Agropecuária. Brasília: MAPA/ACS, 2009b. 395p. http://www.agricultura.gov.br/arq_editor/file/laborat%c3%b3rio/sementes/ regras%20para%20analise%20de%20sementes.pdf
CONAB. Companhia Nacional de Abastecimento. Acompanhamento de safra brasileira: grãos, décimo segundo levantamento, Brasília: Conab,
2012. 30p. Accessed on: Sep. 17th 2012.
COSTA, P.; CUSTÓDIO, C.C.; MACHADO NETO, N.B.; MARUBAYASHI,
O.M. Estresse hídrico induzido por manitol em sementes de soja de diferentes
tamanhos. Revista Brasileira de Sementes, v.26, n.2, p. 105-113, 2004. http://
www.scielo.br/pdf/rbs/v26n2/24496.pdf
FESSEL, S.A.; SADER, R.; PAULA, R.C.; GALLI, J.A. Avaliação da qualidade
física, fisiológica e sanitária de sementes de milho durante o beneficiamento.
Revista Brasileira de Sementes, v.25, n. 2, p.70-76, 2003. http://www.scielo.br/
scielo.php?pid=S010131222003000400010&script= sci_arttext
FRANÇA-NETO, J.B.; KRZYZANOWSKI, F.C.; COSTA, N.P.D. O teste de tetrazólio em sementes de soja. Londrina: Embrapa-CNPSo, 1998. 72p. (Embrapa-CNPSo. Documentos, 116).
GADOTTI, G.I.; CORRÊA, C.L.; LUCCA FILHO, O.; VILLELA, F.A.
Qualidade de sementes de couve brócolis beneficiadas em mesa densimétrica.
Revista Brasileira de Sementes, v.28, n.2, p.123-127, 2006. http://
www.scielo.br/scielo.php?script=sci_arttext&pid=S0101-31222006000 200016&lng=pt&nrm=iso&tlng=pt
GIOMO, G.S.; NAKAGAWA, J.; GALLO, P.B. Beneficiamento de sementes de café e efeitos na qualidade fisiológica. Bragantia, v.67, n.4, p.1011-1020,
2008. http://www.scielo.br/pdf/brag /v67n4/25.pdf.
GIOMO, G.S.; RAZERA, L.F.; GALLO, P.B. Beneficiamento e qualidade de sementes de café arábica. Bragantia, v.63, n.2, p.291-297, 2004. http://www.
scielo.br/scielo.php?script=sci_ arttext&pid=S0006-87052004000200014
HAMMER, O.; HARPER, D.A.T.; RYAN, P.D. PAST: Paleontological Statistics Software Package for Education and Data Analysis. Palaeontologia Electronica,
v.4, n.1, p.9, 2001. http://palaeo-electronica.org/2001_1/past/past.pdf
MERTZ, L.M.; HENNING, F.A.; MAIA, M.S.; MENEGHELLO, G.E.;
HENRIQUES, A.; MADAIL, R. Qualidade fisiológica e sanitária de sementes de feijão-miúdo beneficiadas em mesa gravitacional. Revista Brasileira de Sementes, v.29, n.3, p.1-8, 2007. http://www.scielo.br/scielo .php?script=sci_
NAPOLEÃO, R.; NASSER, L.C. B.; LOPES, C.A.; CAFÉ FILHO, A.C. Neon-S, um novo meio de detecção de Sclerotinia sclerotiorum em sementes. Summa Phytopathologica, v.32, n.2, p. 180-182, 2006a. http://www.scielo.br/
scielo.php?script=sci_arttext&pid=S0100-54052006000200014
NAPOLEAO, R.; CAFE FILHO, A.C.; LOPES, C.A.; NASSER, L.C.B. Efeito do espaçamento e da cultivar de feijoeiro sobre a intensidade do mofo-branco e a sanidade de sementes. Summa Phytopathologica, v.32, n.1, p.63-66, 2006b. http://
www.scielo.br/scielo.php?pid=S0100-54052006000100009&script=sci_arttext
NERY, M.C.; CARVALHO, M.L.M.; OLIVEIRA, J.A.; KATAOKA,
V.Y. Beneficiamento de sementes de nabo forrageiro. Revista Brasileira de Sementes, v.31, n.4, p.36-42, 2009. http://www.scielo.br/scielo.
php?script=sci_arttext&pid=S010131222009000400004&lng=en&nrm=iso
PÁDUA, G.P.; ZITO, R.K.; ARANTES, N.E.; FRANÇA-NETO, J.B.
Influência do tamanho da semente na qualidade e na produtividade da cultura
da soja. Revista Brasileira de Sementes, v.32, n.3, p.09-16, 2010. http://www. scielo.br/pdf/rbs/v32n3/v32n3a01.pdf
PALMER, M.W. Putting things in even better order: the advantages of canonical correspondence analysis. Ecology, v.74, n.8, p.2215-2230, 1993.
http://www.jstor.org /stable/1939575
PERIN, A.; ARAÚJO, A. P.; TEIXEIRA, M. G. Efeito do tamanho da semente na acumulação de biomassa e nutrientes e na produtividade do feijoeiro. Pesquisa Agropecuária Brasileira, v.37, n.12, p.1711-1718, 2002.
http://www.scielo.br/pdf/pab/v37n12/14637.pdf
TER BRAAK, C.J.F. Cannonical correspondende analysis: a new eigen-vector technique for multivariate direct gradient analysis. Ecology, v.67,
n.5, p.1167-1179, 1986. http://www.jstor.org/discover/10.2307/1938672?ui
-d=3737664&uid=2129&uid=2&uid=70&uid=4&sid=21101336956843
TU, C. The role of mold-infected white bean (Phaseolus vulgaris L.) seeds in the dissemination of Sclerotinia sclerotiorum de Bary. Journal of Phytopathology, v.121, n.1, p.40-50, 1998. http://agris.fao.org/agrissearch/
search/display.do?f=1988%2FDE%2FDE88091.xml%3BDE88U014888
VANDERPLANK, J.E. Plant diseases: epidemics and control. New York: