Revista Brasileira de
Engenharia Agrícola e Ambiental
Campina Grande, PB, UAEA/UFCG – http://www.agriambi.com.br
v.20, n.4, p.343-349, 2016
Metrological assessment of TDR performance for measurement
of potassium concentration in soil solution
Isaac de M. Ponciano
1, Jarbas H. de Miranda
1, Richard A. Cooke
2,
Vanessa de F. Grah
3& Alisson J. P. da Silva
4DOI: http://dx.doi.org/10.1590/1807-1929/agriambi.v20n4p343-349
A B S T R A C T
Despite the growing use of the time domain reflectometry (TDR) technique to monitoring ions in the soil solution, there are few studies that provide insight into measurement error. To overcome this lack of information, a methodology, based on the central limit theorem error, was used to quantify the uncertainty associated with using the technique to estimate potassium ion concentration in two soil types. Mathematical models based on electrical conductivity and soil moisture derived from TDR readings were used to estimate potassium concentration, and the results were compared to potassium concentration determined by flame spectrophotometry. It was possible to correct for random and systematic errors associated with TDR readings, significantly increasing the accuracy of the potassium estimation methodology. However, a single TDR reading can lead to an error of up to
± 18.84 mg L-1 K+ in soil solution (0 to 3 dS m-1), with a 95.42% degree of confidence, for a
loamy sand soil; and an error of up to ± 12.50 mg L-1 of K+ (0 to 2.5 dS m-1) in soil solution,
with a 95.06% degree of confidence, for a sandy clay soil.
Desempenho metrológico de TDR para medição
da concentração de potássio na solução do solo
R E S U M O
Apesar da crescente utilização da técnica TDR para o monitoramento dos íons na solução do solo, são poucos os estudos que fornecem uma contribuição relevante sobre o erro instrumental do ponto de vista da métrica. Para superar esta limitação foi aplicada uma metodologia baseada no teorema central do erro a fim de quantificar a incerteza associada com a utilização da técnica na estimativa de íons de potássio para dois tipos de solo; utilizaram-se, então, modelos matemáticos para estimar o íon potássio na solução dos solos a partir da condutividade elétrica aparente e umidade do solo fornecida por leituras da técnica da TDR cujos resultados foram comparados com a concentração de potássio determinada por espectrofotometria de chama. Os resultados demonstraram que o erro aleatório e o sistemático podem ser identificados pela métrica e que leituras médias da TDR aumentam significativamente a precisão da metodologia de determinação de potássio porém leituras
aleatórias podem levar a um erro de ± 18,84 mg L-1 de K+ na solução do solo (0-3 dS m-1)
com 95,42% de confiança para um solo areia-franca, além de um erro de ± 12,50 mg L-1 de
K+ (0-2,5 dS m-1) em solução de solo com 95,06% de confiança para um solo argilo-arenoso.
Key words:
central limit theorem instrumentation electrical conductivity
Palavras-chave:
teorema do limite central instrumentação
condutividade elétrica
1 Universidade de São Paulo/Escola de Agricultura “Luiz de Queiroz”/Departamento de Engenharia de Biosistemas. Piracicaba, SP. E-mail:
isaacponciano@usp.br (Corresponding author); jhmirand@usp.br
2 University of Illinois/Department of Agricultural and Biological Engineering. Urbana-Champaign, Illinois, EUA. E-mail: rcooke@illinois.edu 3 Instituto Federal de Educação, Ciência e Tecnologia Goiano. Iporá, GO. E-mail: vanessagrah@usp.br
4 Instituto Federal de Educação, Ciência e Tecnologia Baiano. Senhor do Bonfim, BA. E-mail: alissonagr@gmail.com
Introduction
Time domain reflectometry (TDR) is used to measure the propagation velocity of an electromagnetic pulse along parallel transmission lines through the soil. This velocity is expressed in terms of a soil dielectric constant (Ka), which is a compound of two parts: real (K’) and imaginary (K”) (Topp et al., 1980). The theory assumes that dielectric losses (K”) of the electromagnetic pulse, from emission to reception, by TDR are negligible. Thus, due to the strong correlation between the dielectric constant of the soil (Ka) and the soil water content (θ), the TDR instrument can be calibrated to determine the soil water content.
The most important advantages of this method are the high temporal resolution, the rapidity of acquisition and the repeatability (precision) of measurements (Calamita et al., 2012). According to Topp et al. (1988), it is also possible to simultaneously determine Ka and the apparent soil electrical conductivity (ECa) (solid-liquid-gas phase), because of the proportionality between the energy attenuation of the emitted signal and the soil ECa (Giese & Tiemann, 1975).
Over the years, several mathematical models (empirical or physical) were developed to relate ECa and θ, in order to determine the electrical conductivity of the soil solution, CEw, from the soil water content and soil apparent electrical conductivity (Rhoades et al., 1976; Vogeler et al., 1996; Muñoz-Carpena et al., 2005) among others. Out of these models emerged a new application for the technique; the real time monitoring of the ionic composition of the soil solution. This application is facilitated through the combination of two models. The first, mentioned previously, determines CEw, and the second is characterized by the relationship between the electrical conductivity of the soil solution and the concentration of a specific ion, Ci, (Coelho et al., 2005; Santana et al., 2007; Souza & Folegatti, 2010; Andrade Neto et al., 2012) Much research has been directed toward the quantification of the dielectric losses (K”) and its influence on the determination of the dielectric constant (Ka) and the apparent electrical conductivity (ECa). Cataldo et al. (2008; 2009) stated that even with appropriate calibration criteria, TDR readings can be affected by systematic or random errors, causing fluctuations in measurements. These fluctuations are inherent to the instrument and its specification is essential to the correct application. Major sources of error that can influence the reliability of the readings include the temperature variation (Jones et al., 2002; Venkatesh & Raghavan, 2004), the length of the connection cable between the probe and the TDR (Logsdon, 2000; Huisman et al., 2008; Ponciano et al., 2011), and high ECw concentrations (Bechtold et al., 2010; Bouksila et al., 2008). There is also the possibility that errors from different sources may occur simultaneously, making it impossible to characterize the variability of the readings, or to effectively calibrate the instrument.
In spite of their importance for agricultural application, the measurement errors inherent to the TDR technique have been seldom investigated. It is sought, therefore, to contribute to TDR monitoring of potassium status in soil solution, by employing metric tools to characterize systematic and random
errors resulting from applying the technique to two soils under laboratory conditions.
Material and Methods
The study was carried out in the laboratory area of Embrapa Cassava & Tropical Fruits, located in the municipality of Cruz das Almas, Bahia State. Soil particle-size distribution, soil densities and soil textural classes are presented in Table 1.
A grid of soil columns, initially air-dried, was formed, consisting of 24 treatments for each soil type (Figure 1A), following the methodology proposed by Andrade Neto et al. (2012) and Santana et al. (2007). Each column had specific conditions of moisture and electrical conductivity, obtained by applying a KCl solution to the column (Figure 1B). The arrangement consisted of four water contents for each soil, as follows: Soil "Sf " 0.10 ± 0.017, 0.197 ± 0.042, 0.258 ± 0.048 and 0.291 ± 0.043 cm3 cm-3, and soil "Sc" 0.148 ± 0.019, 0.229
Figure 1. Columns filled with soil (A) and application of KCl dissolved in water (B)
B. A.
± 0.034, 0.269 ± 0.034 and 0.320 ± 0.030 cm3 cm-3; and six KCl concentrations (1, 2, 3, 4, 5 and 6 dS m-1) for both types of soil.
TDR estimates of ECa and θ were obtained for each column, 24 h after applying the solutions. In addition, porcelain extractors were introduced into the center of each PVC column so the tensiometer was installed half way up the soil column. Electrical conductivity and the concentration of potassium of the soil solution for each column were measured in the laboratory. Equations relating these two parameters were fitted to the resulting data. The best fit lines were exponential and linear for Sc and Sf, respectively. These relationships were incorporated in Eqs. 1 and 2 to estimate potassium concentration in the soil solution using the model proposed by Rhoads et al. (1976) for Sc, Eq. 3, and the model proposed by Muñoz-Carpena et al. (2005) for Sf, Eq. 4:
similar procedure was applied by Huisman et al. (2008) for measuring the uncertainty of bulk electrical conductivity using TDR 100.
1 0.6615
2
Aa 2
CEa 0.0919 1
K R 0.93
0.1818 1.359 0.0511
−
= × =
× θ + × θ
2
2
Af 2
CEa 0.7557 1
K 0.3265 R 0.86
0.0267 1.1764 0.332
− × θ
= − × =
× θ + × θ
Models developed by Rhoades et al. (1976) and Muñoz-Carpena et al. (2005) were used to estimate the electrical conductivity of the soil solution (CEw). These models were fitted by minimizing the sum of square error between CEw measured with an electrical conductivity meter (Digimed DM-32) and estimated with TDR (probe characteristics: three rods, 0.1 m long, 0.03 m rod diameter, 0.017 m spaced root length sensors), in a sandy-clay (Sc) and loamy-sand (Sf). The fitted equations for these two soils are shown in Eqs. 3 and 4, respectively:
2
w 2
CEa 0.0919
CE R 0.98
1.359 0.0511
−
= =
× θ + × θ
2 2
w 2
CEa 0.3513
CE R 0.96
1.231 0.259
− × θ
= =
× θ + × θ
where:
CEa - apparent soil electrical conductivity, dS m-1; and, θ - soil moisture content, m3 m-3.
These equations were for disturbed soil, sieved and packed into 0.19-m-diameter, 0.20-m-high PVC columns.
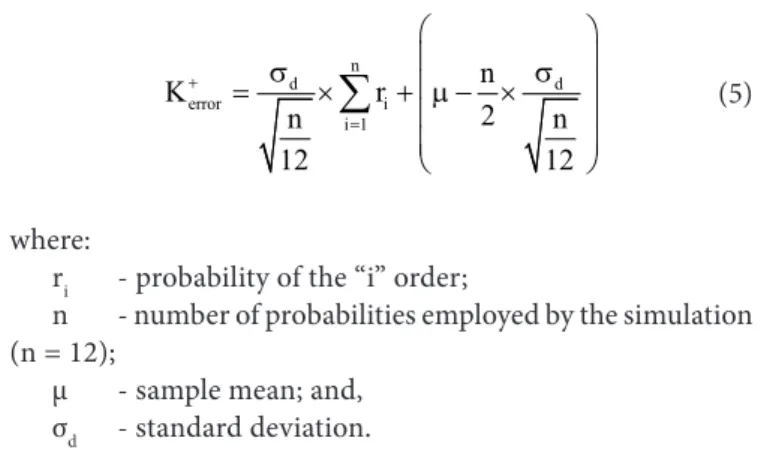
Potassium concentrations from these equations were compared to corresponding potassium concentrations measured by flame photometry. A requirement for applying the central limit theorem to the errors fluctuation involved in the calibration process, or generated by dielectric losses inherent to the system, is that the absolute error values (mg L-1) conform to a normal probability distribution (Vuolo, 1996). The mean and standard deviation of the absolute differences between the two measures of potassium concentration for each soil were used in the Method of Monte-Carlo (MMC) as shown in Eq. 5, to generate 50000 realizations of the absolute error in potassium determination (Kerror) by the TDR technique. A
n d d error i i 1 n K r 2 n n 12 12 + =
s s
= × + µ − ×
∑
where:
ri - probability of the “i” order;
n - number of probabilities employed by the simulation (n = 12);
μ - sample mean; and, σd - standard deviation.
These realizations were used in the normal cumulative probability function to calculate the probabilistic error, Eq. 6:
( )
( ) 2 d d d y 2 2 2 d 1F y e dy
2
−µ µ+ s −
s
µ− s
=
s × π
∫
where:
σd - standard deviation; μ - sample mean;
y - continuous variable; and,
“μ ± 2σd” - the limits of integration considered in this study.
Results and Discussion
Figure 2A illustrates the behavior of the absolute sample error (RE) associated with the estimate of potassium concentration by TDR versus the electrical conductivity of the soil solution. As implied by Santana et al. (2007), the greater the electrical conductivity of the soil solution, the greater the uncertainties associated with the estimate of TDR readings. Furthermore, it should be noted that there is symmetry between the increase in error by overestimation and underestimation for both soil materials: Loany Sand (Figure 2A), Eqs. 7 and 8; and Sandy-clay (Figure 2B), Eqs. 9 and 10.
- Loany Sand soil
2 positive w
K+ =2.402CE +3.019 R =0.145
2 negative w
K+ = −4.890CE −0.213 R =0.346
- Sandy-clay soil
2 positive w
K+ =1.790CE +1.904 R =0.128
2 negative w
K+ = −5.873CE +3.805 R =0.646
This behavior might be due to the TDR probes used, which performed quite well only in estimating soil electrical conductivity up to 3.04 dS m-1 (Silva et al., 2005).
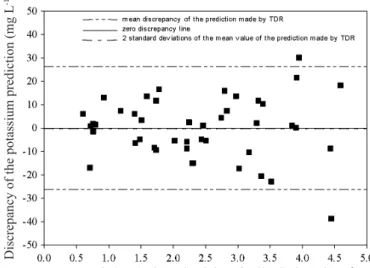
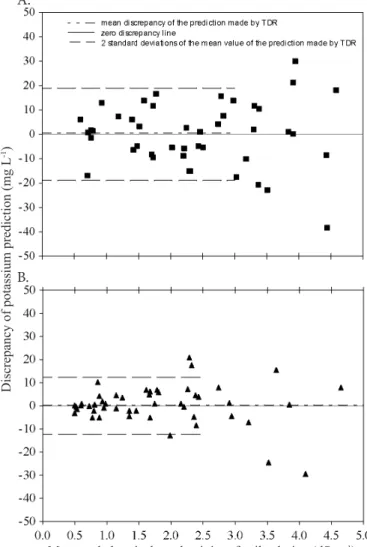
It can be seen, for Sf soil, that the average value was 0.23 mg L-1, and the upper and lower limits for the 95.45% confidence interval were 26.31 and -26.31 mg L-1, respectively (Figure 3). For Sc, the average value was 0.26 mg L-1, and the upper and lower limits for the 95.44% confidence interval were 17.13 and -17.13 mg L-1, respectively (Figure 4).
Based on the work of Arsoy et al. (2013), who studied TDR estimation of soil water content, the residues error in soil water content is related to dry bulk density; in soils with low dry density (less than 1.6 kg dm-3), TDR readings show higher dispersion in residues error, consistent with the pattern in Figure 3. On other hand, in soils with high dry density (more than 1.6 kg dm-³), TDR reading shows lower dispersion in residues values, similar to what is shown in Figure 4 for the clay soil.
Soil density variation is the major source of error, as it can create a measurement error in soil water content of as much as 0.030 m3 m−3 (Arsoy et al., 2013). The shape of soil particles can also be a secondary source of error (Jones et al., 2002). The discrepancy presented in that study indicates that the error
Potassium estimated error (mg L
-1)
A.
B.
Electrical conductivity of soil solution (dS m-1)
Figure 2. Absolute estimation error in the determination of potassium by TDR versus electrical conductivity of the soil solution, sandy (A) and clay (B)
Although the same concentrations of KCl were applied to both soils, the amplitude of errors for the clay soil was lower than that for the sandy soil; this may be due to the fact that at higher concentration of clay particles, ions migrate from the soil solution to the particles micelle, thereby decreasing the electrical conductivity of the soil solution (Santana et al., 2007; Oliveira et al., 2011).
The existing correlation between error amplitude and ECw could also be explained by the variation of electrical impedance in the TDR system (probe and cable, 50 Ω) generated during signal attenuation, as shown by Huisman et al. (2008). According to Paulter (2001), the propagation error generated during signal attenuation can influence both the reflectance coefficient signal used for ECw estimation (Giese & Tiemenn, 1975) and the impedance characteristic of the TDR system, thereby affecting TDR accuracy (Castiglione & Shouse, 2003; Bechtold et al., 2010).
The sample values of the errors for both soils were adjusted to normal probability distribution at the 1% level of significance through the Komolgorov-Smirnov statistical test and p-value above 20%, thus confirming the good adhesion to the theoretical distribution. Figures 3 and 4 show the residual errors from fitting the models to the measured potassium concentration for Sf and Sc, respectively, versus electrical conductivity of the soil solution.
Discrepancy of the potassium prediction (mg L
-1)
Figure 3. Discrepancy of the prediction versus the increased CEw and the integration limit of 95% of confidence for the Sandy soil
Measured electrical conductivity of soil solution (dS m-1)
Discrepancy of the potassium prediction (mg L
-1)
Figure 4. Discrepancy of the prediction versus the increased CEw and the integration limit of 95% of confidence for the Clay soil
could be propagated in potassium ion concentrations estimated by Eqs. 1 and 2; as it can also be seen in Figures 3 and 4.
In order to contribute to practical applications, it is proposed to reduce the uncertainties associated with TDR estimation of ionic concentrations (two-step analysis) by reducing the evaluation interval, taking into account the point at which there is a sudden change in the rate of increase of standard uncertainty (standard deviation) with respect to soil electrical conductivity. A significant change in the slope of the deviation’s lines is observed for both soils (Figure 5A; 5B), which may lead to a new classification of upper and lower limits for numerical error amplitude, as well as for standard deviation increases, based on the intervals of analysis.
Consequently, there was improved adherence of the sample values to the theoretical distribution, when the integration limits were -18.85 to 18.85 mg L-1 for Sf, a 28.3% reduction in the amplitude of the integration limits (Figure 5A).
The average absolute error was 0.5 mg L-1, with probability of 95.42% for the occurrence of errors by the use of TDR technique, as shown in Figure 6A.
For Sc, an approximate 27% reduction in the limits, to -12.50 to 12.50 mg L-1, resulted in a mean value of 1.2 mg L-1 with a probability occurrence of 95.06% shown in Figure 6B. It can be seen that the error amplitude obtained in this study considered all possible sources of unknown error propagation
Standard deviations
sd
(mg L
-1)
A.
B.
Soil electrical conductivity (dS m-1)
Figure 5. Standard deviation increase with increasing electrical conductivity of the sandy (A) and clay (B) soils
Discrepancy of potassium prediction (mg L
-1)
A.
B.
Measured electrical conductivity of soil solution (dS m-1)
Figure 6. Discrepancy of the prediction versus the increase in CEw and the integration limit of 95% of confidence for the Sandy soil (A) and Clay soil (B)
associated with the functions of potassium estimation (Eqs. 1 and 2), such as the moisture error described by Arsoy et al. (2013) and Cataldo et al. (2009).
In general, it should be noted that the preliminary good agreement in Eqs. 1 and 2 does not provide sufficient information for the calibration process. Incorporating the metrological perspective would enhance the suitability of using TDR probes to monitor ions in soil solution for sustainable agricultural applications. In fact, the magnitude of error of a single TDR reading can be overly large, compromising the effectiveness of the technique. However, it can be inferred from our results that the mean of repeated values has near-zero value error, and should be used to avoid fluctuating results and random error.
This supports the assumption of Bechtold et al. (2010), who studied impedance in TDR 100 application (cable, probe and unknown losses), that using a Waveavg (number of waveform averages pulse) value of at least 16 obtained accurate electrical conductivity measurements.
the technique can be used to characterize potassium movement in both saline and non-saline soils. The approach outlined herein is a suitable preliminary strategy for the evaluation of the TDR calibration procedure. It results in extremely robust estimates of potassium concentration, based on information gathered on the errors involving in the monitoring processes.
Conclusions
1. Random and systematic errors could lead to unreliable estimates of potassium concentration based on single TDR readings. However, the mean of repeated readings represents a near unbiased estimate of potassium concentration.
2. Potassium concentration in the soil solution can be determined with a 95% degree of confidence under laboratory conditions by a single reading, with a maximum error of ± 18.85 mg L-1 for soil electrical conductivity in the range of 0 to 3 dS m-1 in loamy sand soil (Sf).
3. The accuracy of TDR for estimated potassium concentration was a maximum error of ± 12.5 mg L-1 for soil electrical conductivity in the range of 0 to 2.5 dS m-1 in sand-clay soil (Sc).
Literature Cited
Andrade Neto, M.; Coelho, E. F.; Santana, J. A. V.; Santana Junior, E.B.; Alves, M. S. Potassium estimation in the soil solution based on electrical conductivity and soil water content. Revista Brasileira de Engenharia Agrícola e Ambiental, v.16, p.618-623, 2012. http:// dx.doi.org/10.1590/S1415-43662012000600005
Arsoy, S.; Ozgur, M.; Keskin, E.; Yilmaz, C. Enhancing TDR based water content measurements by ANN in sandy soils. Geoderma, v.195 p.133-144, 2013. http://dx.doi.org/10.1016/j. geoderma.2012.11.019
Bechtold, M.; Huisman, J. A.; Weihermüller, L.; Vereecken, H. Accurate determination of the bulk electrical conductivity with the TDR100 cable tester. Soil Science Society America Journal, v.74, 495-501, 2010. http://dx.doi.org/10.2136/sssaj2009.0247 Bouksila, F.; Persson, M.; Berndtsson, R.; Bahri, A. Soil water content
and salinity determination using different dielectric methods in saline gypsiferous soil. Hydrological Sciences Journal, v.68 p.253-265, 2008. http://dx.doi.org/10.1623/hysj.53.1.253
Bourbia, S. M.; Barré, P.; Kaci, M. B. N.; Derridj, A.; Velde, B. Potassium status in bulk and rhizospheric soils of Oliver groves in North Algeria. Geoderma, v.197 p.161-168, 2013. http://dx.doi. org/10.1016/j.geoderma.2013.01.007
Calamita, G.; Brocca L.; Perrone, A.; Piscitelli, S.; Lapenna, V.; Melone, F.; Moramarco, T. Electrical resistivity and TDR methods for soil moisture estimation in central Italy test-sites. Journal of Hydrology, v.454 p.101-112, 2012. http://dx.doi.org/10.1016/j. jhydrol.2012.06.001
Cataldo, A.; Cannazza, G.; Benedetto, E. de.; Tarricone, L.; Cipressa, M. Metrological assessment of TDR performance for moisture evaluation in granular materials. Measurement, v.42, p.254-263, 2009. http://dx.doi.org/10.1016/j.measurement.2008.06.006 Cataldo, A.; Tarricone, L.; Vallone, M.; Attivissimo, F.; Trotta, A.
Uncertainty estimation in simultaneous measurements of levels and permittivities of liquids using TDR technique. IEEE Transactions on Instrumentation and Measurement, v.57, p.454-466, 2008. http://dx.doi.org/10.1109/TIM.2007.911700
Castiglione, P.; Shouse, P. J. The effect of homic cable losses o time-domain reflectometry measurements of electrical conductivity. Soil Science Society America Journal, v.67, p.414-424, 2003. http:// dx.doi.org/10.2136/sssaj2003.4140
Coelho, E. F.; Vellame, L. M.; Coelho Filho, M. A. Sondas de TDR para estimativa da umidade e condutividade elétrica do solo com uso de multiplexadores. Revista Brasileira de Engenharia Agrícola e Ambiental, v.9, p.475-480, 2005. http://dx.doi.org/10.1590/S1415-43662005000400006
Giese, K.; Tiemann, R. Determination of the complex permittivity from thin-sample time domain reflectometry improved analysis of the step response waveform. Advances in Molecular Relaxation Processes, v.7, p.45-59, 1975. http://dx.doi.org/10.1016/0001-8716(75)80013-7 Huisman, J. A.; Lin, C. P.; Weihermüller, L.; Vereecken, H. Accuracy
of bulk electrical conductivity measurements with time domain reflectometry. Vadose Zone, v.7, p.426-433, 2008. http://dx.doi. org/10.2136/vzj2007.0139
Jones, S. B.; Wraith, J. M.; Or, D. Time domain reflectometry measurement principles and applications. Hydrological Processes, v.16, p.141-153, 2002. http://dx.doi.org/10.1002/hyp.513 Logsdon, S. D. Effect of cable length on time domain reflectometry
calibration for high surface area soils. Soil Science Society America Journal, v.64, p.54-61, 2000. http://dx.doi.org/10.2136/ sssaj2000.64154x
Merdum, H. Using TDR and modeling tools to investigate effects of interactive factors on preferential flow and transport in Field Sandy Clay soil. Environmental Earth Sciences, v.71, p.1821-1838, 2014. http://dx.doi.org/10.1007/s12665-013-2586-6
Muñoz-Carpena, R.; Regalado, C. M.; Ritter, A.; Alvarez-Benedí, J.; Socorro, A. R. TDR estimation of electrical conductivity and saline solute concentration in a volcanic soil. Geoderma, v.124, p.399-413, 2005. http://dx.doi.org/10.1016/j.geoderma.2004.06.002 Oliveira, F. A.; Medeiros, J. F.; Duarte, S. N.; Silva Júnior, M. J.;
Campelo, C. M. Calibração de extratores providos de cápsula porosa para monitoramento da salinidade e da concentração de íons. Engenharia Agrícola, v.31, p.520-528, 2011. http://dx.doi. org/10.1590/S0100-69162011000300012
Paulter, N. G. An assessment on the accuracy of time-domain reflectometry for measuring the characteristic impedance of transmission lines. IEEE Transactions on Instrumentation and Measurement, v.50, p.1381-1388, 2001. http://dx.doi.org/10.1109/19.963214
Ponciano, I. M.; Coelho, E. F.; Miranda, J. H. Parâmetros para escolha de comprimento e cobertura de cabo coaxial na reflectometria no domínio do tempo (TDR). In: Congresso Brasileiro de Ciência do Solo, 33, 2011, Uberaba. Anais… Viçosa: SBCS, 2011. CD-Rom Rhoades, J. D.; Raats, P. A. C.; Prather, R. J. Effects of liquid-phase
electrical conductivity, water content, and surface conductivity on bulk soil electrical conductivity. Soil Science Society America Journal, v.40, p.651-655, 1976. http://dx.doi.org/10.2136/ sssaj1976.03615995004000050017x
Santana, G. S.; Coelho, E. F.; Silva, T. M.; Ramos, M. M. Relação entre potássio na solução do solo, umidade e condutividade elétrica aparente do solo. Revista Brasileira de Engenharia Agricola e Ambiental, v.11, p.142-151, 2007. http://dx.doi.org/10.1590/ S1415-43662007000200003
Souza, C. F.; Folegatti, M. V. Spatial and temporal characterization of water and solute distribution patterns. Scientia Agricola, v.67, p.9-15, 2010. http://dx.doi.org/10.1590/S0103-90162010000100002 Topp, G. C.; Davis, J. L.; Annan, A. P. Electromagnetic determination
of soil water content: measurements in coaxial transmission lines. Water Resources Research, v.16, p.574-582, 1980. http://dx.doi. org/10.1029/WR016i003p00574
Topp, G. C.; Yanuka, M.; Zebchuk, W. D.; Zegelin, S. Determination of electrical conductivity using time-domain reflectometry:soil and water experiments in coaxial lines. Water Resources Research, v.24, p.945-952, 1988. http://dx.doi.org/10.1029/WR024i007p00945
Venkatesh, M. S.; Raghavan, G. S. V. An overview of microwave processing and dielectric properties of agri-food materials. Biosystems Engineering, v.88, p.1-18, 2004. http://dx.doi. org/10.1016/j.biosystemseng.2004.01.007
Vogeler, I.; Clothier, B. E.; Green, S. R.; Scotter, D. R.; Tillman, R. W. Characterizing water and solute movement by time domain reflectometry and disk permeametry. Soil Science Society America Journal, v.60, p.5-12, 1996. http://dx.doi.org/10.2136/ sssaj1996.03615995006000010004x