Financial indicators to evaluate the economic performance
of feedlot steers with different slaughter weights
Indicadores financeiros na avaliação do desempenho econômico do confinamento de novilhos com diferentes pesos de abate Edom de Avila Fabricio1* Paulo Santana Pacheco1 Fabiano Nunes Vaz3 Daniel Batista Lemes2 Angelina Camera2 Gabriella Ibarra Ocaña Machado2
ISSNe 1678-4596
INTRODUCTION
In today’s agribusiness scenario in Brazil, where agriculture is shown competitive and has
advanced on livestock areas, finishing cattle in feedlot
becomes a potential investment option, it allows a
significant increase of beef production per unit area
and the possibility to integrate other activities. RESTLE et al. (2007) commented that
among other factors, the epoch planned for sale
and slaughter weight are closely related to the
profitability of the feedlot. In the study of PACHECO
et al. (2014a), increase in slaughter weight resulted
in a high possibility of economic unsuccessful of feedlot activity, although at lighter weights would not
be possible to obtain carcasses with adequate degree
of subcutaneous fat thickness. Thus, a strategic evaluation considering variation in the time of sale and slaughter weight can aid in the definition the best
economic investment results.
Although being considered high cost of technology, the use of feedlot has increased in production units throughout Brazil (FERREIRA et al., 2009; MOREIRA et al., 2009; LOPES et
1Departamento de Zootecnia, Universidade Federal de Santa Maria (UFSM), 97105-900, Santa Maria, RS, Brasil. E-mail: [email protected].
*Correspondig author.
2Departamento de Zootecnia, Universidade Federal de Santa Maria (UFSM), Santa Maria, RS, Brasil.
3Departamento de Educação Agrícola e Extensão Rural, Universidade Federal de Santa Maria (UFSM), Santa Maria, RS, Brasil.
ABSTRACT:The objective of this study was to evaluate various financial indicators, estimated deterministically (considering historical quotes twelve consecutive years - 2003 to 2014), on the economic feasibility of finishing steers commercialized with different weights, using the simulation technique. Performance data steers were simulated with average initial weight of 350kg, fed in feedlot and slaughtered with 410, 440, 470, 500, 530, 560 and 590kg. The feeding period varies from 46 to 185 days, respectively. Based in various economic indicators, the viability of the investment decreased linearly according to the increase in slaughter weight. The coefficient of simple linear regression and means from lowest to highest slaughter weight were, respectively: net present value (-0.538 and R$ 67.37, R$ 65.28, R$ 32.14, R$ -7.34, R$ 8.01, R$ -12.38, R$ -23.41); index benefit: cost (-0.0003 and R$ 1.042, R$ 1.039, R$ 1.014, R$ 1.006, R$ 1.003, R$ 0.995, R$ 0.991); additional return on investment (-0.009 and 1.38, 1.29, 0.35, 0.11, 0.05, -0.08, -0.13% per month); internal rate of return (-0.009 and 2.21, 2.10, 1.28, 0.80, 0.93, 0.78, 0.73% per month). Feedlot use as termination option to obtain the direct benefits of this technology is an alternative investment with low economic return.
Key words: economic analysis, beef cattle, investment projects, intensive systems, microeconomics.
RESUMO:O objetivo deste estudo foi avaliar diversos indicadores financeiros estimados de forma determinística (considerando cotações históricas de doze anos consecutivos - 2003 a 2014) na viabilidade econômica da terminação de novilhos em confinamento, comercializados em diferentes pesos, utilizando a técnica de simulação. Foram simulados dados de desempenho de novilhos com peso médio inicial de 350kg, alimentados em confinamento para serem abatidos com 410, 440, 470, 500, 530, 560 e 590kg. O período de alimentação variou de 46 a 185 dias, respectivamente. Baseada em vários indicadores, a viabilidade do investimento diminuiu linearmente de acordo com o aumento do peso. O coeficiente de regressão linear simples e as médias do menor para o maior peso de abate foram, respectivamente: valor presente líquido (-0,538 e R$ 67,37, R$ 65,28, R$ 32,14, R$ -7,34, R$ 8,01, R$ -12,38, R$ -23,41); índice benefício: custo (-0,0003 e R$ 1,042, R$ 1.039, R$ 1,014, R$ 1,006, R$ 1,003, R$ 0,995, R$ 0,991); retorno adicional sobre o investimento (-0,009 e 1,38, 1,29, 0,35, 0,11, 0,05, -0,08, -0,13% a.m.); taxa interna de retorno (-0,009 e 2,21, 2,10, 1,28, 0,80, 0,93, 0,78, 0,73% a.m.). O uso do confinamento como opção de terminação, visando obter os benefícios diretos desta tecnologia, representa a alternativa de investimento com baixo retorno econômico.
Palavras-chave:análise econômica, bovinos de corte, projetos de investimento, sistemas intensivos, microeconomia.
al., 2013). This characteristic has motivated the
development of studies on the economic viability,
enabling decision making between investing or not,
prior to implementation of the investment project.
In this way, the economic evaluation methods become important auxiliary tools in decision making. Economic analysis considering
various financial indicators together is suggested by SOUZA & CLEMENTE (2009), which according to the authors, resulted in more consistent information for risk assessment and his confrontation with the possibility of return. However, this methodology is
still under used in animal production.
The objective of this study was to evaluate various financial indicators, estimated deterministically, on the economic feasibility of finishing steers commercialized with different
weights, using the simulation technique.
MATERIALS AND METHODS
The experiment was conducted in the
Department of Animal Science, Universidade Federal
de Santa Maria, Rio Grande do Sul state, Brazil.
The economic viability of feedlot was evaluated by deterministic analysis (using items from static costs
and revenues), considering historical quotes of twelve
consecutive years (2003-2014).
Performance data steers were simulated to reach slaughter weights of 410, 440, 470, 500, 530, 560 and 590kg live weight from the initial average weight of 350kg.
A diet was formulated for each slaughter
weight (Table 1), considering the same ingredients,
but in different proportions aiming at meeting the nutritional necessity of each weight range, according
to the average daily gain weight established. For this, the BR-Corte2® software - available online by VALADARES FILHO et al. (2012) - was
used, determining the nutritional requirements
and formulating diets. Ingredients included in
the concentrate were ground corn, soybean meal, urea and minerals. The roughage was corn silage.
Formulated diets obtained 78% of Total Digestible Nutrients (TDN) and 14% of crude protein (CP), with a forage: concentrate ratio of 30:70, as described by OLIVEIRA & MILLEN (2014) as an average value of use in Brazilian feedlots.
Marketing of animals was scheduled to occur in the month of July (premiums or discounts were not considered), period where the finished cattle has the highest prices in Rio Grande do Sul state
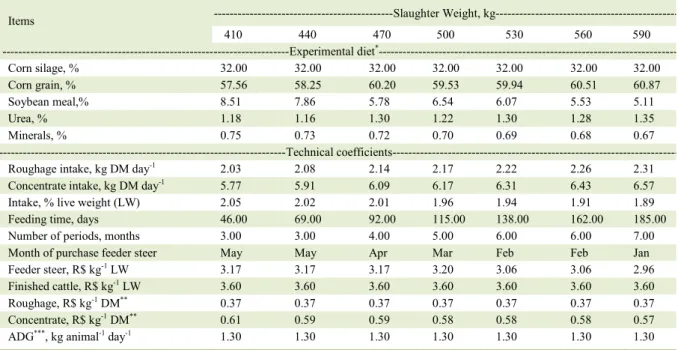
Table 1 - Experimental diet (as a percentage of dry matter - DM) and performance of technical coefficients according to the slaughter weight.
Items ---Slaughter Weight, kg---
410 440 470 500 530 560 590
---Experimental diet*---
Corn silage, % 32.00 32.00 32.00 32.00 32.00 32.00 32.00
Corn grain, % 57.56 58.25 60.20 59.53 59.94 60.51 60.87
Soybean meal,% 8.51 7.86 5.78 6.54 6.07 5.53 5.11
Urea, % 1.18 1.16 1.30 1.22 1.30 1.28 1.35
Minerals, % 0.75 0.73 0.72 0.70 0.69 0.68 0.67
---Technical coefficients ---Roughage intake, kg DM day-1 2.03 2.08 2.14 2.17 2.22 2.26 2.31 Concentrate intake, kg DM day-1 5.77 5.91 6.09 6.17 6.31 6.43 6.57
Intake, % live weight (LW) 2.05 2.02 2.01 1.96 1.94 1.91 1.89
Feeding time, days 46.00 69.00 92.00 115.00 138.00 162.00 185.00
Number of periods, months 3.00 3.00 4.00 5.00 6.00 6.00 7.00
Month of purchase feeder steer May May Apr Mar Feb Feb Jan
Feeder steer, R$ kg-1 LW 3.17 3.17 3.17 3.20 3.06 3.06 2.96
Finished cattle, R$ kg-1 LW 3.60 3.60 3.60 3.60 3.60 3.60 3.60
Roughage, R$ kg-1 DM** 0.37 0.37 0.37 0.37 0.37 0.37 0.37
Concentrate, R$ kg-1 DM** 0.61 0.59 0.59 0.58 0.58 0.58 0.57
ADG***, kg animal-1 day-1 1.30 1.30 1.30 1.30 1.30 1.30 1.30
*Based on average body weight between initial weight and slaughter weight. **Considering a purchase at the beginning of the period based on
(ANUALPEC, 2015). In this way, beginning of feedlot
was simulated according to weight gain (1.3kg/day)
and the predetermined slaughter weight, as verified in the studies of VAZ et al. (2013), ARGENTA et al. (2014) and OLIVEIRA & MILLEN (2014) - this last
research conducted with 31 consultants in several states
of Brazil. To determine the date of purchase of steers the following equation was used: month of purchase
= sales month-((initial slaughter weight)/average daily
gain/30). How not to have a daily or weekly quotation of the price of feeder steers, a few treatments have obtained the same cost of feeder steer, because the calculated period needed for termination returned to a different number of days, with the onset in the same month. These coefficients are shown in table 1.
The different slaughter weights were considered investment projects mutually exclusive. To estimate costs, revenues and financial indicators
(estimated per animal), were used the average values
practiced in Rio Grande do Sul State, in the years 2003-2014, deflated for 2014 by the IGP-DI of Getúlio Vargas Foundation. The data have been obtained from the following sources: CONAB - National Supply Company, IEA - Institute of Agricultural Economy of São Paulo, EMATER / RS-ASCAR and ANUALPEC - Brazilian Livestock Yearbook. For purposes of
conversion, was considered R$ 1.00 = US$ 0.35.
For classification of cost items, revenue and calculation of financial indicators was utilized the methodology proposed by PACHECO et al. (2014a). Facility costs were estimated for static capacity of 1,000 animals and lifespan of 25 years. Depreciation (facilities, machinery, implements and equipments) were calculated for a planning horizon of one year. Opportunity costs were calculated considering the minimum rate of attractiveness (TMA) of 0.8687% per month (equivalent of 10.91% per year) based on the average basic rate SELIC (Special System of Clearance and Custody) in the year of 2014. The opportunity cost of capital invested was obtained by the sum of operating expenses (feeder cattle purchase, health
control, roughage, concentrate, labor and additional
expenses) for the period corresponding to the number of months stipulated for each slaughter weight.
For the opportunity cost of land (referring only to the area designated for the feedlot facility),
was considered the possibility at the annual rental
equivalent to 3% of the average hectare value (R$ 9,370.19) for agriculture in the region of Santa Maria/ Cachoeira do Sul in the last 12 years (ANUALPEC, 2015). It was determined for each confined animal 0.025ha which is equivalent to taking advantage of
40 animals per hectare.
The health control consisted of the application of veterinary products for controlling
ectoparasites (ivermectin 1%), and vaccination
against foot and mouth disease in dose per animal according to the manufacturer’s recommendations. Feed cost was obtained by the product of the total consumption of roughage and concentrate (kg
DM animal-1) for their respective costs kg-1 DM
and this cost was considered in its totality at the
period zero in cash flow.
For cost estimates with labor, considered
the need of 1 man for 500 animals, receiving a minimum wage plus burdens, and for technical
assistance remunerated in two minimum wages per
month for every 1,000 animals (average minimum wage from 2003 to 2014, R$ 593.00). Ten days were added to the feeding period for the preparation and maintenance of facilities, machinery and equipments. Costs of additional expenses (maintenance of facilities, machinery, implements and equipments + fuel + electricity + shipping + office supplies + taxes) were estimated for the equivalent of 3% of the
mentioned operating cost.
Fixed costs (FC=depreciation +
opportunity of facilities, machinery, implements and
equipment + land opportunity) and variable costs
(VC=feeder cattle + health + roughage + concentrate
+ labor + technique assistance + additional + capital
opportunity), effective operational cost (EOC=VC - capital opportunity), total operational cost (TOC= EOC+ depreciation), total cost (TC=FC+VC), gross revenue (GR=revenue with fat cattle sale), gross margin (GM=GR-EOC), net margin (NM= GR-TOC), profit (GR-TC), cost/kg weight gain, cost/@ weight gain, net present value (NPV), index benefit: cost (IB:C), additional return on investment (ROIA); Internal Rate of Return (IRR) and payback period (payback) discounted (PBd) were obtained as presented equations for PACHECO et al. (2014a) and SOUZA & CLEMENTE (2009).
For simulation, tabulation and data analysis
was used the Microsoft® Excel software (Microsoft,
Redmond, WA). Data were submitted to simple linear
regression analysis. Mathematical model employed
in the analysis was: ŷij=β0+β1SWi+eij, where: ŷij =
estimated dependent variables, β0= intercept, β1 =
regression coefficient, SWi= slaughter weight (kg), eij
= random error (~NID, 0, σ²).
RESULTS AND DISCUSSION
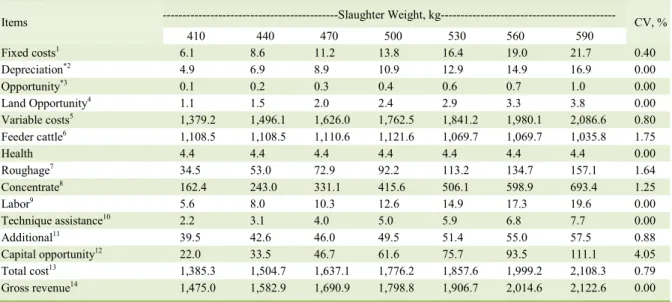
in the cost of feed (roughage + concentrate). Among the variable costs, the purchase of the feeder steers was the item of greatest impact in the lighter weights,
reducing its relative importance as the animals have
been traded heaviest. This result reflected the increase in feed cost associated with decline in the cost of feeder steer, since the higher slaughter weight greater the fattening period. Thus, purchase of lean animals
took place an increasingly earlier each year, a time when quotations are lower compared to other months
according to ANUALPEC (2015). PACHECO et al. (2014a) confirmed that feed costs, acquisition and sale of animal prices are responsible for much of the variation in the economic viability of feedlot.
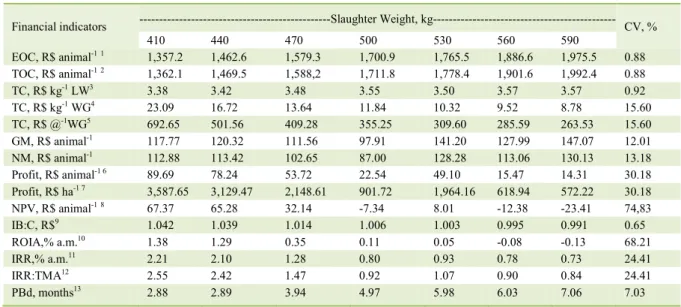
Financial indicators (Table 3) EOC, TOC, TC and GR showed positive and significant regression coefficients. The increase in slaughter weight did not significantly influence the GM
and NM. Many times, economic analysis made
superficially observing just GM or MN values can classify an investment as feasible. However, the costs of depreciation, not considered in the calculation of GM, and opportunity cost of capital
and land, not considered in NM are important to
confirm conditions that the activity has to remain for
a longer time without decapitalizing the investor.
Profit per animal has been decreasing
according to increased slaughter weight, according
to estimates of the regression equation. A similar behavior has been verified for profit per hectare,
limiting the same weight. This indicator also showed
a strong point of feedlot, demonstrating good results
by area, when the result is positive per animal. In a
study with young steers (FERREIRA et al., 2009) and steers (PACHECO et al., 2014b) there was a greater viability in shorter periods of confinement, agreeing with the results of this research.
There was a decreasing behavior in the
NPV per animal, turning negative after 534kg of
slaughter weight, according to regression equation.
This indicator reflects the return on monetary investment values measured by the difference between the present value of cash inflows and the present value of cash outflows, submitted to a certain discount rate (TMA) (KASSAI et al., 2007). In this case, it indicated that from 534kg of slaughter weight, the investment should not be executed from the economic point of view because his return will be less than TMA.
In other research evaluating slaughter
weights (PACHECO et al., 2012, 2014a), lighter
weights showed better economic results through the
Table 2 - Cost items and revenue estimated in R$ per animal according to the slaughter weight (R$ 1.00 = US$ 0.35).
Items ---Slaughter Weight, kg--- CV, %
410 440 470 500 530 560 590
Fixed costs1 6.1 8.6 11.2 13.8 16.4 19.0 21.7 0.40
Depreciation*2 4.9 6.9 8.9 10.9 12.9 14.9 16.9 0.00
Opportunity*3 0.1 0.2 0.3 0.4 0.6 0.7 1.0 0.00
Land Opportunity4 1.1 1.5 2.0 2.4 2.9 3.3 3.8 0.00
Variable costs5 1,379.2 1,496.1 1,626.0 1,762.5 1,841.2 1,980.1 2,086.6 0.80 Feeder cattle6 1,108.5 1,108.5 1,110.6 1,121.6 1,069.7 1,069.7 1,035.8 1.75
Health 4.4 4.4 4.4 4.4 4.4 4.4 4.4 0.00
Roughage7 34.5 53.0 72.9 92.2 113.2 134.7 157.1 1.64
Concentrate8 162.4 243.0 331.1 415.6 506.1 598.9 693.4 1.25
Labor9 5.6 8.0 10.3 12.6 14.9 17.3 19.6 0.00
Technique assistance10 2.2 3.1 4.0 5.0 5.9 6.8 7.7 0.00
Additional11 39.5 42.6 46.0 49.5 51.4 55.0 57.5 0.88
Capital opportunity12 22.0 33.5 46.7 61.6 75.7 93.5 111.1 4.05 Total cost13 1,385.3 1,504.7 1,637.1 1,776.2 1,857.6 1,999.2 2,108.3 0.79
Gross revenue14 1,475.0 1,582.9 1,690.9 1,798.8 1,906.7 2,014.6 2,122.6 0.00
*Considering cost of facilities, machinery, implements and equipment.
1Ŷ=-29.6+0.087*PA, R²=1, P<0.01; 2Ŷ=-22.56+0.067*PA, R²=1, P<0.01; 3Ŷ=-1.98+0.005*PA, R²=0.975, P<0.01; 4Ŷ=-5.06+0.015*PA,
R²=1, P<0.01; 5Ŷ=-228.64+3.93*PA, R²=0.998, P<0.01; 6Ŷ=1289.62-0.40*PA, R²=0.690, P=0.0206; 7Ŷ=-246.22+0.68*PA, R²=0.999,
P<0.01; 8Ŷ=-1054.47+2.95*PA, R²=0.999, P<0.01; 9Ŷ=-26.07+0.077*PA, R²=1, P<0.01; 10Ŷ=-10.24+0.03*PA, R²=1, P<0.01; 11Ŷ =-1.29+0.10*PA, R²=0.996, P<0.01; 12Ŷ=-184.32+0.49*PA, R²=0.995, P<0.01; 13Ŷ=-258.23+4.02*PA, R²=0.998, P<0.01; 14Ŷ=0+3.597*PA,
NPV financial indicator. SOUZA & CLEMENTE (2009) stated that, for sure, NPV is the investment
analysis technique most widely known and employed; however, in research on economic
evaluation in beef cattle area, it is still not found, making difficult results comparisons.
COAN et al. (2008) commented that considering a system where the feedlot is integrated
with other production activities, even when the
economic outcome is similar to the financial application (TMA), you should choose to use, since the indirect benefits justify its adoption.
Another important indicator is the IB:C or profitability index, a measure of how much is expected to earn per unit of capital invested at the end of the planning horizon (SOUZA & CLEMENTE, 2009).
This research showed a decreasing behavior, the best return has been obtained in lighter weight (R$ 1.042),
indicating a return of R$ 0.991 in the last slaughter weight for each R$ 1,000 invested. Similar results (decrease of the IB:C with increasing slaughter weight) were reported by MELLO et al. (2009) and PACHECO et al. (2012, 2014a). For this indicator, for that the project has viability, the maximum weight of fattening
estimated by regression equation was 545kg.
In terms of profitability through the IB:C,
it can be expected the lightest slaughter weight,
4.2% of real profitability at the end of the project. However, this rate did not allow an immediate comparison with the TMA (0.87% a.m.). Equivalent rate for the same period is the ROIA, which as SOUZA & CLEMENTE (2009) is the best estimate of profitability because informs the value obtained beyond the application of capital in the TMA in
percentage per period. In this study, a linear decrease according to increased slaughter weight, and weight
estimated by regression equation as the limit for a
positive result has been 548kg.
IRR is a way to also evaluate the risk of the investment, which is the rate that equals the NPV to zero, thus being greater than the TMA indicating viability in the project, conversely the closer the TMA, the greater was the risk of getting a NPV equal to zero (SOUZA & CLEMENTE, 2009). In this paper
the IRR was decreasing and became lower than the
TMA after 544kg of slaughter weight, according to
the regression equation. This comparison is shown in
the index IRR:TMA. In their study, PACHECO et al. (2014a) reported a negative IRR, unlike PACHECO et al. (2012) in which the IRR overcame TMA.
Regarding PBd, according SOUZA & CLEMENTE (2009) is classified as risk indicator, which means that the greater PBd relative to the
investment horizon, greater is the risk. There was an
Table 3 - Estimated financial indicators per animal according to the slaughter weight (R$ 1.00 = US$ 0.35).
Financial indicators ---Slaughter Weight, kg---CV, %
410 440 470 500 530 560 590
EOC, R$ animal-11 1,357.2 1,462.6 1,579.3 1,700.9 1,765.5 1,886.6 1,975.5 0.88
TOC, R$ animal-12 1,362.1 1,469.5 1,588,2 1,711.8 1,778.4 1,901.6 1,992.4 0.88
TC, R$ kg-1 LW3 3.38 3.42 3.48 3.55 3.50 3.57 3.57 0.92
TC, R$ kg-1WG4 23.09 16.72 13.64 11.84 10.32 9.52 8.78 15.60
TC, R$ @-1WG5 692.65 501.56 409.28 355.25 309.60 285.59 263.53 15.60
GM, R$ animal-1 117.77 120.32 111.56 97.91 141.20 127.99 147.07 12.01
NM, R$ animal-1 112.88 113.42 102.65 87.00 128.28 113.06 130.13 13.18
Profit, R$ animal-1 6 89.69 78.24 53.72 22.54 49.10 15.47 14.31 30.18
Profit, R$ ha-1 7 3,587.65 3,129.47 2,148.61 901.72 1,964.16 618.94 572.22 30.18
NPV, R$ animal-18 67.37 65.28 32.14 -7.34 8.01 -12.38 -23.41 74,83
IB:C, R$9 1.042 1.039 1.014 1.006 1.003 0.995 0.991 0.65
ROIA,% a.m.10 1.38 1.29 0.35 0.11 0.05 -0.08 -0.13 68.21
IRR,% a.m.11 2.21 2.10 1.28 0.80 0.93 0.78 0.73 24.41
IRR:TMA12 2.55 2.42 1.47 0.92 1.07 0.90 0.84 24.41
PBd, months13 2.88 2.89 3.94 4.97 5.98 6.03 7.06 7.03
1Ŷ=-44.31+3.439*PA, R²=0.996, P<0.01; 2Ŷ=-66.87+3.506*PA, R²=0.996, P<0,01; 3Ŷ=2.96+0.0012*PA, R²=0.851, P<0,01; 4Ŷ =49.51-0.072*PA, R²=0.851, P<0,01; 5Ŷ=1,485.23-2.165*PA, R²=0.857, P<0,01; 6Ŷ=203.91-0.357*PA, R²=0.768, P<0,01; 7Ŷ=10,329.34-16.966*PA,
increase in PBd with the increase in slaughter weight, according to regression analysis. Cash flow of this
study has now a conventional behavior, because it presents several negative periods becoming positive only in the last period, when revenue is thus always
present in the final payback period, indicating a high
risk investment.
CONCLUSION
Based on the financial indicators used in this study in a joint manner, investment has become less economically feasible with increasing slaughter weight. Considering the costs of items and revenue estimated from annual prices from 2003 to 2014, the use of confinement as finishing option to obtain the direct benefits of this technology is an alternative
investment with low economic return. The simulation technique is an important tool to assist
in decision making previously of implementation of investment projects in feedlot.
ACKNOWLEDGEMENTS
We thanks the Coordenação de Aperfeiçoamento de Pessoal de Nível Superior (CAPES) and the Conselho Nacional de Desenvolvimento Científico e Tecnológico (CNPq) for providing the financial support required for this study.
REFERENCES
ANUALPEC. Anualpec 2015: anuário da pecuária brasileira. São
Paulo, SP: Informa Economics FNP, 2015. 280p.
ARGENTA, F.M. et al. Steers performance fed diets with Alexander
grass silage (Urochloa plantaginea) x sorghum silage (Sorghum bicolor (L.) Moench). Semina: Ciências Agrárias, v.35, n.2,
p.951, 2014. Available from: <http://goo.gl/cErVwB>. Accessed: Aug. 10, 2015. doi: 10.5433/1679-0359.2014v35n2p951.
COAN, R.M. et al. Economical viability, performance, and carcass characteristics of confined steers fed palisadegrass
silage, tanzaniagrass silage or corn silage. Revista Brasileira de Zootecnia, v.37, n.2, p.311-318, 2008. Available from: <http://
goo.gl/VqyOpa>. Accessed: Dec. 21, 2015. doi:
10.1590/S1516-35982008000200018.
FERREIRA, I.C. et al. Technical and economic evaluations of different genetic groups of yearling beef cattle males and of the
feedlot production system. Arquivo Brasileiro de Medicina
Veterinária e Zootecnia, v.61, n.1, p.243-250, 2009. Available
from: <http://goo.gl/wrUOjP>. Accessed: Nov. 11, 2015. doi:
10.1590/S0102-09352009000100034.
KASSAI, J.R. et al. Retorno de investimento: abordagens
matemática e contábil do lucro empresarial. 3.ed. São Paulo: Atlas,
2007. 277p.
LOPES, M.A. et al. Economic analysis of the finishing of beef cattle
in feedlots in the state of Minas Gerais: a case study. Revista Ceres,
v.60, n.4, p.465-473, 2013. Available from: <http://goo.gl/I1Ywle>. Accessed: Jan. 10, 2016. doi: 10.1590/S0034-737X2013000400004.
MELLO, R. et al. Bio-economicity of the finishing phase on feedlot of crossbred young bulls slaughtered at different body
weights. Revista Brasileira de Zootecnia, v.38, n.1, p.109-121,
2009. Available from: <http://goo.gl/YrlsV6>. Accessed: Jan. 05,
2016. doi: 10.1590/S1516-35982009000100015.
MOREIRA, S.A. et al. Economic analysis of beef cattle feedlot
finished within the dynamics of a farm. Custos e @gronegócio
online, v.5, n.3, p.132-152, 2009. Available from: <http://goo.
gl/8kSCeL>. Accessed: Jan. 20, 2016.
OLIVEIRA, C.A.; MILLEN, D.D. Survey of the nutritional recommendations and management practices adopted by feedlot
cattle nutritionists in Brazil. Animal Feed Science and Technology,
v.197, p.64-75, 2014. Available from: <http://goo.gl/PNups1>. Accessed: May 23, 2014. doi: 10.1016/j.anifeedsci.2014.08.010.
PACHECO, P.S. et al. Economic viability of feedlot finishing
steers slaughtered with different weights. Pesquisa Agropecuária
Gaúcha, v.18, n.2, p.135-145, 2012. Available from: <https://goo.
gl/dSUocX>. Accessed: May 25, 2014.
PACHECO, P.S. et al. Economic deterministic analysis of
feedlot-finished steers slaughtered at different weights. Ciência Animal
Brasileira, v.15, n.4, p.420-427, 2014a. Available from: <http://goo.gl/
ePV4Ly>. Accessed: 1 Feb, 2013. doi: 10.590/1089-6891v15i4257474.
PACHECO, P.S. et al. Economic analysis of finishing feedlot steers
fed different proportions of sugar cane and concentrated. Semina:
Ciências Agrárias, v.35, n.2, p.999-1012, 2014b. Available
from: <http://goo.gl/SxCvUH>. Accessed: May 24, 2015. doi:
10.5433/1679-0359.2014v35n2p999.
RESTLE, J. et al. Economic evaluation of feedlot finished Red
Angus young steers slaughtered with different weights. Revista
Brasileira de Zootecnia, v.36, n.4, p.978-986, 2007. Available
from: <http://goo.gl/ABTA6X>. Accessed: Jan. 10, 2016. doi:
10.1590/S1516-35982007000400030.
SOUZA, A.; CLEMENTE, A. Decisões financeiras e análise
de investimentos: fundamentos, técnicas e aplicações. 6.ed. São
Paulo: Atlas, 2009. 178p.
VALADARES FILHO, S.C. et al. Calculation of nutritional
requirements and formulation of diets. Available from:
<http//:www.brcorte.ufv.br>. Accessed: Jan. 01, 2015.
VAZ, F.N. et al. Feedlot performance of young steers of different
genetic groups Fabiano. Revista Ciência Agronômica, v.44,