(Annals of the Brazilian Academy of Sciences)
Printed version ISSN 0001-3765 / Online version ISSN 1678-2690
www.scielo.br/aabc
Use of the correlation between input variables in estimating the risk of feedlot finishing of steers and young steers
PAULO S. PACHECO1, JOÃO RESTLE2, LEONIR L. PASCOAL1, FABIANO N. VAZ3, RICARDO Z. VAZ4, KAROLINE G. VALENÇA1 and JANAINE L. OLEGARIO1
1Departamento de Zootecnia, Universidade Federal de Santa Maria, 1000, Camobi, 97105-900 Santa Maria, RS, Brasil 2
Escola de Veterinária e Zootecnia, Universidade Federal de Santa Maria, Campus Samambaia, Rodovia Goiânia-Nova Veneza, Caixa Postal 131, 74001-970 Goiânia, GO, Brasil 3
Departamento de Extensão Rural, Universidade Federal de Santa Maria, 1000, Camobi, 97105-900 Santa Maria, RS, Brasil 4Departamento de Zootecnia, Universidade Federal de Pelotas, Rua Gomes Carneiro, 1, Centro, 96010-640 Pelotas, RS, Brasil
Manuscript received on August 2, 2012; accepted for publication on September 2, 2013
ABSTRACT
The objective of this study was to evaluate the risk of feedlot finishing of steers (22.8 months) and young steers (15.2 months), using or not a correlation between the random input variables (data collected from 2004 to 2010) in the simulation of the Net Present Value (NPV) financial indicator. The animals were fed a diet containing roughage:concentrate ratio of 60:40 for 34 and 143 days, respectively, until they had reached a predetermined slaughter weight of 430 kg. For the NPV simulation, Latin Hypercube sampling was used, with 2000 interactions. The stochastic dominance analysis, test of differences between pairs of curves of cumulative distributions and sensitivity analysis were carried out. The NPV simulation using the correlation resulted in the best option for risk estimate. The confinement of young steers was the alternative of investment most viable than confinement of steers (NPV ≥ 0 of 80.4 vs. 62.3% in the simulation with correlation, respectively). Sensitivity analysis determined the following items had the greatest impact on the estimate of NPV: prices of fat and thin cattle, initial and final weights, diet costs, minimum rate of attractiveness and diet intake.
Key words: investment analysis, investment projects, Monte Carlo simulation, nonparametric statistics, probabilistic analysis, production of young bulls.
Correspondence to: Paulo Santana Pacheco E-mail: [email protected]
INTRODUCTION
Among the alternatives used for finishing of beef cattle, the use of feedlot represents an interesting option because of its direct and indirect benefits to the production system as a whole. In Brazil, according to Anualpec (2011) estimates, in 2011 2.73 million cattle were confined to feedlots, characterized by Millen et al. (2009) as being
predominantly bulls, zebu breed, with initial age between 24 and 27 months, with a feeding period between 74 and 83 days and a slaughter weight between 488 and 500 kg of body weight (BW).
However, in the southern region, there is
a predominance of european breeds, as well
age, or yearling - slaughtered at about 14 to16 months of age. Considering that the carcasses present minimum weight (over 180 kg BW) and minimum backfat thickness (over 3 mm), there is no restriction concerning the slaughter age, on the contrary, there are benefits especially regarding the tenderness of the meat, which is significantly improved in younger animals, as shown by Vaz et al. (1999).
What happens when the slaughter age is reduced is the intensification of the production system, requiring an increase to some degree of invested resources. Due to its elevated costs, feedlot
requires the utmost care not only in technical, but
also in economic efficiency. Thus, techniques aiming to predict the viability of the investment, as well as statistics related to the risk/uncertainty are fundamental, shedding light on decision making.
One of such techniques is the stochastic
simulation, using Monte Carlo (most common) or Latin Hypercube sampling. This allows predicting all possible values of an output variable, considering
the probability distributions of random input
variables (Mun, 2006). These values are nothing more than the quantification of risk. Studies of Wall (1997) and Yang (2005) have demostrated that the
consideration of dependency between these input
variables in the simulation results in significant changes in the risk estimate being able to over or underestimate it. However, these evidences have not yet been evaluated in finishing systems for feedlot cattle.
The objective of this study was to evaluate the
effect of using or not the correlation between the random input variables, in the quantification of risk simulated for the financial indicator Net Present Value, of finishing feedlot steers and yearling, slaughtered at similar weight.
MATERIALS AND METHODS
The experiment was conducted at the Department of Animal Science of the Universidade Federal de
Santa Maria, Rio Grande do Sul - Brazil (29° 43' south latitude and 53° 42' west longitude).
A total of 24 castrated animals from the same
experimental herd, coming from the third generation of Charolais x Nellore rotational crossbreeding were used.
Treatments consisted of two categories: steer (characterized by animals slaughtered aged from 20 to24 months of age) and young steers (characterized by animals slaughtered from 12 to16 months of age). The average age at the end of the experimental period was of 22.8 months for the steers and 15.2 months for the young steers.
Additionally, for each treatment, it was evaluated whether or not the correlation between the input random variable, should be used in the simulation
of the financial indicator.
The feedlot confinement of these animals started in August and the sale occurred as the animals reached a previously established slaughter weight of 430 kg. Thus, the total feedlot period
was 34 and 143 days, respectively, for steers
(slaughtered at 431.3 kg BW) and young steers (slaughtered at 434.8 kg BW). The carcasses had an average subcutaneous fat thickness of 3.2 and 6.3 mm, respectively, within the limits suggested by the slaughterhouse industry (between 3 and 6 mm).
The diet was calculated according to NRC (1996), containing 10.25% of crude protein (CP) and 3.18 Mcal of digestible energy/kg of dry matter (DM). The roughage: concentrate ratio used was 60:40, Dry matter content in the diet was 60% of corn silage (46.5% of grains in silage mass), 28.24% of wheat bran, 10.07% of milled sorghum grain, 0.17% of urea (45-00-00), 1.02% of limestone, 0.48% of NaCl and 0.0128% of ionophore (Rumensin®). The animals were fed
twice daily (8 a.m. and 5 p.m.).
The costs and revenues were estimated for
Grande do Sul (RS) in the 6 year period from 2004 to 2010 were used (Conab 2010, Anualpec 2011).
The total cost amounted to the sum of
depreciations (facilities, machinery, implements and equipment), purchase of the ‘thin’ animal, sanitary control, feeding (roughage and concentrate), labour and other operational expenses. Gross revenue consisted in the sale of the fat animal.
Facilities, machinery, implements and equipments depreciation were calculated for a
planning horizon of one year. Facilities costs were estimated for fixed capacity of 1,000 animals.
To calculate the production costs of corn
silage, the yield of 34.7 tons of green matter/ha and DM content of 39.05% was considered. Details on the items that comprise the costs of silage making are included in Pacheco et al. (2006).
For cost estimates of labour, was considered
1 man hired/300 feedlot cattle and three minimum wages/month/1,000 animals for technical assistance. In this calculation, two months were added to the feeding period for preparation/maintenance of the facilities and other activities.
Other operational expenses such as main-tenance of facilities, machinery, implements and
equipment, fuel, electricity, freight, taxes and meals for workers/human resources were estimated for the equivalent of 2.5% of operating costs.
The financial indicator used to assess the
economic feasibility was the Net Present Value
(NPV, R$/animal) =
n
∑
valuesi (1 + rate)i i=1, where: values =
values of Cash Flow (representing the payments
and income); n=number of cash flows; and rate=discount rate (% per month).
For this purpose, cash flows have been prepared with a planning horizon of one year (Resende Filho et al. 2001), each treatment, with
or without correlation between the input variables,
was considered as a separate investment project.
The risk assessment considered the methods of stochastic simulation, stochastic dominance and
sensitivity, with the aid of Microsoft Excel®, @ Risk® and SAS System® softwares.
Initially the cost items of each year were deflated by the IGP-FGV (General Price Index Fundação Getulio Vargas - Anualpec 2011) for the year of 2010. Afterwards the type of probability distribution (Anderson-Darling statistic) of the following cost items, revenue and performance variables of the animals were determined: thin and fat cattle (R$/kg), minimum wage (R$/month), roughage (R$/kg DM), concentrate (R$/kg DM), facilities/equipment (R$/animal/day), machinery/ implements (R$/animal/day), health/vaccine (R$/ dose), health/deworming (R$/mL), initial and final weights (kg), average daily weight gain (kg), total weight gain (kg), roughage and concentrate intake (kg DM/day) and minimum rate of attractiveness (% per month).
In the simulation of the NPV, Latin Hypercube sampling was used, random generator number Mersenne Twister, with 2000 interactions (Albright et al. 2010, Palisade 2010). For each category, this
analysis was performed either with or without the Spearman correlation between the cost items that
had their probability distribution determined (input variables) (Table I).
For the evaluation of stochastic dominance,
the criteria of first and second order (Hadar and Russell 1969) were considered, in the
comparison of the cumulative probability
distributions of the simulated NPVs (categories with or without correlation). In the criterion of
stochastic dominance of first order, there are selected investments for investors who prefer
a higher return investment, and the stochastic
dominance of second-order, are selected
investments for investors who prefer a higher return and either are averse to the risk. After this
analysis, the verification of differences between pairs of cumulative distributions was carried out
For sensitivity analysis, the stepwise
multi-variate regression method was used (Palisade 2010), aiming to identify the input variables with greatest influence on the NPV.
RESULTS
Table II shows that the means for NPV were positive for both categories, however, with higher values for the young steers in the order of 1.4 times.
The lowest estimate of risk was also evident for this
category in relation to the steers, according to the values of standard deviations - SD (or coefficients of variation - CV). Furthermore, the young steers
displayed the lowest minimum values, this statistic may be used as an additional criterion in decision
making, where in this study, lower minimum values
indicate a lower risk by the possibility of lower
occurrence of negative values. Items1
1 2 3 4 5 6 7 8 9
1 0.89** 0.68+ 0.64 0.29 0.18 -0.32 0.21 0.39
2 0.96** 0.82* 0.32 0.07 0.57 -0.64 -0.11 0.14
3 0.67+ 0.79* -0.11 -0.18 0.71 -0.64 -0.21 -0.14
4 0.64 0.46 -0.11 0.64 -0.50 0.29 0.43 0.61
5 0.29 0.11 -0.18 0.64 -0.32 0.43 0.04 0.54
6 0.18 0.39 0.71+ -0.50 -0.32 -0.75* -0.75* -0.57
7 -0.32 -0.46 -0.64 0.29 0.43 -0.75* 0.36 0.18
8 0.21 0.07 -0.21 0.43 0.04 -0.75* 0.36 0.75*
9 0.39 0.21 -0.14 0.61 0.53 -0.57 0.18 0.75*
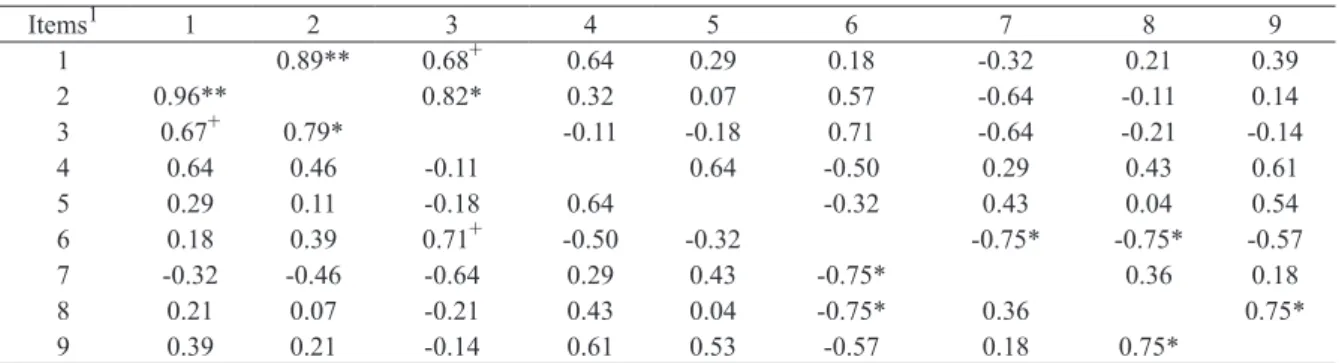
TABLE I
Spearman correlation coefficients between the items of cost for the categories: steer (below the diagonal) and young steer (above the diagonal).
1 1 Thin cattle (R$/kg), 2 Fat cattle (R$/kg), 3 Minimum wage (R$/month), 4 Roughage (R$/kg DM), 5 Concentrate
(R$/kg DM), 6 Facilities/Equipment (R$/animal/day), 7 Machinery/implements (R$/animal/day), 8 Health/vaccine (R$/dose), 9 Health/deworming (R$/mL).
R$ = .54 US$.
** P< .01. * P< .05. + P< .10.
Statistics
Category Category
Young steers Steers Young steers Steers
With correlation Without correlation
Minimum (R$) -284.18 -453.64 -445.60 -850.10
Maximum (R$) 528.03 462.28 584.04 872.00
Mean (R$) 100.22 41.86 100.32 42.33
SD (R$) 119.44 143.34 209.00 332.03
CV (%) 119.18 342.43 208.33 784.38
NPV ≥ 0 (%) 80.4 62.3 68.6 55.5
TABLE II
Statistics of Net Present Value (NPV, R$/animal) simulated with or without correlation between the input variables, according to the category.
Analyzing the estimates with and without
correlation, discrepant expressive values for the
same category. Using the correlation between
the input variables in the simulation of the NPV,
in the young steers, the observed reduction in the estimated values was of 36% for minimum value, 10% for maximum value and 43% for SD or CV. While for the steers, the reduction was even greater (47, 47 and 57% respectively), comparatively to simulation without the use of correlation.
Considering that an NPV of zero indicates that
the investment recovers the initial cost and also pays this cost if it had been applied to the discount
rate, the estimated probability of the NPV greater
than or equal to zero is very important in decision of investments or not in an project, as it serves both
types of investors: the most and the least averse to risk. Again, using the correlation provided significant changes, improving the perception of risk, in this case, lower for young steers in relation to steers. The finishing of young steers using the
correlation between the input variables was the
most viable alternative, with the greatest likelihood of economic viability (NPV ≥ 0 of 80.4%), while the finishing of steers without the use of the correlation was the worst alternative (NPV ≥ 0
55.5%), considering the occurrence of only one period of feedlot confinement in the year.
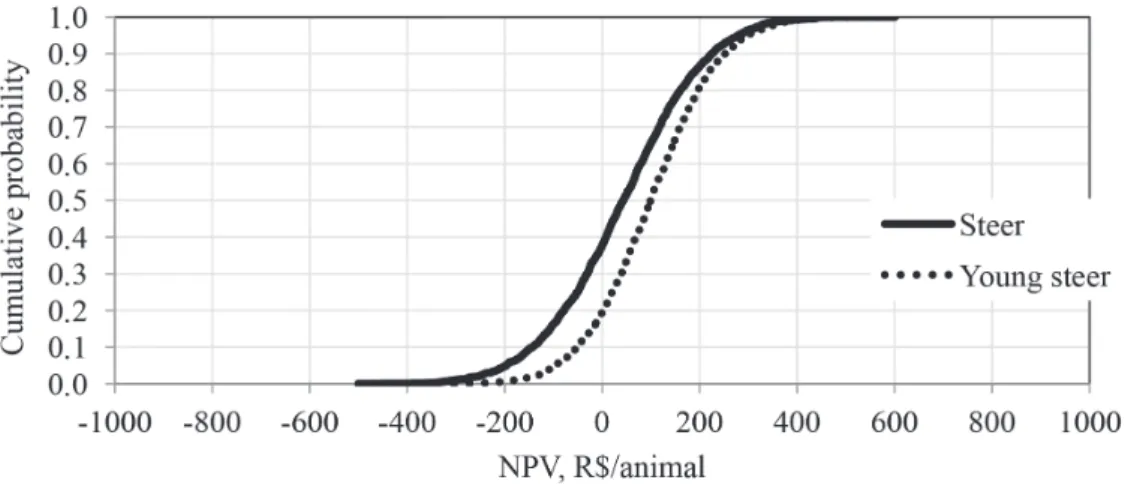
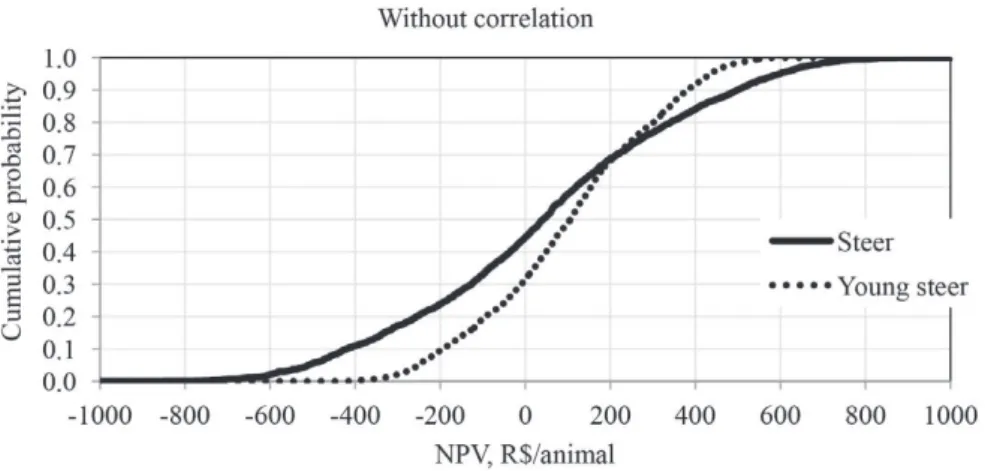
According to distributions of cumulative
probability of the NPV with and without
corre-lation between the input variables (Fig. 1 and Fig 2, respectively) and the Kolmogorov-Smirnov asymptotic test (Table III) of the comparison between the curves, the young steers dominated in first-order (P < .0001) the steers when the
correlation was included in the simulation, and
in second-order (P< .0001) without the inclusion of correlation, graphically and statistically confirming the feedlot of young steers as the best investment option.
In Figure 2, higher range of values of NPV for both categories, and consequently, the higher risk involved, was verified without use of the correlation.
The sensitivity analysis with or without
corre-lation (Tables IV and V, respectively), shows that
the prices of fat and thin cattle were the most
important items to influence on the NPV, followed by final and initial weights. The cost of the diet (roughage and concentrate), discount rate and diet
intake were items ranked from 5th to 9th place in
relation to their impact on the financial indicator.
These nine items were common to both simulations
Figure 1 - Distribution of cumulative probability of the Net Present Value (R$/animal) simulated, with
Figure 2 - Distribution of cumulative probability of the Net Present Value (R$/animal) simulated,
without correlation between the input variables, according to the category (R$ = .54 US$).
Category Category
Category Young steers Steers Young steers Steers
With correlation Without correlation
Young steers - F - S
Steers >*** - >***
-TABLE III
Stochastic dominance (F, S and >) and Kolmogorov-Smirnov asymptotic test of the comparison of the pairs of probability distributions of the categories, with or without
correlation between the input variables for the simulated Net Present Value.
F: first-order stochastic dominance. S: second-order stochastic dominance. >: treatment in the column dominates treatment in the line.
*** P< .001.
Input variables Category
Young steers Steers
Fat cattle, R$/kg 1.140 (1) 1.589 (1)
Thin cattle, R$/kg -1.122 (2) -1.533 (2)
Final weight, kg 0.488 (3) 0.703 (3)
Initial weight, kg -0.387 (4) -0.600 (4)
Roughage, R$/kg DM -0.144 (6) -0.070 (5)
Concentrate, R$/kg DM -0.247 (5) -0.054 (6)
Machinery/implements, R$/animal/day -
-Facilities/equipment, R$/animal/day -0.027 (11) -0.027 (10)
Health/deworming, R$ -
-Health/vaccine, R$ -
-Minimum wage, R$/month -0.031 (10)
-Discount rate, a month -0.104 (7) -0.041 (7)
Concentrate intake, kg DM/day -0.050 (8) -0.028 (9)
Roughage intake, kg DM/day -0.048 (9) -0.034 (8)
R-square 0.990 0.966
TABLE IV
Regression coefficients1 and ranking (in parenthesis) of the variables of greater relevance to the Net Present Value simulated, without correlation between the input variables, according to the category.
R$ = .54 US$.
1 standardized multivariate regression coefficient, which indicates the number of standard deviations of the NPV that will change
(with and without correlation), as well as for both categories. The costs with health, machinery/ implements, and facilities/equipment varied in the
different simulations, with less relevance when the
correlation was included in the analysis.
DISCUSSION
The use of stochastic simulation represents a tool
of great value for decision making in the evaluation of investment projects. As shown in Table II, the estimated statistics allow assessing the best option for beef cattle finishing in feedlot, considering two categories representing intensive and super
intensive systems of beef cattle production, also
known as two and one-year systems, respectively. Here, it is worth noting that only the direct benefit of feedlot on the financial return simulated by the
NPV indicator was evaluated, this is because there
is a possibility, according to (Vaz et al. 1999), of indirect benefits from this finishing system for production system as a whole.
Furthermore, the inclusion or not of the corre-lation between input variables, allow to evaluate
the importance of the simulation modelling, consi-dering the expressive changes in risk prediction, as measured mainly by SD (or CV) and in a
complementary manner by the minimum and
maximum values.
The estimated values for NPV ≥ 0 in this study for the steer category and using the
corre-lation between the input variables exceeded
those verified by Simões et al. (2006) (72% for termination), these evaluated stages of the production system (reproduction, growing and finishing). Regardless, it can be stated that this finishing system is of high risk, by examining the values of coefficients of variation.
In Table III and Fig 1 and 2, the benefit of using
the correlation between the input variables in the stochastic simulation and stochastic dominance may
be confirmed, where in the present study, its omission resulted in overestimated risk. In both categories the
simulation pointed to positive average NPV, i.e., finishing steers or young steers results in economic benefit. However, the possibility to verify the risk associated with the estimate of the average NPV is
important information for decision makers, both for
the more or the less averse to risk. For finishing of young steers, the uncertainty were lower.
The observation of the distribution curves of cumulative probability allow to characterize them
as to associate risk, through rules of stochastic dominance (Hadar and Russell 1969), being also an important fact when it comes to decision making. Assessing the risk of the finishing in feedlot of beef
cattle in three different systems, Resende Filho et
al. (2001) found that a cattle breeder more averse to risk would opt for the fattening of animals only once a year (beginning of July) since the simulated maximum loss was the lowest. As for the less averse to risk, the strategy of feedlot with two cicles in the year (beginning of July and October)
would be the best option because it presents a
higher maximum gain. The same authors worked with strategies for finishing of bovines using the
Monte Carlo simulation with the use of correlation between random variables only, in the estimation of
economic viability. However, no studies were found
in the literature that compared the use or not of the correlation between input variables in the stochastic
simulation and its reflection to the financial indicator, in the feedlot finishing of beef cattle. In some books (Mun 2006, Albright et al. 2010, Palisade 2010), the authors didactically present
simulations with various scenarios of correlation
(e.g., positive correlation, null or negative), verifying that the means remained relatively stable, while the risk reduced or increased, alerting to the incorporation of the correlation in the simulation.
In more detailed studies, however in the building/construction area, there is confirmation
of the importance of the use of correlation by
(Monte Carlo method) in cost analysis, Wall (1997)
compared different types of distribution of random input variables and inclusion or not of the correlation
between them, verifying that the inclusion of
correlations was more important than the choice
of the distribution (in this case, lognormal or beta). Also using the Monte Carlo simulation, Yang (2005) verified that the impact of the correlations was significant, and when not included, resulted in
an increase in SD and underestimation of the unit
cost of the project.
Although with short supply period (34 days), the feeding of steers represented alternative of
increased risk, that is, increased likelihood of
occurrence of financial loss when compared to the young steers that remained for a period in average 4.2 times longer in feeding. Studies evaluating the risk of feedlot finishing of cattle from different categories were not found in the literature, however, some authors asserting that the greater the time spent in feedlot, the greater the possibility of reducing the financial return (Restle et al. 2007, Ferreira et al.
2009), which was not observed in this study. Ferreira et al. (2004) evaluated the technical and economic performance in feedlot of cattle of different genetic groups and slaughter ages and verified that despite the young steers having presented high average daily weight gain, they were less economically efficient in relation to the steers, a fact attributed to the greater period of feeding for the first ones, since the cost with feeding represented 80% of the total variable operational cost.
It turns out that when considering several
factors in the variation of the economic response
(output variable) their quantification enables more secure conclusions. This can be solved by the sensitivity analysis (Tables IV and V), enabling therefore the ranking of items of larger impact on the financial indicator in question. Thus, in the present study, the marketing prices of the animal (purchase and sale) were the items that most influenced the NPV, regardless of the simulation including or not the correlation between the input variables, exceeding the factor time of feeding.
Input variables Category
Young steers Steers
Fat cattle, R$/kg 0.651 (1) 0.672 (1)
Thin cattle, R$/kg -0.637 (2) -0.644 (2)
Final weight, kg 0.275 (3) 0.303 (3)
Initial weight, kg -0.220 (4) -0.257 (4)
Roughage, R$/kg DM -0.080 (6) -0.017 (7)
Concentrate, R$/kg DM -0.143 (5) -0.027 (5)
Machinery/implements, R$/animal/day -0.009 (12) -0.006 (11)
Facilities/equipment, R$/animal/day -0.010 (11) -0.006 (10)
Health/deworming, R$ - -0.005 (12)
Health/vaccine, R$ -
-Minimum wage, R$/month -0.019 (10) -0.004 (13)
Discount rate, a month -0.054 (7) -0.019 (6)
Concentrate intake, kg DM/day -0.025 (9) -0.013 (8)
Roughage intake, kg DM/day -0.026 (8) -0.013 (9)
R-square 0.997 0.994
R$ = .54 US$.
1 standardized multivariate regression coefficient, which indicates the number of standard deviations of the NPV that will change
with each change of one standard deviation in the input variables (assuming as constants all the other input variables).
TABLE V Regression coefficients1
The greatest risk associated with the termi-nation of steers compared to the young steers was the result, in a greater degree, of highest oscillation (between the years of 2004 and 2010) of the price of fat cattle for the steers (CV = 15.6 vs. 9.8%, respectively), since the mean (deflated) was very similar (R$ 3.05/kg vs. R$ 3.04/kg, respectively) among the categories. Ferreira et al. (2005) conducted a sensitivity analysis of the gross margin of confined steers and found the items that provided the greatest
impact were the purchase price of the animals and
the sale price of meat. In addition, genetic groups with higher initial weight (Nellore and Brangus - steers) were economically more efficient, in the
unfavourable market conditions, characterized by
low meat prices and increased price for supplies. The Nellore weaned group (yearling) was economically less efficient even under the most favourable market conditions, characterized by the high price of meat and low price of supplies.
This information is very interesting because it indicates that in the marketing strategy, the choice
of the period of the year in which those animals must be sold is important, and that, moreover, those in which historically the variation in price is smaller
should be prioritized. Another suggestion pointed out by Lopes et al. (2011) is highly relevant, which
addresses the use of contracts on the BM&F –
Commodity Exchanges & Futures - and fixed-term contracts with the meatpacking industry as the main marketing options that would avoid speculation regarding the purchase/sale of animals reducing
the uncertainty of price formation in the physical
market and price fluctuations.
It can be considered that the presented
sensitivity analysis demonstrates the importance
of technical efficiency on the economic response, when considering the feedlot as technology to be applied in a finishing system.
The simulation of the Net Present Value
- NPV using the correlation between the input
variables resulted in improved risk estimation,
being therefore, the best option of simulation, than simulation without correlation. The reduction in slaughter age characterized by the finishing of young steers was the most viable investment alternative when compared to finishing of steers, as estimates of the financial indicator, according to the simulation and stochastic dominance criteria. The
sensitivity analysis enabled the most important items in the estimate of the NPV, and therefore in
the viability of the investment to be identified, being
the most important ones the price of fat and thin
cattle, final and initial weights, diet costs, minimum rate of attractiveness and diet intake.
RESUMO
Objetivou-se com esse estudo avaliar o risco da terminação em confinamento de novilhos jovens (22,8 meses) ou superjovens (15,2 meses), utilizando ou não correlação entre variáveis de entrada aleatórias (dados coletados de 2004 a 2010) na simulação do indicador financeiro Valor Presente Líquido (VPL). Os animais foram alimentados com dieta contendo relação volumoso:concentrado de 60:40 por 34 e 143 dias, respectivamente, até atingirem peso de abate previamente estabelecido de 430 kg. Para simulação do VPL, utilizou-se o tipo de amostragem Latin Hypercube, com 2000 interações. Procedeu-se análise de dominância estocástica, teste de diferenças entre pares de curvas de distribuições acumuladas e análise de sensibilidade. A simulação do VPL com uso da correlação resultou na melhor opção para estimativa do risco. A terminação de novilhos superjovens foi alternativa de investimento mais viável, comparativamente aos jovens (VPL ≥ 0 de 80,4 vs. 62,3% na simulação com correlação, respectivamente). A análise de sensibilidade determinou os seguintes itens de maior impacto na estimativa do VPL: cotações do boi gordo e magro, pesos final e inicial, custos com dieta, taxa mínima de atratividade e consumo da dieta.
REFERENCES
ALBRIGHT SC, WINSTON WL AND ZAPPE CJ. 2010. Data analysis and decision making, 4th ed., South-Western
College Pub, Mason, Ohio, USA, 1080 p.
ANUALPEC 2011. Anuário da pecuária brasileira, Informa
Economics FNP, São Paulo, SP, Brasil, 378 p.
CONAB – COMPANHIA NACIONAL DE ABASTECIMENTO. 2010.
Custos de produção agrícola: a metodologia da Conab, Conab, Brasília, DF, Brasil, 60 p.
CONOVER WJ1999. Practical nonparametric statistics, 3rd ed., Wiley, New York, USA, 592 p.
FERREIRA IC, SILVA MA, BARBOSA FA, CARVALHO ADF,
CORREA GSS, FRIDRICH AB AND SOUZA JER. 2009.
Avaliação técnica e econômica de diferentes grupos genéticos de bovinos de corte machos superprecoces e do sistema de produção em confinamento. Arq Bras Med Vet Zoo 61: 243-250.
FERREIRA IC, SILVA MA, REIS RP, EUCLIDES FILHO K AND
FIGUEIREDO GR. 2005. Análise de custos de diferentes grupos genéticos de bovinos de corte terminados em confinamento. Arq Bras Med Vet Zoo 56: 385-391. FERREIRA IC, SILVA MA, REIS RP, EUCLIDES FILHO K,
FIGUEIREDO GR, FRIDRICH AB, CORRÊA GSS, VALENTE
BD AND FELIPE-SILVA AS. 2005. Análise de sensibilidade da margem bruta da receita e dos custos do confinamento de diferentes grupos genéticos. Arq Bras Med Vet Zoo 57: 93-103.
HADAR J AND RUSSELL WR. 1969. Rules for ordering uncertain prospects. Am Econ Rev 59: 25-34.
LOPES LS, LADEIRA MM, MACHADO NETO OR, SILVEIRA
ARMC, REIS RP AND CAMPOS FR. 2011. Viabilidade econômica da terminação de novilhos Nelore e Red Norte em confinamento na região de Lavras-MG. Cienc Agrotec 35: 774-780.
MATSUNAGA M, BEMELMANS PF, TOLEDO PEN, DULLEY RD,
OKAWA H AND PEDROSO IA. 1976. Metodologia de custo utilizada pelo IEA. Agric S Paulo 23: 123-139.
MILLEN DD, PACHECO RDL, ARRIGONI MDB, GALYEAN ML AND VASCONCELOS JT. 2009. A snapshot of management
practices and nutritional recommendations used by feedlot nutritionists in Brazil. J Anim Sci 87: 3427-3439.
MUN J. 2006. Modeling risk: Applying Monte Carlo simulation,
real options analysis, forecasting, and optimization techniques, John Wiley & Sons, Inc., Hoboken, New Jersey, USA, 624 p.
NRC - NATIONAL RESEARCH COUNCIL. 1996. Nutrient requirements of beef cattle, 7th revised ed., National Academy Press, Washington DC, USA, 242 p.
PACHECO PS, RESTLE J, VAZ FN, FREITAS AK, PADUA JT,
NEUMANN M AND ARBOITTE MZ. 2006. Avaliação econômica da terminação em confinamento de novilhos jovens e superjovens de diferentes grupos genéticos. Rev Bras Zootecn 35: 309-320.
PALISADE. 2010. @RISK: Risk analysis and simulation add-in for Microsoft® Excel, Palisade Corporation, Newfield, NY, USA, 693 p.
RESENDE FILHO MA, BRAGA MJ AND RODRIGUES RV. 2001.
Sistemas de terminação em confinamento: perspectivas para dinamização da cadeia produtiva da carne bovina em Minas Gerais. Rev Bras Econ 55: 107-131.
RESTLE J, PACHECO PS, COSTA EC, FREITAS AK, VAZ FN,
BRONDANI IL AND FERNANDES JJR. 2007. Apreciação econômica da terminação em confinamento de novilhos Red Angus superjovens abatidos com diferentes pesos. Rev Bras Zootecn 36: 978-986.
SIMÕES ARP, MOURA AD AND ROCHA DT. 2006. Avaliação econômica comparativa de sistemas de produção de gado de corte sob condições de risco no Mato Grosso do Sul. Rev Econ Agroneg 5: 51-72.
VAZ FN, VAZ RZ AND BERNARDES RAC. 1999. Viabilidade econômica do confinamento no Rio Grande do Sul. In: RESTLE J (Coord), Confinamento, pastagens e suplementação para produção de bovinos de corte. Santa Maria: UFSM, Santa Maria, Brasil, p. 147-177.
WALL DM. 1997. Distributions and correlations in Monte-Carlo simulation. Construct Manage Econ 15: 241-258. YANG IT. 2005. Simulation-based estimation for correlated