Vol.57, n.6: pp. 916-926, November-December 2014 http://dx.doi.org/10.1590/S1516-8913201402549
ISSN 1516-8913 Printed in Brazil
BRAZILIAN ARCHIVES OF BIOLOGY AND TECHNOLOGY
A N I N T E R N A T I O N A L J O U R N A L
Genetic Diversity of Some Capparis L. Species Growing in
Syria
Bassam Al- Safadi
*Hussam Faouri, and Rana Elias
Department of Molecular Biology and Biotechnology; Atomic Energy Commission of Syria; Damascus - Syria
ABSTRACT
This work investigated the genetic diversity and relationships among Capparis species growing in Syria using IRAP and ISSR techniques. Forty-seven samples of three Capparis species genotypes were collected from 21 different locations in Syria. The genotypes were morphologically identified based on the descriptions available in the literature. When IRAP technique was used, an average of 71.5% of the amplified fragments were polymorphic compared to 82.04% in ISSR. Morphological characterization along with the cluster and PCoA analyses of the data divided the studied genotypes into three groups. The groups included genotypes identified as Capparis spinosa L, C. sicula Duh., and C. aegyptia Lam. Based on the morphological description, molecular studies and statistical analyses of this study, C. aegyptia could be suggested as a separate species and not a varietal rank of C. spinosa (C. spinosa var. aegyptia (Lam.). Two samples (Alep1 and Idl) were not placed in any of the three distinctive groups, despite their closeness morphologically to C. spinosa. In PCoA analysis, sample Alep1 came between C. sicula and C. spinosa and Idl was placed between C. sicula and C. aegyptia. Although hybridization between Capparis species could occur, it was not clear from the present study if these two genotypes were hybrids.
Key words: Capparis, Diversity, ISSR, IRAP, Syria
*Author for correspondence:ascientific@aec.org.sy
INTRODUCTION
Capparis L. is a genus belonging to the
Capparaceae (Capparidaceae). It is distributed in the subtropical and tropical regions of the world (Raja et al. 2013) and grows widely in the Mediterranean and Western Asia. It is believed to include more than 250 species (Jacobs 1965; Fici 1993). Zohary (1960) revised the taxa of Capparis
species, sub-species and varieties of the Mediterranean and Near Eastern countries and divided them into six groups. Two of the groups
(C. spinosa, C. ovata Desf.) were highly variable
with at least six varieties in each group and one group (C. leucophylla DC) was less variable with
only two varieties. The other three groups (C.
cartilaginea Decne, C. mucronifolia Boiss, C.
decidua (Forsk) Edgew) were not variable. Jacobs
(1965) proposed a wider species concept where all
Capparis species of the Mediterranean region
were included in one single species, namely
Capparis spinosa. Later, Higton and Akeroyd
divided C. spinosa into two subspecies: subsp.
spinosa and subsp. rupestris (Sm) Nyman
(Saadaoui et al. 2013). Inocencio et al. 2005; 2006), using molecular analysis, subdivided the genus Capparis into ten species in Central and
Western Asia, North Africa and Europe. Five species have been recorded in the Mediterranean region (C. spinosa L., Capparis sicula Veill,
Capparis aegyptia (Lam.) Boiss, Capparis
orientalis Veill. and Capparis ovata Desf.).
et al. 2001; Reddy et al. 2002; Wang et al. 2005; Kumar et al 2006; Jawdat et al. 2010). Molecular tools provide valuable data on genetic diversity through their ability to detect the variation at the DNA level. Identification is very important in biodiversity studies in many different ways. For evaluation of species diversity, it is essential that individuals can be classified accurately. Several types of molecular markers, including random amplified polymorphic DNA (RAPD), simple sequence repeat (SSR) and inter–simple sequence repeat (ISSR) and amplified fragment length polymorphism (AFLP) have been successfully used for germplasm identification and genetic diversity studies (Qi and Lindhout 1997; Simons et al. 1997; Shan et al. 1999; Wang et al. 2005). The inter-simple sequence repeats (ISSRs), is a technique based on DNA polymerase chain reaction (PCR) method. It uses simple sequence repeat primers to amplify the regions between their target sequences. ISSR marker has been used by many researchers to study genetic diversity in the plants (Reddy et al. 2002; Kumar et al. 2006). This technique has the benefit of discriminating between closely related genotypes (Fang and Roose 1997). Inter-retrotransposon amplified polymorphism (IRAP) technique is also based on DNA polymerase chain reaction (PCR) method and has been exploited to study genetic diversity and phylogeny in many plant genera such as
Citrus (Breto et al. 2001), Spartina (Baumel et al
2002), Musa (Teo et al. 2005), Diospyros (Guo et
al 2006),and Oryza (Branco et al. 2007). Jawdat et
al (2010) used IRAP technique to study the genetic relationship among Eryngium species in Syria.
Despite its medical, nutritional and ecological importance, there have been no molecular studies in Syria that cover all the geographical areas and all the species. Morphological and taxonomical studies are also rare and old (Post 1932; Mouterede 1966; 1984). Most of the previous studies have indicated that only two Capparis
species in Syria (Al-Oudat 2008; Chikhali 2013). These studies concentrated on the distribution and morphological characterization of C. spinosa
without any investigation on the genetic relationships. Babojian (2007) conducted a taxonomic study on C. spinosa in Syria using
morphological characterization in an attempt to classify C. spinosa plants into sub-species.
Inocenio et al. (2006), although not working
specifically on Capparis species in Syria, collected
the samples from some parts of Syria and identified them as C. aegyptia.
This study aimed at investigating the distribution
of Capparis species in Syria and their genetic
relationships using morphological and DNA molecular analysis.
MATERIALS AND METHODS
Plant Material
Seeds, immature fruits, and stem cuttings of the genus Capparis were collected from different
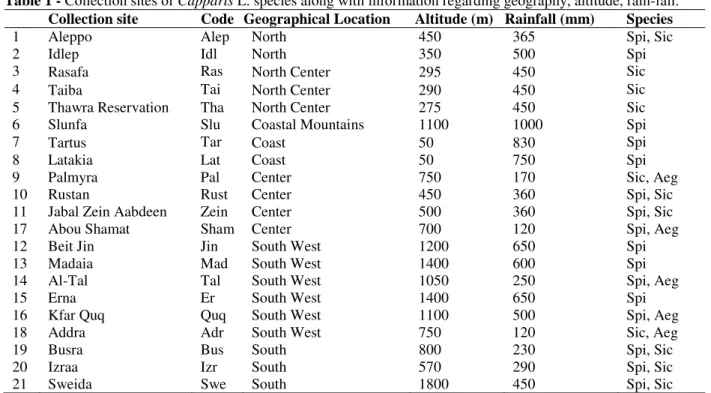
geographical and climatic regions in Syria. A total of 47 samples were collected from 21 different sites, out of which 24 samples were chosen (based on the morphological characteristics) for the molecular study. Collection sites of Capparis L.
species along with information regarding geography, altitude, rainfall are shown in Table 1.
Identification of Plants
The morphological characterization and identification of the plants were based on available literature (Zohary 1973; Inocencio et al 2005; 2006; Danin 2010) and covered the following traits: general shape of the plant (Erect, procumbent, pendulous), leaf shape (ovate or elongated), leaf color (dark green or light green), leaf surface (hairy or glabrous), anther filament color (white or colored), fruit shape (round or elongated), pulp color (red or white), and stem color (light pink or green).
Molecular Analyses DNA extraction
Total genomic DNA was extracted from the leaves of collected Capparis L. DNA extraction was
Table 1 - Collection sites of Capparis L. species along with information regarding geography, altitude, rain-fall.
Collection site Code Geographical Location Altitude (m) Rainfall (mm) Species
1 Aleppo Alep North 450 365 Spi, Sic
2 Idlep Idl North 350 500 Spi
3 Rasafa Ras North Center 295 450 Sic
4 Taiba Tai North Center 290 450 Sic
5 Thawra Reservation Tha North Center 275 450 Sic
6 Slunfa Slu Coastal Mountains 1100 1000 Spi
7 Tartus Tar Coast 50 830 Spi
8 Latakia Lat Coast 50 750 Spi
9 Palmyra Pal Center 750 170 Sic, Aeg
10 Rustan Rust Center 450 360 Spi, Sic
11 Jabal Zein Aabdeen Zein Center 500 360 Spi, Sic
17 Abou Shamat Sham Center 700 120 Spi, Aeg
12 Beit Jin Jin South West 1200 650 Spi
13 Madaia Mad South West 1400 600 Spi
14 Al-Tal Tal South West 1050 250 Spi, Aeg
15 Erna Er South West 1400 650 Spi
16 Kfar Quq Quq South West 1100 500 Spi, Aeg
18 Addra Adr South West 750 120 Sic, Aeg
19 Busra Bus South 800 230 Spi, Sic
20 Izraa Izr South 570 290 Spi, Sic
21 Sweida Swe South 1800 450 Spi, Sic
Inter-Retrotransposon Amplified
Polymorphism (IRAP) Procedure
Eleven IRAP primer combinations (Tables 2) were synthesized using the PolyGen DNA synthesizer (PolyGen DNA-Synthesizer, Germany) and the iCycler PCR machine (BIO-RAD, USA) was used for the amplification of total genomic DNA. The amplification reactions of total genomic DNA were performed in 25µL reaction volume, containing 2.5 µL of 10 X Taq Polymerase
reaction buffer, 2.0µL of 10 mM dNTPs mix, 0.05
µL of 5.0 U/µL Taq DNA polymerase, 3.4 µL of
mg 50 mM, 2.0µL of each of the 50 pmol/µL of
forward and reverse primer and 40 ng DNA.
Table 2 - Primer combinations used for IRAP with
annealing temperature.
No.
Primer Combination Annealing
Temperature °°°°C
1 D26-D26 41.5
2 D26-D27 43.5
3 D16-D17
45.5 4 D18-D19
5 D20-21 6 D22-23 7 D24-25 8 D29-D29 9 D30-D31 10 D32-D32
11 D33-D33 48.5
Inter-simple sequence repeats (ISSR)
procedure
Thirteen ISSR primers (Table3) were used for the amplification of total genomic DNA. The amplification reactions of total genomic DNA were performed in 20 µL reaction volumes, containing 2.5 µL of 10 X Taq polymerase
reaction buffer, including 0.8 µL of 10 mM dNTPs mix, 0.05 µL of 5 U/µL Taq DNA polymerase, 2.5
µL of 10 pmol/µL of each primer, and 25 ng of DNA. For IRAP, fragments were separated on 2.5% agarose and for ISSR, they were separated on 1.5% agarose gels in 1X TAE buffer and stained with ethidium bromide (10 mg/mL).
Table 3- ISSR primers used for the amplification
No. Primer Sequence
1 ISSR-1 (CAC)7 T
2 ISSR-2 (GA)9C
3 ISSR-7 (CA)10G
4 ISSR-8 (CT)9G
5 ISSR-10 (TCC)5
6 ISSR-13 (AG)8 G
7 ISSR-14 (GA)8 T
8 ISSR-15 (GA)8 C
9 ISSR-16 (GA)8 A
10 ISSR-19 (CT)8 T
11 ISSR-22 (GT)8 A
12 ISSR-43 (AC)8 CTA
Data Analysis
IRAP and ISSR bands were transformed into a binary matrix, where the presence of reproducible polymorphic DNA band at a particular position on the gel was manually scored as 1 (present) and 0 (absent). The genetic similarity matrices were constructed using the correlation coefficient. Dendrograms were generated by the un-weighted pair-group method using the correlation similarity measure. Principal coordinate analysis (PCoA) was performed to provide the spatial representation of the relative genetic distances among the individuals and to determine the consistency of differentiation among the populations defined by the cluster analysis. Data analyses were performed using PAST program (Hammer et al. 2001).
RESULTS
Morphological characterization
Capparis L. species investigated in the current
study were characterized using several morphological traits as previously described. Three different Capparis species were identified to
grow in Syria. The species and some of their morphological characters were:
1- C. spinosa L.: Shrubs were erect, and
glabrous; the leaves were dark green and generally ovate large (3-3.5 cm) with glabrous texture somewhat fleshy; the stem was green or colored (mostly light to dark pink). The flowers were large zygomorphic and abaxial sepal was slightly galeat shaped. The fruits were oblong with inner white wall. Stamen filaments were colored (mostly light to dark pink) (Fig. 1A).
2- C. sicula Duh.: Shrubs were procumbent and
gray green, densely covered by white hair on the stems, leaves and buds. Leaves were round to ovate (2-2.3 cm) green with dense pubescence not fleshy (herbaceous). Flowers were zygomorphic but smaller than C. spinosa. Sepal was galeat. The
fruit was obovate to oblong with inner red wall. Filaments were white (Fig. 1B).
3- C. aegyptia Lam.: Shrubs were somewhat erect
(pendulous) glabrous and green or blue-green. Leaves were obovate to ovate and fleshy glabrous (2.3-2.7 cm); adult leaves became later in the season gray to blue thicker and covered with wax. Flowers were slightly zygomorphic similar in size
to C. spinosa or a bit smaller; sepal was slightly
galeat. Fruit was oblong and the pulp was white to yellow. Stamen filaments were colored (mostly light to dark pink) (Fig. 1C).
Figure 1 - Photos showing: A: Capparis spinosa (Beit Jin), B: C sicula (Izraa), C: C. aegyptia
(Abou Shamat area)
Molecular characterization IRAP Data
Eleven primer combinations generated multiple bands from the genomic DNA of all the studied
Capparis L. species (Fig. 2). The banding pattern
of the amplification using IRAP primers is summarized in Table 4. A total of 153 fragments
Table 4 - The banding pattern of IRAP amplification
products. Primer Combination
Total bands
Polymorphic bands
% polymorphism
unique bands
nikita 18 13 72.2 0
sukkula 11 8 72.7 0
D30-D31 9 8 88.8 0
D22-D23 8 7 87.5 0
D26-D27 15 14 93.3 Sweida
(Spi)
D20-D21 16 8 50 0
D26-D26 13 9 69.2 0
D29-D29 17 13 76.4 Latakia
(Spi)
D24-D25 14 9 64.2 0
D16-D17 18 13 72.2 0
D18-D19 15 6 40 0
Total 153 109 71.5 2
Figure 2 - Amplification of genomic DNA for the 24
Capparis samples using IRAP primer combination D29-D29. The arrow indicates a unique band in the sample collected from Latakia using the same primer combination.
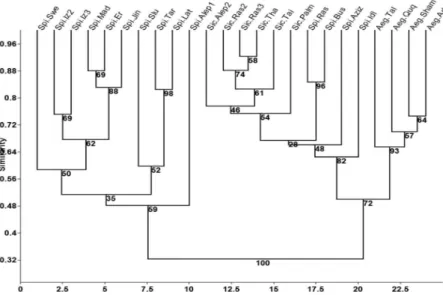
The dendrogram resulting from the cluster analysis of the data showed that the genotypes were separated into two main groups (Fig. 3). The first group was separated into several sub-clusters and included the samples morphologically identified as
C. spinosa, collected mainly from the coastal and
southern regions. The second group was separated into two sub-clusters. The first sub-cluster included the samples identified as C. aegyptia and
the second one included the samples of C. sicula.
ISSR data
The 13 selected ISSR primers produced various numbers of DNA fragments (Fig. 4), depending on their simple sequence repeat motifs (Table 3). In total, 84 fragments were produced, out of which 69 fragments (82.04%) were polymorphic. The number of polymorphic fragments varied from three 8, ISSR-10, ISSR-43) to 11 (ISSR-16) with an average of 5.3 per primer; five unique bands were scored in the samples collected from Sweida, Erna, Taiba (2) and Palmyra (Table 5). The dendrogram resulting from the cluster analysis of the data showed that genotypes were separated into two main groups (Fig. 5). The first group, which in turn was divided into sub-clusters, included only C. spinosa samples collected from
different parts of Syria (similar to those revealed by IRAP). The second group was also divided into two sub-clusters with the first sub-cluster including only C. aegyptia and the other including
all C. sicula samples and two C. spinosa samples.
Figure 3 - Dendrogram of 24 Capparis genotypes generated by the paired group method using
Figure 4 - Amplification of genomic DNA for the 24
Capparis samples using ISSR primer 16 (GA)8 A. The arrow indicates a unique band in the sample collected from Sweida using the same primer.
Table 5 - The banding pattern of ISSR amplification
products.
Primer Total bands
Polymorphic bands
% polymorphism
unique bands
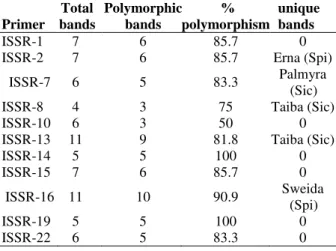
ISSR-1 7 6 85.7 0
ISSR-2 7 6 85.7 Erna (Spi)
ISSR-7 6 5 83.3 Palmyra (Sic)
ISSR-8 4 3 75 Taiba (Sic)
ISSR-10 6 3 50 0
ISSR-13 11 9 81.8 Taiba (Sic)
ISSR-14 5 5 100 0
ISSR-15 7 6 85.7 0
ISSR-16 11 10 90.9 Sweida (Spi)
ISSR-19 5 5 100 0
ISSR-22 6 5 83.3 0
Figure 5 - Dendrogram of 24 Capparis genotypes generated by the paired group method using
correlation matrix, based on data of ISSR. The numbers on the tree branches indicate the percentage of replicates included in a given node calculated out of 1000 bootstrap replicates.
Combined (IRAP and ISSR) data
The data obtained from both the marker techniques were combined. A total of 237 DNA fragments were scored, of which 178 (75.1%) were polymorphic with an average of 7.4 polymorphic fragments per primer. The genetic relationships among the studied genotypes through IRAP and ISSR markers, showed similar dendrograms as obtained from each single technique with some exceptions. However, the general dendrogram constructed using the similarity coefficient values of combined molecular data (IRAP+ISSR) revealed a more realistic representation of the relationship than from the individual markers. The genotypes were grouped into two main clusters (Fig. 6). The first
cluster was divided into sub-clusters, which included C. spinosa samples collected from the
coast-line and coastal mountains (Latakia, Tartus, Slunfa), the mountains of south-west (Erna, Madaia, Beit Jin) and southern region of Syria (Sweida, Izraa). C. spinosa samples collected from
Latakia and Tartus (similar geography and climate) showed a close genetic relationship (0.83) as was revealed by the similarity analysis (data not shown) with very high bootstrap value (96). Genotypes identified as C. sicula were also very
between 275-800 m above the sea level and rain-fall between 170-450 mm.
Genetic similarity analysis among the studied
Capparis species showed that the genotypes
identified as C. aegyptia were genetically much
closer to C. sicula than to C. spinosa. This was
apparent from the dendrogram and similarity coefficient values. Those values ranged from 0.11-0.34 when comparing C. aegyptia values collected
from Addra, Abou Shamat, and Kafr Quq to C.
spinosa collected from Latakia, Tartus, and
Slunfa. On the other hand, the comparison of the
samples of C. sicula with C. aegyptia showed
these values to range from 0.44-0.56. The closest genetic relationship (0.89) was observed between the two C. sicula samples, Ras2 and Ras3
(Rasafa), and the farthest genetic relationship (0.09) was observed between C spinosa (Sweida)
and C aegyptia (Addra).
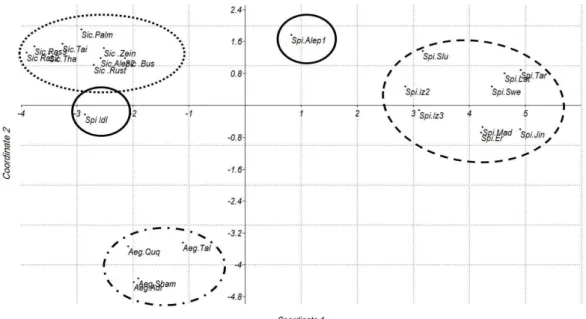
The Principle Coordinate Analysis (PCoA) based on genetic similarity a matrix was used to visualize the genetic relationships among Capparis
genotypes (Fig. 7).
Figure 6 - Dendrogram of 24 Capparis genotypes generated by the paired group method using
correlation matrix, based on combined data of IRAP and ISSR. The numbers on the tree branches indicate the percentage of replicates included in a given node calculated out of 1000 bootstrap replicates.
Figure 7 - Relationships among the Capparis genotypes revealed by principal coordinate analysis
The first coordinate (horizontal axis) accounted for 48.7% of the variation and the second coordinate (vertical axis) accounted for 15.2% of the variation. Three groups were observed: C. sicula
and C. aegyptia appeared on the left side of the
plot, forming two independent groups that were separated by the horizontal axis but close to each other. On the right side of the plot, C. spinosa was
isolated from the other two groups. Two genotypes (Spi Alep1 and Spi Idl) were isolated from the other three major groups. This confirmed the results of cluster analysis where C. spinosa, C.
aegyptia, and C. sicula samples were separated in
three isolated groups.
DISCUSSION
It has become obvious these days that the morphological characterization of plants is not sufficient to make definitive discrimination among the species, sub-species, and verities as morphological markers are influenced by the
environmental conditions and developmental stages, which make their use limited in genetic diversity studies. For example, in Sicily, C.
spinosa showed remarkable variability with regard
to growth forms and other vegetative characters. In typical individuals of C. spinosa observed on clay
soil, each year from renewal buds at or below ground level, only a few fast-growing, multiramified shoots were produced. In contrast, individuals of the same species growing under atypical pedological conditions (rocky habits) usually showed a lignified shoot system like C.
spinosa L.var. intermis Turra (Fici 2001). DNA
molecular markers, on the other hand, are independent of environmental conditions or developmental stage and show high level of polymorphism.
Genetic studies on Capparis in Syria are rare and
limited to one species or limited to one region. This study was the first study on Capparis species,
which covered most of the geographical and ecological areas and the various Capparis species
growing in Syria (Fig. 8).
Figure 8 - Distribution of the three Capparis species found to grow in Syria.
Molecular analysis in this study confirmed the outcomes of morphological and taxonomic analyses done on the collected samples. The combined IRAP and ISSR data were utilized to correlate the genetic makeup with the
morphological description and geographical distribution of Capparis species. The clustering of
dendrogram than IRAP dendrogram due to the higher percentage of polymorphic bands obtained by ISSR was higher than that obtained by IRAP technique (82% vs 71.5%). This made the use of ISSR technique in this study more efficient and more informative than IRAP. This finding was in line with the findings of Bublyk et al. (2013) who investigated the efficiency of different PCR-based marker systems (ISSR, IRAP, REMAP, RGAP and LP-PCR) for the assessment of Iris pumila
genetic diversity and found that ISSR-markers were the most efficient, followed by LP-PCR-markers. A similar result was achieved by Žiarovská et al. (2012) studying variability of
Linum usitatissimum L. using several molecular
marker techniques.
Combining the data of both the techniques was successful in sorting the Capparis genotypes into
three somewhat distinctive groups matching the morphological analysis. Although C. spinosa and
C. sicula were relatively similar morphologically
and had often been confused taxonomically (Inocencio et al. 2005; 2006), careful examination of the plants (especially color of filaments, color of leaves, presence of hair, shape of fruit and color of inside wall) as well as DNA analysis could sort them out. The same could be said with regard to C.
aegyptia, which could be confused visually with
C. spinosa. A recent study on Egyptian taxa of
Capparis and related genera (Capparaceae)
conducted by Moubasher et al. (2011), using RAPD technique revealed that C. spinosa var.
deserti (C. aegyptia), C. spinosa var. canescens
(C. sicula), and C. spinosa var. spinosa were more
related to each other than to C. decidua, and C. sinaica.
Inocencio et al. (2006) reported that C. spinosa
was found rarely in the wild and that most known populations were cultivated and it possessed intermediate morphological characters between C.
orientalis and C. sicula, suggesting that C. spinosa
could be of hybrid origin. In the same study, Inocencio et al. (2006) did not indicate the existence of C. spinosa in Syria. However, several
other studies have reported the existence C.
spinosa in Lebanon and Syria (Post 1932;
Mouterede 1966; 1984; Chalak et al. 2001;
Giuliani and Buerli 2006; Babojian 2007; Al-Oudat 2008; Al-Safadi and Elias 2011; Chikhali 2013). The present study found C. spinosa to grow
commonly in the wild, and in fact it grew in diverse geographical and climatic regions in Syria (Table 1 and Fig. 8). On the other hand, there were
a few places in Syria where C. spinosa was
cultivated (Giuliani 2004).
Previous studies considered C. aegyptia as a
varietal rank of C. spinosa (C. spinosa var.
aegyptia (Lam.) Boiss) (Zohary 1960; 1962;
Boulos 1999; Özbek and Kara. 2013). This was rejected by Danin (2010) who disputed this notion based on the morphological description of the plants and their geographical and climatic distribution. Based on the results of morphological description, molecular studies and statistical analyses of the present study, C. aegyptia, C.
sicula and C. spinosa were considered as separate
species. This was also in line with the findings of Inocenio et al. (2005; 2006) who studied C.
spinosa, C. orientalis, C. ovata, C. aegyptia and C.
sicula using morphological and molecular analyses
and found these to be separate species. They also suggested that C. spinosa might be a hybrid
between C. orientalis and C. sicula.
Capparis orientalis was not found in the present
study. It might, however, exist hence further studies are needed in the future. Two samples (Alep1 and Idl) were not placed in any of the three distinctive groups, despite their closeness morphologically to C. spinosa. In PCoA analysis
(Fig. 7), Alep1 came between C. sicula and C.
spinosa, indicating its close relationship to both of
the species. This was confirmed by the analysis of genetic relationship (correlation’s coefficients) where these values ranged from 0.46-0.57 when comparing Alep1 with C. sicula genotypes and
from 0.42-0.59 when comparing it with C. spinosa
genotypes. The same argument could be extended to Idl where PCoA analysis placed Idl between C.
sicula and C. aegyptia with genetic relationship
coefficient values ranging from 0.63-0.70 when comparing Idl with C. sicula genotypes and from
0.43-0.57 when comparing it with C. aegyptia
genotypes. Although hybridization between
Capparis species might occur (Inocencio et al.
2006), it was not clear from the present study if these two genotypes were hybrids (Alep1 between
C. spinosa with C. sicula, and Idl between C.
sicula with C. aegyptia) or other Capparis species
that were not investigated thoroughly in this study.
CONCLUSIONS
Based on the morphological and molecular study, three Capparis species were identified to grow in
C. aegyptia Lam. There was also a possibility of
the existence of one or two more species due to the fact that two genotypes collected from Aleppo and Idlep were not placed in any of the three distinctive groups of the species. This suggested the necessity to conduced further studies to investigate the existence of these species and perhaps to work at the subspecies level to learn more about these important plants.
ACKNOWLEDGEMENTS
The authors would like to thank the Director General of AECS and the Head of Molecular Biology and Biotechnology Department for their support. We also thank Mr R. Al-Rayan and M. S. Ali for their assistance in collection of samples and lab work. Many thanks are extended to Prof. Silvio Fici for providing some necessary references.
REFERENCES
Al-Oudat M. Capers. In Salt tolerant plants of Syria. AECS publications; 2008. p. 75-80.
Al-Safadi B and Elias R. Improvement of Caper (Capparis spinosa L.) propagation using in vitro culture and gamma irradiation. Sci Hortic. 2011; 127(3): 290-297.
Baumel A, Ainouche M, Kalendar R, Schulman AH. Retrotransposons and Genomic Stability in Populations of the Young Allopolyploid Species Spartina anglica C.E. Hubbard (Poaceae). Mol Biol Evol. 2002; 19: 1218-1227.
Babojian G. Taxonomic Characteristics of Capparis spinosa L. in Syria. Aleppo Uni J Basic Sci. 2007; 52:00.00.
Boulos L. Capparis in: Flora of Egypt, 1. Cairo. 1999. P. 171-173.
Branco CJS, Vieira EA, Malone G, Kopp MM, Malone E, Bernardes A. IRAP and REMAP assessments of genetic similarity in rice. J Appl Genetics. 2007; 48(2): 107-113.
Breto MP, Ruiz C, Pina JÁ, Asins MJ. The diversification of Citrus clemantina Hort. Ex. Tan., a vegetatively propagated crop species. Mol Phylogenet Evol. 2001; 21: 285-293.
Bublyk OM, Andreev IO, Kalendar RN, Spiridonova KV, Kunakh VA. Efficiency of different PCR-based marker systems for assessment of Iris pumila genetic diversity. Biologia. 2013; 68(4): 613-620.
Chalak L, Elbitar A, Cordahi N, Hage C, Chehade A. In vitro propagation of Capparis spinosa L. Acta Hortic. 2001; 616: 335-338.
Chikhali M. Capparidaceae. Flora Syria; 2013, On Line. cited 20 October 2013. Available from www.fsol.net.sy.
Danin A. Capparis in the East Mediterranean countries. Fl Medit. 2010; 20: 179-185.
Faccioli P, Pecchioni N, Stanca AM, and Terzi V. Amplified Fragment Length Polymorphism (AFLP) Markers for Barley Malt Fingerprinting. J Cereal Sci.1999; 29 (3): 257-260.
Fang DQ, and Roose ML. Identification of closely related citrus cultivars with inter-simple sequence repeat markers. Theor Appl Genet. 1997; 95: 408-417.
Fici S. Taxonomic and Chorological notes on the genera Boscia Lam. Cadaba Foressk and Capparis L. (Capparaceae) in Somalia. Webbia.1993; 47(11): 149-162.
Fici S. Intraspecific variation and evolutionary trends in Capparis spinosa L. (Capparaceae). Plant Syst Evol. 2001; 228:123-141.
Giuliani A. The caper in Syria. International Plant Genetic Resources Institute. 2004; http://www.bioversityinternational.org/fileadmin/biov ersity/publications/pdfs/1075.
Giuliani A and Buerli M. Reorganizing the market chain of capers in Syria: a multi-stakeholder process. Rural Development News. 2006; 1:21-25.
Guo D, Zhang H. and Luo Z. Genetic relationships of Diospyros kaki Thunb. and related species revealed by IRAP and REMAP analysis. Plant Sci. 2006; 170:528-533.
Hammer Ø, Harper DAT and Ryan PD. PAST: Paleontological statistics software package for education and data analysis. Palaeontol Electron. 2013; avialabe from http://palaeo-electronica.org/2001_1/past/issue1_01.htm.
Inocencio C, Rivera D, Obon C, Alcaraz F. and Barrena JA. A systematic revision of Capparis section capparis (Capparaceae). Ann Missouri Bot Gard. 2005; 93: 122-149.
Inocencio C, Rivera D, Obón MC, Alcaraz F, Barreña JA. A systematic revision of capparis section capparis (capparaceae). Ann Mo Bot Gard. 2006; 93: 122-149.
Jacobs M. The genus Capparis (Capparaceae) from the Indus to the Pacific. Blumea. 1965; 12(3): 385-541. Jawdat D, Al- Faoury H, Ayyoubi Z and Al-Safadi B.
The distribution and Phylogeny of Eryngium species in Syria. Biologia. 2010; 65 (5)796-804.
Kumar A, Arya L, Kumar V and Sharma S. Inter simple sequence repeat (ISSR) analysis of cytoplasmic male sterile, male fertile lines and hybrids of pearlmillet [Pennisetum glaucum (L.) R.Br.]. Indian J Crop Sci. 2006; 1(1-2): 117-119.
Moubasher H, Abd El-Ghani M, Kamel W, Mansi M, El-Bous M. Taxonomic considerations among and within some Egyptian taxa of Capparis and related genera (Capparaceae) as revealed by RAPD fingerprinting. Collect Bot. 2011; 30:29-35.
Mouterede P. Nouvelle Flore du Liban et de la Syrie. 1966;Vol.1,2,3 text and atlas.
Mouterede P. Nouvelle Flore du Liban et de la Syrie. 1984; Tom I, II, III. Dar el-Machreq ed, Beyrouth, Liban.
Özbek Ö, Kara A. Genetic variation in natural populations of Capparis from Turkey, as revealed by RAPD analysis. Plant Sys Evol. 2013; doi.org/10.1007/s00606-013-0848-0.
Qi X. and Lindhout P. Development of AFLP markers in barley. Mol Gen Genet. 1997; 254, 330-336. Post G. The flora of Syria, Palestine and Sinai. 1932;
American Press, Beirut.
Raja P, Moorthy ND, Kala A, and Soosai Raj S. Extended distribution of Capparis shevaroyensis sund-ragh (capparaceae) an endemic and vulnerable shrub in peninsular India to southern eastern ghats of tamilnaidu. Ind J Fund Appl Life Sci. 2013; 3 (1): 137-140.
Reddy PM, Sarla N, and Siddiq EA. Inter simple sequence repeat (ISSR) polymorphism and its application in plant breeding. Euphytica. 2002;128-2: 9-17.
Saadaoui E, Gómez JJM, and Cervantes E. Intraspecific variability of seed morphology in Capparis spinosa L. Acta Biol Cracov Bot. 2013; 55(2):99-106.
Shan X, Blake TK, Talbert LE. Conversion of AFLP markers to sequence-specific PCR markers in barley and wheat. Theor Appl Genet. 1999; 98: 1072-1078. Wang HZ, Wang YD, Zhou XY, Ying QC, Zheng KL.
Analysis of genetic diversity of 14 species of Cymbidium based on RAPDs and AFLPs. Shi Yan Sheng Wu Xue Bao; 2005, 37(6): 482-486.
Simons G, Van der Lee T, Diergaarde P, van Daelen R, Groenendijk J, Frijters A, et al. AFLP-based fine mapping of the Mlo gene to a 30-kb DNA segment of the barley genome. Genomics. 1997; 15; 44(1):61-70. Teo CH, Tan SH, Ho CL, Farida QZ, Othman YR, Heslop-Harisson JS et. al. Genome constitution and classification using retrotransposon based markers in the orphan crop banana. J Plant Biol. 2005; 48: 96-105.
Žiarovská J, Ražná K, Senková S, Štefúnová V and Bežo M.Variability of Linum usitatissimum L. based on molecular markers. ARPN J Agric Biol Sci. 2012; 7(1): 50-58.
Zohary, M. The species of Capparis in the Mediterranean and the Near Eastern countries. Bulletin of the Research Council of Israel 8D, 1960: 49-64.
Zohary, M. Plant life of Palestine. The Ronald Press Co., New York, USA, 1962; p 262.
Zohary M. Geobotanical foundation of the Middle East. Gustav Fischer Verlag, Stuttgart, Germany, 1973; p 739.