www.ccarevista.ufc.br ISSN 1806-6690
Molecular characterisation and similarity relationships among iranian
basil
(Ocimum basilicum
L.) accessions using inter simple sequence
repeat markers
1Caracterização molecular de acessos de
Ocimum basilicum
L. por meio de
marcadores ISSR
Mohammad Aghaei2, Reza Darvishzadeh3* e Abbas Hassani4
Abstract -The study of genetic relationships is a prerequisite for plant breeding activities as well as for conservation of genetic
resources. In the present study, genetic diversity among 50 Iranian basil(Ocimum basilicum L.) accessions was determined using
inter simple sequence repeat (ISSR) markers. Thirty-eight alleles were generated at 12 ISSR loci. The number of alleles per locus ranged from 1 to 5 with an average of 3.17. The maximum number of alleles was observed at the A7, 818, 825 and 849 loci, and their size ranged from 300 to 2500 bp. A similarity matrix based on Jaccard’s coefficient for all 50 basil accessions gave values from 1.00-0.60. The maximum similarity (1.00) was observed between the “Urmia” and “Shahr-e-Rey II” accessions as well as between the “Urmia” and “Qazvin II” accessions. The lowest similarity (0.60) was observed between the “Tuyserkan I” and “Gom II” accessions. The unweighted pair- group method using arithmetique average UPGMA clustering algorithm classified the studied accessions into three distinct groups. All of the basil accessions, with the exception of “Babol III”, “Ahvaz II”, “Yazd II” and “Ardebil I”, were placed in groups I and II. Leaf colour was a specific characteristic that influenced the clustering of Iranian basil accessions. Because of this relationship, the results of the principal coordinate analysis (PCoA) approximately corresponded to those obtained through cluster analysis. Our results revealed that the geographical distribution of genotypes could not be used as a basis for crossing parents to obtain high heterosis, and therefore, it must be carried out by genetic studies.
Key words - Basil. Cluster analysis. Molecular markers. Plant genetic diversity.
Resumo - O estudo das relações genéticas é um pré-requisito para atividades em reprodução de plantas assim como para
conservação de recursos genéticos. Neste trabalho a diversidade genética entre 50 acessos de Manejericão Iraniano (Ocimum basilicum L.) foram determinadas usando marcadores de Seqüência Simples Repetida Interna (ISSR). Trinta e oito alelos foram
identificados utilizando-se 12 locos ISSR. O número de alelos por lócus variou de 1 a 5 com uma média de 3,17. O máximo número de alelos foi observado em A7; 818; 825 e 849 locos, e seus tamanhos variaram de 300 a 2500 bp. Uma matriz de similaridade baseada no coeficiente de Jaccard para todas as 50 acessos obteve valores de 1,00-0,60. A máxima similaridade (1.00) foi observada nos acessos “Urmia” e “Shahr-e-Rey II” assim como entre os acessos “Urmia” e “Qazvin II”. A menor similaridade (0,60) foi observada entre os acessos “Tuyserkan I” e “Gom II”. O algoritmo de análise de agrupamentos foi o método da distância média usando a média aritmética (UPGMA) que classificou os acessos estudadas em três distintos grupos. Todos os acessos do manjericão com exceção de “Babol III”, “Ahvaz II”, “Yazd II” e “Ardebil I”, foram localizadas nos grupos I e II. A cor da folha foi uma característica específica que influenciou o agrupamento dos acessos do Manjericão Iraniano. Devido a esta relação, os resultados da análise de coordenada principal (PCoA) aproximadamente corresponde à aquela obtida pela análise de agrupamentos. Os resultados revelam que a distribuição geográfica dos genótipos não pode ser usada como base para parentais cruzados com alta heterosis e, portanto devem ser conduzidos estudos genéticos para tais fins.
Palavras-chave -Manjericão. Análise de agrupamentos. Marcadores moleculares. Diversidade genética de plantas.
* Autor para correspondência
1Recebido para publicação em 06/02/2011; aprovado em 10/10/2011
Part of the Masters Thesis of the first author presented at the Graduate Program in Medicinal Plant Production from the Urmia University, Urmia, Iran
Introduction
Ocimum basilicum L., known as common basil,
is an annual aromatic herb belonging to the Lamiaceae family. It is a dicotyledonous and diploid plant with 2n = 48 chromosomes (PRAKASH, 1990). Among
Ocimum spp., common basil is the most economic
species to grow, and it is cultivated all around the
world (MAROTTIet al., 1996). Dried leaves of basil
are used to flavour many products in the food industry. Its essential oil is used in the perfume and cologne, cosmetics, health, pharmaceutical and food industries
(HARISARANRAJet al., 2008).
Based on Khosla’s (1995) reports, the centre of basil diversity is in the tropical and subtropical regions of Africa, Asia and South America. Different chemotypes (plants of the same species that are chemically different but otherwise indistinguishable) and morphotypes have
been reported in this species (MAROTTI et al., 1996;
PRAKASH, 1990).
To be most efficiently managed and effectively utilised, germplasm collections must be well characterised. In most cases, the identification of cultivars, lines and hybrids is based on morphological traits. However, the number of these traits is limited; they are unstable and they do not always enable one to distinguish between
closely related accessions or cultivars (KONAREV et
al., 2000). Cultivar identification based on phenotypic
traits is often influenced by the environment, making classification difficult.
On the other hand, basil taxonomy is complex because of the occurrence of inter-/intra-speci c hybridisation and morphological similitude (DE MASI
et al., 2006). Sometimes, taxonomists defined a number
of designations as synonymous and confused different varieties as homonyms.
The emergence of PCR-based molecular markers, such as randomly amplified polymorphic DNA (RAPDs), microsatellite or simple sequence repeats (SSRs) and amplified fragment length polymorphisms (AFLPs) has created the opportunity for fine-scale genetic characterisation of germplasm
collections (POWELL et al., 1996; SEMAGN et al.,
2006). The major limitations of these methods are the low reproducibility of RAPD, the high cost of AFLP and the need to know the flanking sequences to develop species-specific primers for SSR polymorphism.
The use of inter simple sequence repeat (ISSR-PCR) markers is a molecular technique that overcomes
most of these limitations (PRADEEP REDDYet al.,
2002). It is rapidly being adopted by the research community in various fields of plant improvement
(GODWINet al., 1997; RATNAPARKHEet al., 1998).
This technique is useful in the areas of genetic diversity, phylogenetic studies, gene tagging, genome mapping and evolutionary biology and in a wide range of crop species. ISSR techniques are nearly identical to RAPD techniques except that ISSR primer sequences are designed from microsatellite regions, and the annealing temperatures used are higher than those used for RAPD markers. Based on the published, unpublished and in-progress studies that have been conducted using ISSR markers, it is clear that ISSR markers have great potential for studies of natural populations reviewed
in (WOLFE et al., 1998). ISSRs differentiate mostly
as dominant markers following simple Mendelian
inheritance (PRADEEP REDDYet al., 2002; WANGet
al., 1998). These markers, due to their reproducibility,
are becoming more popular and easier to use than other markers such as RAPD and AFLP
(CHENNAOUI-KOURDAet al., 2007).
Previous researchers utilised RAPD-PCR for the identification and characterisation of basil cultivars (DE MASI et al., 2006; HARISARANRAJ et al., 2008;
IBTISAM, 2008; VIEIRAet al., 2003). Harisaranraj et
al. (2008) investigated the relationship between seven
species of basil using 15 RAPD primers. They found close relation betweenO. basilicum andO. tenuiflorum.
The study of genetic relationships is a prerequisite for plant breeding activities as well as for conservation of genetic resources. In the present study, we report the genetic diversity among Iranian native basil accessions originating from different regions based on ISSR markers.
Materials and methods
Plant material and DNA extraction
Fifty basil accessions collected from different geographical regions of Iran (TAB. 1 and FIG. 1) were investigated. Basil accessions were grown in controlled conditions, and single-leaf samples from 2-week-old seedlings corresponding to 15 plants of each accession were taken for bulk DNA (DE MASI et al., 2006), frozen in liquid nitrogen and then maintained at -80 °C. Samples were ground to powder in the presence of liquid nitrogen. Genomic DNA was extracted using a CTAB-based
method (DE MASI et al., 2006). DNA concentration
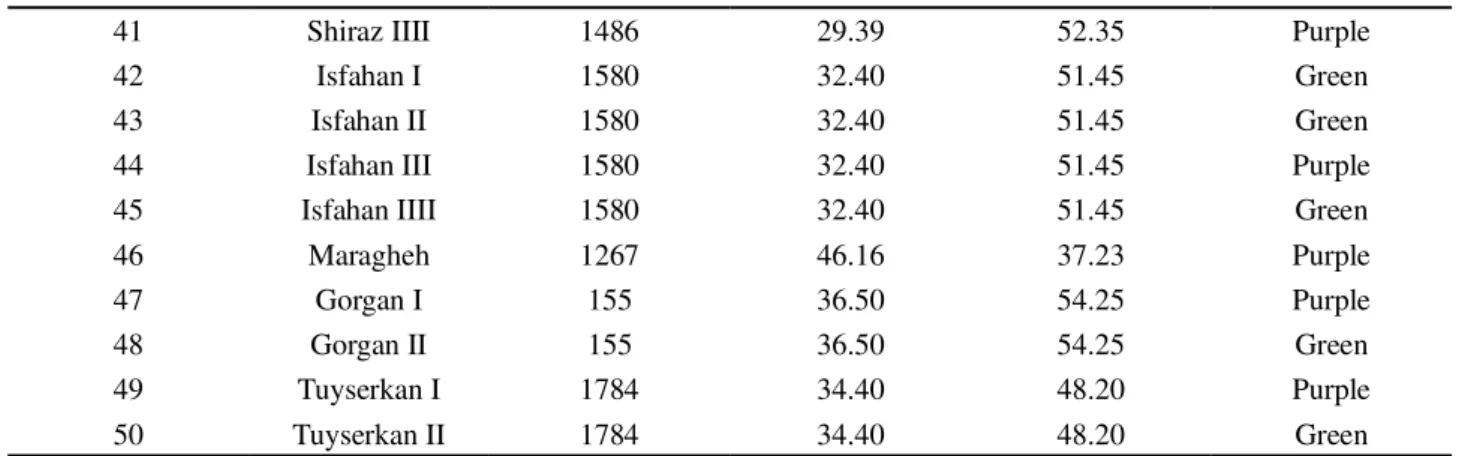
Table 1 - Name, type, and origin of 50 Iranian basil accessions used to evaluate their genetic diversity by inter simple sequence
repeat (ISSR) marker
Code Accession name Elevation (m) Latitude East Longitude North Special characters
1 Tabriz 1366 38.06 46.26 Green
2 Mashhad 980 36.19 59.37 Green
3 Shahr rey I 1100 51.40 35.70 Green
4 Shahr rey II 1100 51.40 35.70 Purple
5 Isfahan 1580 32.40 51.45 Green
6 Kordestan I 1800 35.18 47.06 Green
7 Kordestan II 1800 35.18 47.06 Purple
8 Lorestan 1147 33.26 45.17 Green
9 Kordestan 1800 35.18 47.06 Purple
10 Mahallat 1775 33.88 50.50 Green
11 Kashan 982 33.98 51.58 Green
12 Hormozgan 325 27.37 55.51 Purple
13 Kerman I 1755 30.30 57.10 Green
14 Kerman II 1755 30.30 57.10 Purple
15 Kermanshah I 1389 34.23 47.03 Green
16 Kermanshah II 1389 34.23 47.03 Purple
17 Birjand I 1491 59.13 32.52 Green
18 Birjand II 1491 59.13 32.52 Green
19 Dezful I 39 32.23 48.27 Green
20 Dezful II 39 32.23 48.27 Purple
21 Qazvin I 1800 36.15 50.01 Green
22 Qazvin II 1800 36.15 50.01 Purple
23 Gom I 928 34.49 50.56 Purple
24 Gom II 928 34.49 50.56 Green
25 Hamedan 1824 36.46 48.34 Green
26 Babol I -14 36.33 52.42 Green
27 Babol II -14 36.33 52.42 Purple
28 Babol III -14 36.33 52.42 Green
29 Ahvaz I 39 31.24 48.49 Green
30 Ahvaz II 39 31.24 48.49 Purple
31 Yazd I 1230 32.00 54.40 Green
32 Yazd II 1230 32.00 54.40 Purple
33 Urmia 1267 37.34 44.58 Green
34 Yazd 1230 32.00 54.40 Green
35 Varamin 1100 35.19 51.39 Green
36 Ardebil I 1500 38.15 48.17 Green
37 Ardebil II 1500 38.15 48.17 Purple
38 Shiraz I 1486 29.39 52.35 Green
39 Shiraz II 1486 29.39 52.35 Green
Polymerase chain reaction and data analysis
Polymerase chain reaction (PCR) was performed in a 25-µl volumes containing 12.5 µl of PCR master mix [200 mM Tris–HCl pH 8.55, 160 mM (NH4)2SO4 0.1% (v/
v), 3.0 mM MgCl2, 0.4 mM of dNTPs, 1.0 U of Taq DNA
polymerase](CinnaGen Inc., Tehran, Iran), 2 µM ISSR primer (CinnaGen Inc., Tehran, Iran), 50 ng of genomic
DNA and ddH2O. DNA amplifications were performed
using a GeneAmp PCR System 9700 Thermocycler (Perkin Elmer, Applied Biosystems, USA) programmed for a preliminary step of 3 min at 95 ºC, followed by 35 cycles of 93 ºC for 30 s, 35-58 ºC (depending on primer sequence) for 45 s and 72 ºC for 45 s. A final extension step of 10 min at 72 ºC was performed. The reaction products were then mixed with an equal volume of formamide dye [98% (v/v)
41 Shiraz IIII 1486 29.39 52.35 Purple
42 Isfahan I 1580 32.40 51.45 Green
43 Isfahan II 1580 32.40 51.45 Green
44 Isfahan III 1580 32.40 51.45 Purple
45 Isfahan IIII 1580 32.40 51.45 Green
46 Maragheh 1267 46.16 37.23 Purple
47 Gorgan I 155 36.50 54.25 Purple
48 Gorgan II 155 36.50 54.25 Green
49 Tuyserkan I 1784 34.40 48.20 Purple
50 Tuyserkan II 1784 34.40 48.20 Green
Continuation da Table 1
Figure 1 - Geographical distribution of the 50 Iranian basil
accessions used to evaluate genetic diversity using 12 ISSR markers. Numbers in the map show the basil accessions’ codes. For genotype names corresponding to each code, see Table1
formamide, 10 mM EDTA, 0.05% bromophenol blue and 0.05% xylene cyanol], resolved in a 1.5% (w/v) agarose gel in 0.5X TBE, visualised with ethidium bromide (1.0 µgml-1) and photographed under UV light.
The PCR amplification products were scored for the presence (1) or absence (0) of each band marker across all 50 accessions, and the data were used to construct a binary data matrix. Different methods were used for constructing similarity matrices and dendrograms. The efficiency of clustering algorithms and their goodness of fit were determined based on the cophenetic correlation coefficient. In addition to this cluster analysis, a principal coordinate analysis (PCoA) was used to confirm the results of the cluster analysis. PCoA is a low-dimensional graphical plot that is used to depict the relationships among the genotypes studied. Data analyses were performed using NTSYS-pc version 2.11 software (ROHLF, 1998).
Results and discussion
Thirty-eight alleles were generated at 12 ISSR loci. The number of alleles per locus ranged from one to five, with an average of 3.17 (TAB. 2). The maximum number of alleles was observed at the ‘A7’, ‘818’, ‘825’ and ‘849’ loci (TAB. 2), and their size ranged from 300 to 2500 bp.
Table 2 - Name, sequence and number of alleles for 12 ISSR primers
Primer code Sequence (5´ 3´) Total bands Polymorphic bands Annealing Temperature
A7 agagagagagagagagagagt 9 5 58oC
A12 gagagagagagacc 8 1 52oC
818 cacacacacacacag 8 5 56oC
825 acacacacacacacact 8 5 55oC
849 gtgtgtgtgtgtgtgtcg 7 5 55oC
443 acacacacacacacacact 6 3 54oC
426 caccaccaccaccaccaccact 6 2 54oC
CA&AC cacacacacacaac 2 1 35oC
CAg5 cagcagcagcagcag 6 4 54oC
CTC4RC ctcctcctcctcrc 7 3 38oC
CAA5 caacaacaacaacaa 6 3 41oC
459 tgctgctgctgctgctgcc 5 1 54oC
Total 78 38
Mean 6.5 3.17
based on this method was used for depicting the genetic diversity of accessions (FIG. 3). A similarity matrix based on Jaccard's coefficient for all 50 basil accessions gave values from 1.00-0.60. The average pairwise genetic similarity was 0.73. The maximum
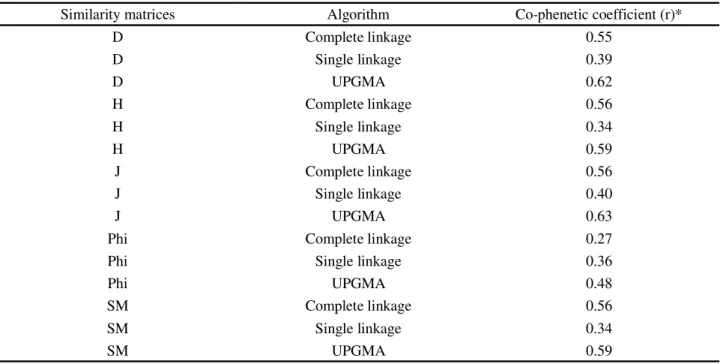
Table 3 - Comparison of different methods for constructing the similarity matrix and dendrogram using the co-phenetic coefficient
Similarity matrices Algorithm Co-phenetic coefficient (r)*
D Complete linkage 0.55
D Single linkage 0.39
D UPGMA 0.62
H Complete linkage 0.56
H Single linkage 0.34
H UPGMA 0.59
J Complete linkage 0.56
J Single linkage 0.40
J UPGMA 0.63
Phi Complete linkage 0.27
Phi Single linkage 0.36
Phi UPGMA 0.48
SM Complete linkage 0.56
SM Single linkage 0.34
SM UPGMA 0.59
similarity (1.00) was observed between the "Urmia" and "Shahr-e-Rey II" accessions as well as between the "Urmia" and "Qazvin II" accessions. The lowest similarity (0.60) was observed between the "Tuyserkan I" and "Gom II" accessions.
*A measure of how successful cluster analysis has been in partitioning the data. D: Dic (NEI; LI, 1979); H: Hamann (HAMANN, 1961); J: Jaccard
The UPGMA clustering algorithm classified the studied accessions into three clusters (FIG. 2). The first, second and third groups comprised 46%, 46% and 8% of accessions, respectively (FIG. 2). All of the basil accessions, with exception of "Babol III", "Ahvaz II", "Yazd II" and "Ardebil I," were placed in group I or II. In group I, the highest similarity value (1.00) was observed between the "Urmia" and "Shahr-e-Rey II" accessions as well as between "Urmia" and "Qazvin II" accessions. Group I was further divided into two subgroups. In group II, the highest similarity value (0.96) was found between the "Babol II" and "Ahvaz I" accessions. Group II was further divided into three subgroups. In group III, the highest similarity value (0.82) was found between the "Babol III" and "Ahvaz II" accessions. Compared to group II and III, the
Figure 2 - Dendrogram of 50 Iranian basil accessions generated by the UPGMA clustering method based on a Jaccard’s
coefficient of similarity matrix. Numbers in the dendrogram show the basil accessions’ codes. For genotype names corresponding to each code, see Table1
pairwise similarity in group I was higher. In other words, the accessions in group I were clustered together at a higher similarity value.
into group II. This was also seen for accessions from “Kordestan”, “Kerman”, “Kermanshah”, “Birjand”,
“Dezful” and “Isfahan”. De Masi et al. (2006) studied
the genetic similarity among 12 basil genotypes with RAPD markers and identified two main groups, the first of which consisted of purple-leaf cultivars. Purple-leaf genotypes are used in food industries to aromatise food.
The clustering of a large number of genotypes in two groups (I and II) revealed low genetic variability that may be due to (a) the autogamous propagation of cultivated basil, which reduces genetic variability and (b) the biodiversity reduction in cultivars used in agriculture, as growers use fewer genotypes for seed production (DARRAH, 1980). In accordance with the above, in northwest Iran (Azerbaijan and Maragheh), the majority of cultivated genotypes have purple leaves, whereas in the centre (Tehran and its suburbs), green-leaved basil known as “Tehrani” basil is grown.
It was obvious that the genetic relationships among the studied accessions did not have a strong tendency to associate with their geographic origins. Murthy and Arunachalam (1966) showed that genetic drift and selection in different environments can cause greater diversity among genotypes than geographic distance. Therefore, selection of parental material in breeding programmes simply based on geographic diversity may not be rewarding. One possible reason for the genetic similarity among germplasm from different regions is that the materials might have originally been introduced from the same region. Crossing between clusters with maximum inter-cluster distance may be result in high heterosis. It is well documented that crosses between unrelated, and consequently genetically distant parents, show greater hybrid vigour than crosses between closely related genotypes (REIF
et al., 2007; SOLOMONet al., 2007).
Principal coordinate analysis (PCoA) showed that the first three PCs explained 38.14% of the cumulative variation. These three PCs were then used to design a principal coordinate plot to identify the diversity pattern of studied genotypes (FIG. 4). The principal coordinate plot showed the close genetic relationship among the “Tabriz”(1), “Shahr-e-Rey II”(4), “Kerman II”(14) and “Shiraz III”(40) accessions and among the “Kordestan III”(9), “Kermanshah II”(16) and “Dezful II”(20) accessions, which had also been observed in cluster analysis (FIG. 2). Our results showed that the PCoA data approximately corresponded to those obtained through cluster analysis. This is in agreement
with other findings (DARVISHZADEH et al., 2010;
KUMARet al., 2009; SORKHEet al., 2007).
Figure 3 - Different types of basil accessions growing in Iran. a)
Figure 4 -Three-dimensional graph from the principal coordinate
analysis of 12 ISSR markers of 50 Iranian basil accessions. Genotype codes: see Table 1
Conclusions
1. In the present study, we characterised and identified the genetic relationships of 50 Iranian basil accessions using ISSR markers for the first time. We found relatively acceptable genetic diversity within available basil accessions. The studied accessions were classified into three distinct groups. Some accessions share specific characteristics that influence their clustering;
2. Assessment of the genetic variability within plant species is a prerequisite for plant breeding programs and has an important role in the conservation of plant genetic resources. It is particularly useful in the characterisation of individual accessions and cultivars, in detecting duplications of genetic material in germplasm collections, and as a general guide in the choice of parents for hybrid breeding programs.
Acknowledgements
The authors are grateful for the support provided by Institute of Biotechnology, Urmia University, Iran.
References
CHENNAOUI-KOURDA, H.et al. Genetic diversity ofSulla genus (Hedysarea) and related species using Inter-simple
Sequence Repeat (ISSR) markers.Biochemical Systematic and Ecology, v. 35, n. 10, p. 682-688, 2007.
DARRAH. H. H. The cultivated basils. Independence, MO:
Buckeye Printing Co., 1980.
DARVISHZADEH, R.et al. Molecular characterization and
similarity relationships among sunflower (Helianthus annuus
L.) inbred lines using some mapped simple sequence repeats.
African Journal of Biotechnology, v. 09, n. 43, p.
7280-7288, 2010.
DE MASI, L. et al. Assessment of Agronomic, chemical and
genetic variability in common basil (Ocimum basilicum L.).
Euro. Food Res. Technol., v. 223, n. 02, p. 273-281, 2006.
GODWIN, I. D.; AITKEN, E. A. B.; SMITH, L. W. Application of inter-simple sequence repeat (ISSR) markers to plant genetics. Electrophoresis, v. 18, n. 09, p.
1524-1528, 1997.
HAMANN, U. Merkmalsbestand und Verwandtschaftsbeziehungen der Farinose. Ein Betrag zum System der Monokotyledonen. Willdenowia, v. 02, p.
639-768, 1961.
HARISARANRAJ, R.et al. Analysis of inter-species relationships
of Ocimum species using RAPD markers. Ethnobotanical
Leaflets, v. 12, p. 609-613, 2008.
IBTISAM, H. Effect of salicylic acid on genetic variation of
Ocimum basilicum (Basil) based on ISSR, RAPD and protein
markers. Global Journal of Molecular Sciences, v. 03, p.
8-17, 2008.
JACCARD, P. Nouvelles recherches sur la distribution florale.
Bull. Soc. Vaud. Sci. Nat., v. 44, p. 223-270, 1908.
KHOSLA, M. K. Study on the inter-relationship, phylogeny and evolutionary tendencies in genus Ocimum.Journal of genetics and plant breeding, v. 35, n. 10, p. 71-83, 1995.
KONAREV. V. G. Cultivar identification and gene pool registration by seed proteins in cultivated plants. St.
Petersburg: Vses. Inst. Rastenievod, 2000.
KUMAR, V.et al. Comparative analysis of diversity based on
morpho-agronomic traits and microsatellite markers in common bean.Euphytica, v. 170, n. 03, p. 249-262, 2009.
MAROTTI, M.; PICCAGLIA, R.; GIOVANELLI, E. Differences in essential oil composition of basil (Ocimum basilicum L.)
Italian cultivars related to morphological characteristics.Journal of Agricultural and Food Chemistry, v. 44, n. 12, p.
3926-3929, 1996.
MURTHY, B. R.; ARUNACHALAM, V. The nature of genetic divergence in relation to breeding system in crop plants. Indian Journal of Genetics and Plant Breeding, v.
26, p. 188-189, 1966.
POWELL, W. et al. The comparison of RFLP, RAPD, AFLP
and SSR (microsatellite) markers for germplasm analysis.
Molecular Breeding, v. 02, n. 03, p. 225-238, 1996.
PRADEEP REDDY, M.; SARLA N.; SIDDIQ, E. A. Inter simple sequence repeat (ISSR) polymorphism and its application in plant breeding. Euphytica, v. 128, n. 01, p.
9-17, 2002.
RATNAPARKHE, M. B.; TEKEOGLU, M.; MUEHLBAUER, F. J. Inter simple- sequence-repeat (ISSR) polymorphisms are useful for finding markers associated with disease resistance gene clusters.Theoretical and Applied Genetics, v. 97, n. 04,
p. 515-519, 1998.
REIF, J. C. et al. Impact of genetic divergence on additive
and dominance variance in hybrid populations.Genetics, v.
176, p. 1931-1934, 2007.
ROHLF, F. J.NTSYS-pc: Numerical taxonomy and multivariate analysis system, version 2.02. New York: Exeter Software, Setauket, 1998.
SEMAGN, K.; BJØRNSTAD, Å.; NDJIONDJOP, M. N. An overview of molecular marker methods for plants. African Journal of Biotechnology, v. 05, p. 2540-2568, 2006.
SNEATH, P. H. A.; SOKAL, R. R.Numerical Taxonomy. San
Francisco, USA: Freeman WH, 1973.
SOKAL, R. R.; SNEATH, P. H. A. Principles of Numeric Taxonomy. San Francisco, USA: Freeman WH, 1963.
SOLOMON, K. F.; LABUSCHAGNE, M. T.; VILJOEN, C. D. Estimates of heterosis and association of genetic distance with heterosis in durum wheat under different moisture regimes.The Journal of Agricultural Science, v. 145, p. 239-248, 2007.
SORKHE, K.et al. Amplified fragment length polymorphism
as a tool for molecular characterization of almond germplasm: genetic diversity among cultivated genotypes and related wild species of almond, and its relationships with agronomic traits.
Euphytica, v. 156, n. 03, p. 327-344, 2007.
VIEIRA, R. F.; GOLDSBROUGH, P. B., SIMON, J. E. Genetic diversity of basil based on RAPD markers. Jornal of the American Society for Horticultural Science, v. 128,
p. 94-99, 2003.
WANG, G.; MAHALINGAN, R.; KNAP, H. T. (C-A) and (G-A) anchored simple sequence repeats (ASSRs) generated polymorphism in soybean,Glycine max (L.) Merr.Theoretical and Applied Genetics, v. 96, n. 08, p. 1086-1096, 1998. WOLFE, A. D.; XIANG, Q. Y.; KEPHART, S. R. Assessing hybridization in natural populations of Penstemon
(Scrophulariaceae) using hypervariable inter simple sequence repeat markers. Molecular Ecology, v. 07, n. 09, p.