Exemplified by the Critically Endangered Dama Gazelle
(
Nanger dama
)
Helen Senn1*, Lisa Banfield2, Tim Wacher3, John Newby4, Thomas Rabeil5, Jennifer Kaden1, Andrew C. Kitchener6,7, Teresa Abaigar9, Teresa Luı´sa Silva8,9,10, Mike Maunder11, Rob Ogden1
1WildGenes Laboratory, Royal Zoological Society of Scotland, Edinburgh, United Kingdom,2Conservation Department, Al Ain Zoo, Al Ain, Abu Dhabi, United Arab Emirates,3Conservation Programmes, Zoologicial Society of London, Regents Park, London, United Kingdom,4Sahara Conservation Fund, L’Isle, Switzerland,5Sahara Conservation Fund, Niamey, Niger, 6Department of Natural Sciences, National Museums Scotland, Chambers Street, Edinburgh, United Kingdom, 7Institute of Geography, School of Geosciences, University of Edinburgh, Drummond Street, Edinburgh, United Kingdom,8CIBIO/InBIO, Centro de Investigc¸a˜o em Biodiversidade e Recursos Gene´ticos da Universidade do Porto, Vaira˜o, Portugal,9Estacio´n Experimental de Zonas A´ridas, Consejo Superior de Investigaciones Cientı´ficas (CSIC), Almerı´a, Spain,10Departamento de Biologia da, Faculdade de Cieˆncias da Universidade do Porto, Porto, Portugal,11College of Arts and Sciences, Florida International University, Miami, Florida, United States of America
Abstract
Managers of threatened species often face the dilemma of whether to keep populations separate to conserve local adaptations and minimize the risk of outbreeding, or whether to manage populations jointly to reduce loss of genetic diversity and minimise inbreeding. In this study we examine genetic relatedness and diversity in three of the five last remaining wild populations of dama gazelle and a number of captive populations, using mtDNA control region and cytochrome b data. Despite the sampled populations belonging to the three putative subspecies, which are delineated according to phenotypes and geographical location, we find limited evidence for phylogeographical structure within the data and no genetic support for the putative subspecies. In the light of these data we discuss the relevance of inbreeding depression, outbreeding depression, adaptive variation, genetic drift, and phenotypic variation to the conservation of the dama gazelle and make some recommendations for its future conservation management. The genetic data suggest that the best conservation approach is to view the dama gazelle as a single species without subspecific divisions.
Citation:Senn H, Banfield L, Wacher T, Newby J, Rabeil T, et al. (2014) Splitting or Lumping? A Conservation Dilemma Exemplified by the Critically Endangered Dama Gazelle (Nanger dama). PLOS ONE 9(6): e98693. doi:10.1371/journal.pone.0098693
Editor:Ulrich Joger, State Natural History Museum, Germany
ReceivedJanuary 9, 2014;AcceptedMay 2, 2014;PublishedJune 23, 2014
Copyright:ß2014 Senn et al. This is an open-access article distributed under the terms of the Creative Commons Attribution License, which permits
unrestricted use, distribution, and reproduction in any medium, provided the original author and source are credited.
Funding:Funding for genetic analysis was provided by Al Ain Zoo and the Royal Zoological Society of Scotland. The Sahara Conservation Fund, the Zoological Society of London, Saint Louis Zoo, Al Ain Zoo, the Addax and Oryx Foundation, and HH Sheikh Mohammed bin Zayed funded the collection of the dama gazelle samples from the wild. The authors’ time during the project was funded by their own institutions and TLS’s work was additionally partially supported by FCT-Fundac¸a˜o para a Cieˆncia e a Tecnologia (SFRH/BD/73680/2010). Some funders to the project (Al Ain Zoo, Royal Zoological Society of Scotland, Sahara Conservation Fund, Zoological Society of London) were directly involved in the study design, data collection and analysis, decision to publish, and preparation of the manuscript via the participation of their employees in the project. These individuals are authors on this manuscript. The other funders (Saint Louis Zoo, the Addax and Oryx Foundation, FCT-Fundac¸a˜o para a Cieˆncia e a Tecnologia and HH Sheikh Mohammed bin Zayed) had no role in study design, data collection and analysis, decision to publish, or preparation of the manuscript.
Competing Interests:The authors have declared that no competing interests exist.
* Email: [email protected]
Introduction
Fragmented populations of endangered species present a conservation dilemma [1]. If numbers dwindle to the extent that conservation intervention is necessary, should they be managed separately to conserve locally adapted genetic diversity and minimise the risk of outbreeding? Or should they be managed jointly to preserve evolutionary potential and to reduce the risk of inbreeding? This dilemma has been discussed recently both from taxonomic [2–3] and management [4] perspectives and is present in many wild and captive management scenarios [5–10]. The dilemma is typified in regard to the Critically Endangered dama gazelle (Nanger dama) [11].
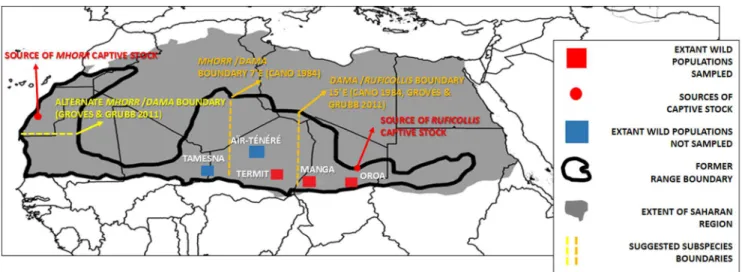
There are around 300 dama gazelles left in the wild [11–12] and their range has shrunk by 99% during the period 1960–90 [13–14]. They now only exist in confirmed isolated populations in Chad, Niger, and Mali (Figure 1) and possibly in Sudan.
Approximately 550 individuals are thought to exist within zoos and breeding centres across Europe, the USA and the Middle East, with further populations in private collections in the Middle East and particularly the USA accounting for an estimated 1000 individuals.
The dama gazelle is the largest of the gazelle species [17]. It shares the genusNangerwith Soemmering’s gazelle (N. soemmerringii)
and the Grant’s gazelle complex (N. grantiand related species) [18]. Once previously included in the genus Gazella, molecular phylogenetic analysis revealed inclusion of these larger gazelles would make the genusGazellaparaphyletic and hence they have been separated into the genusNanger[19]. The dama gazelle has been subdivided into a variable number of subspecies (see below). The coloration of the dama gazelle’s pelage is variable and, according to taxonomic tradition, was described by Cano [15] as
following a northwest to south and east cline across the species’ range: Animals in the east are predominantly white with reddish-brown coloration confined to the neck and shoulders, whereas animals in the west have extensive reddish-brown coloration, which extends further down the back, flanks and haunches. In the far north-west the animals are predominantly chestnut with a white underbelly and rump (Figure 2). However, this is an over-simplification of the dama gazelle’s geographical variation, especially in the center of its range. Among former and remaining wild populations in Chad, considerable individual variation in the
Figure 1. A map depicting the former and current range of the dama gazelle (adapted from[14]).Wild sampling sites and places of origin
for the captive populations are depicted. The suggested subspecies boundaries according to different authors are listed (see in text for detail). doi:10.1371/journal.pone.0098693.g001
Table 1.Details of the 124 samples in this study and the populations that they originated from.
Population
Site Code (suffix indicates putative
subspecies) Details
Putative sub-species
Number of Samples collected
WILD
Chad (Ouadi Rime´-Ouadi Achim)
OROA_R Wild Population in Ouadi Rime´-Ouadi Achim Game Reserve in Central Chad(,N14.9027, E19.8318)
N.d.ruficollis 18
Chad (Manga) MANGA_R Wild Population in Manga region of Western Chad (,N15.33087, E15.1277)
N.d.ruficollis 6
Niger (Termit) TERMIT_D Wild population(s) in the Central (,N16.1047, E11.4171) &
Northern (,N16.3706, E11.4581) massif of the Termit
mountains
N.d.dama 12
ZOO/CAPTIVE
Al Ain Zoo ‘mhorr’ AIN_M Origin unrecorded, highly likely to be descended from animals in the EEP (originally from EEZA).
N.d.mhorr 42
Al Ain Zoo ‘ruficollis’ AIN_R Origin unrecorded, likely to stem from the North American Regional Studbook for addra (ruficollis) gazelle as it records the transfer of two females and a male to Al Ain Zoo in 1982.
N.d.ruficollis 20
Dama gazelle EEP EEP_M Animals sampled from City of Belfast Zoo, EEZA and Montpellier all ultimately originating from EEZA
N.d.mhorr 12
Marwell Zoo ‘ruficollis’ MAR_R Origin is the North American Regional Studbook for addra (ruficollis) gazelle.
N.d.ruficollis 5
Katane´, Ferlo North Game Reserve, Senegal
SEN_M Ultimately originating from EEZA via Re´serve Spe´ciale de Faune de Guembeul, Senegal
N.d.mhorr 3
Safia Reserve, Morocco SAF_M Ultimately originating from EEZA via R’Mila Royal Reserve, Morocco.
N.d.mhorr 6
extent of the dark dorsal coloration was and is obvious even within the same herd [20–21].
Geographical variation and putative subspecies
This apparent cline in dorsal coloration led to the designation of a number of subspecies, based mostly on single specimens, which are often poorly described [22–25]. Cano [15] examined 50 museum specimens and captive populations to determine only three subspecies, a classification that is followed generally today:N. dama ruficollisoccurs east of c.15uE,N. dama damaoccurs from c.7uE to c.15uE, and N. dama mhorroccurs west of c.7uE. This tri-part classification was also followed by Groves and Grubb [18], although they presented a difference in the location of the boundaries betweendamaandmhorrlocating it further northwest, stating that mhorrdid not occur further south than the Western Sahara (Figure 1). This difference is due to historical confusion over the type locality of the species, then ‘‘Antilope dama’’ described by Pallas in 1766 [22] based on a specimen described and figured by Buffon in 1764 [23] which was collected from Senegal. It was later assumed that this specimen had in fact been collected in the Lake Chad region and not Senegal based on the pelage coloration [15]. Groves & Grubb [18] argue that it is more likely however that it did indeed come from Senegal because Lake Chad was not discovered by Europeans until 1823, more than 50 years after the species was described. The figure by Buffon [23] is, however, not a very biologically accurate representation of the species, illustrating the difficulty of making reliable inferences from historical references. Owing to the confusing number of subspecies names described for this species, we reproduce here the synonyms that Groves and Grubb [18] provide for each putative subspecies:
N. d. dama(Pallas, 1766), includingAntilope nanguer,Antilope dama
var.occidentalis, Gazella dama permista, Gazella mhorr reducta, Gazella dama damergouensis,Gazella dama weidholtzi
N. d. ruficollis(Hamilton Smith, 1827), including Antilope addra,
Antilope damavar.orientalis
N. d. mhorr(Bennett, 1833), includingGazella dama lozanoi N. d. mhorris often referred to by the common names of mohor or mhorr gazelle andN.d. ruficollisis often called the addra gazelle. Here we use the term ‘‘dama gazelle’’ to cover all putative subspecies and populations of the speciesNanger damaand for the time being we follow Cano’s [15] definition of subspecies and Groves and Grubb’s [18] geographical ranges for each subspecies. We highlight here again however that considerable variation within the subspecies has been recoded recently [12] [21] and that [20] observed phenotypic variation, claiming to have seen representatives of all three subspecies phenotypes within Eastern Chad.
History of captive populations
The early history of the captive stock is detailed by Cano [26]. In 1971, a captive breeding programme was established forN. d. mhorr in Almeria (Spain) at the Parque de Rescate de Fauna Sahariana (now known as ‘‘La Hoya’’ Experimental Field Station, Estacio´n Experimental de Zonas Aridas), with animals that had originated from the Dora-Hagunia and Tichla-Bir Ganduz of Western Sahara in 1958 [26–27]. The last remainingN. d. mhorr
were seen there in 1968 [26]. The captive population was based on one male and three females, which are the founders for all animals within the mhorr gazelle international studbook. There are currently 293 animals in 20 institutions across Europe, USA, Africa and the Middle East, of which the largest collection,,100
individuals, is at the original location of the ‘‘La Hoya’’ Experimental Field Station. Additionally, this captive population has been either the direct or indirect source (via descendants in Figure 2. Variation in pelage coloration in different
popula-tions listed from northwest to southeast.a&b) Captivemhorrat Al
other institutions) of all animals for a number of reintroductions to fenced protected areas in North and West Africa; Bou Hedma National Park, Tunisia (22 animals in the early 1990s) [28–29]; Souss-Massa National Park, Morocco (12 animals in 2006); Domaine Royal de R’Mila, Morocco, Safia Reserve, Morocco; Guembeul Faunal Reserve, Senegal (seven gazelles in 1984) [30], of which five descendants were the founders for the population at Katane´, Ferlo North Game Reserve, Senegal, in 2003 [31]. There are no other known sources of mhorr gazelles, so that in all likelihood the entire captive population today is descended from just four founders.
The decision was taken in 1995 by the European Association of Zoos and Aquaria (EAZA) (whose animals had originally come from USA populations) to phase out the captive management ofN. d. ruficollis ‘‘addra’’ in favour ofN. d. mhorr [32]. Similarly, AZA took the decision in 2008 to phase out management ofN. d. mhorr infavour ofN. d. ruficollis. Therefore, the current situation is that
N.d.ruficollisis subject to coordinated breeding efforts in the USA and breeding ofN.d.mhorris coordinated in Europe. A number of institutions in the Middle East hold both subspecies
There has been historical debate over whether the ruficollis
population is indeedruficollisor in factdamaor a mixed subspecies population, but here we refer to it asruficollisthroughout, following the current consensus. Twenty-eight institutions across the USA hold a total of 168 animals [33]. The studbook was founded by five females and three males from the Ouadi Haouach region of north-east Chad [34], which crosses the north-north-east boundary of the Ouadi Rime´-Ouadi Achim Game Reserve sample site in this study (see OROA Table 1). Therefore, this captive population (which shows variation in coat coloration) is defined asruficollis, because the original collecting locality is within this subspecies’ range according to the Cano [15] classification and comes from a location close to where an extant wild dama population shows marked inter-individual variation in detail of basic pelage pattern. There are also a similar number of N. d. ruficollisin captivity in private collections, for which no additional founders are known.
Given the small number of animals left in the wild, the studbook-managed populations represent a considerable propor-tion of the species’ global populapropor-tion (,300 in the wild,,550 in
captivity). At least as many animals again exist in captivity outside the two studbooks, notably on private ranches in Texas [35]. So if there can be any positive news for this species at all, it is the captive insurance populations are reasonably large in size. However, it cannot be assumed that all animals alive are currently of equal genetic value to the long-term conservation of this species. Both wild and captive populations are likely to be experiencing higher rates of inbreeding relative to the past (wild populations due to reduction in numbers and fragmented populations, and captive populations due to the small number of founders). However, levels of inbreeding (and inbreeding depression) may differ considerably between populations. Additionally remaining (wild and captive) populations are unlikely to be equally closely related to each other.
Study Aims
The purpose of this study was to assess the relatedness and relative genetic diversity in extant populations and to use this information to assess the conservation value of different popula-tions and the validity of the current subspecies classification system in order to inform future conservation management strategies for the dama gazelle.
Methods
Sample collection
In total 124 samples were collected. This included 36 samples from the wild that were collected as a result of six collecting trips on public land between 2009 and 2013 with the authority and participation of the Termit & Tin Toumma National Nature Reserve, Niger and the Ouadi Rime´-Ouadi Achim Game Reserve and Government of Chad. Samples were collected opportunisti-cally as pellets from distinctly separated fresh piles of faeces, in most cases following direct observation of wild dama gazelles. Samples from captive and reintroduced populations represent a mixture of blood and tissue samples taken from routine veterinary treatment or during autopsy (following natural death) or via faecal sampling and were provided by the relevant institutions or from the collections of National Museums Scotland (see Supplementary Table S1 for details of specific samples), and as a result of two collection trips to Safia and Katane´ reserves (public land) with the permission of the National Parks in Senegal and the Haut Commissariat des Eaux et Foˆrets et de la Lutte Contre la Desertification in Morocco (Table 1: summary details of samples used in this study). CITES permits were in place for the samples that required them. No animals were harmed or killed for the purpose of this study.
DNA extraction
Tissue and blood samples were extracted using DNeasy blood and tissue kits (Qiagen) and faecal samples with the QIAamp DNA Stool Mini Kit (Qiagen), according to standard protocols. In the case of faecal samples, a single pellet was used per extraction.
Control region mtDNA sequencing
Primers were designed from existing sequences on Genbank to amplify a 560 basepair fragment from the centre of the control region: nang-fwd (59to 39):CTA TGT CCT GTT ACC ATT GAC, nang-rev (59to 39):GAT TGT CCA CAT GCA TAT AAG C. PCR amplification of the fragment was conducted with 1ml of template DNA (10– 50 ng ml21)1ml each of forward and reverse primer (10mM) and 7ml of Maxima Hot Start PCR Master Mix (Thermo-Fisher). Amplification was performed with an initial denaturation step of 5 mins. at 95uC, followed by 35 cycles of 1 min. (denaturation) at 95uC, 1 min. (primer annealing) at 58uC, 1 min. (elongation) at 72uC and ending with a 72uC extension for 10 mins. Negative controls were run as standard.
The fragments were examined by running them out on a 1% agarose gel and successfully amplified products were cleaned up by addition of 0.5ml of the enzymes EXO1 and FastAP (Fisher) with an incubation step of 37uC645 min and a denaturation step of 80uC610 min. Fragments were sequenced in the forward direction using the BigDye Terminator KitH(Applied Biosystems), using 3ml of PCR product and conditions according to manufacturer’s instructions. Sequences were run on a capillary ABI 3730 DNA Analyzer sequencerH(Applied Biosystems). In the case of faecal samples, sequencing was additionally conducted in the reverse direction and for a subset of samples with unique haplotypes the PCR was repeated and sequenced.
Cytochrome b sequencing
-min./[95uC630 s, 50uC690 s, 72uC630 s]635 cycles/ 60uC630 min. PCR clean-up and sequencing were conducted as for the control region (see above). Sequencing was conducted in a single direction, using the primer MCB 398 and verified in the reverse direction for a subset of unique haplotypes.
Alignment
Chromatograms were analysed with Geneious Pro v6.1.4 [37]. Primer sequences were trimmed from the alignments. The cytochrome b sequences were translated to verify the absence of stop codons in the sequences. Sequences aligned with the ClustalW algorithm implemented in the Geneious Pro software and final corrections done by eye.
Tree and network building
Tree building was performed separately for control region and cytochrome b fragments, using two different methods for each fragment. Firstly, a simple distance-matrix method was used to build the trees. This was done using neighbour joining with the Tamura-Nei model of genetic distance. The trees were built in Geneious Pro v6.1.4 and one-hundred bootstrap iterations were performed. Secondly, Bayesian inference was carried out with MrBayes v3.1.2 [38]. Posterior probabilities were calculated using four heated Markov chains run (chain temp. 0.2) for 2,000,000 Metropolis-coupled MCMC generations. Tree sampling was conducted every 500 generations and a burn-in of 200,000 trees was used. The model used for nucleotide substitution was the General Time Reversible model with among-site substitution-rate heterogeneity described by a gamma distribution and a fraction of sites constrained to be invariable (GTR+C+I). This was chosen as a conservative measure, because it has been previously been shown that Bayesian inference of phylogenetic trees performs better, if the chosen substitution model tends toward being over-rather than under- parameterised [39]. The Bayesian analysis was replicated twice to examine its stability.
Control region trees were built using the Genbank haplotype JN632666 (Nanger granti) as an outgroup and incorporating sequence JN632665 from a dama gazelle, originating from San Diego Zoo. Here it is referred to as control region haplotype S.
Haplotype networks of the control region data were created using TCS v1.21, treating gaps as a 5thstate (there is in fact only a single in-del in the alignment). The network was examined at a number of different probabilities of parsimony (Templeton et al.
1992).
Cytochrome b trees were built, including Genbank sequences KC188777, JN632667, JF728776 (Nanger soemmerringii) and JN632666 (Nanger granti) as outgroups. Sequence JN632665 from the same dama gazelle, originating from San Diego Zoo, was also incorporated into the tree [40]. Here it is referred to as cytochrome b haplotype 4.
Nucleotide diversity
Haplotype and nucleotide diversity and matrices of mutational distance between haplotypes were calculated using Arlequin 3 [41].
Results
Control region
In total, 122 control region sequences were obtained from the 124 samples, with only two samples failing to give any result (they were faecal samples collected from the sites EEP_M and OROA). 16 haplotypes were discovered and these sequences have been named A to O & R and have been placed on Genbank under
accession KJ848615–30. The majority of the haplotype diversity was spread between the wild populations (13 haplotypes). Captive and captive-derived populations (SEN_M, SAF_M) only con-tained three haplotypes, two withinmhorrand one withinruficollis. No haplotypes were shared between the different wild populations, or between wild and captive populations (Figure 3). Haplotype diversity [42], defined as the probability that two randomly chosen haplotypes are different in the sample, was highest in the populations OROA and Manga (0.840+/20.059 s.d., 0.870+/2
0.129 s.d.) and lower, but roughly equivalent between the Niger and EEP_M populations (0.510+/20.100 s.d., 0.485+/20.106 s.d.) (Figure 3). Nucleotide diversity, defined as the probability that two randomly chosen homologous nucleotides are different, was highest in OROA and Manga (0.031+/20.016 s.d., 0.031+/2
0.018 s.d.). Nucleotide diversity was somewhat higher in the EEP_M (0.013+/20.007 s.d.) than in Niger (0.006+/20.004 s.d.) (Figure 3).
For the Bayesian inference of phylogeny the average standard deviation of split frequencies was 0.0069 after 2,000,000 Metrop-olis-coupled MCMC generations for both of the two replicates.
Phylogenetic analysis of the mtDNA control region data revealed tree topologies that were roughly concordant with Neighbour-Joining and Bayesian methods. However, support was generally low apart from for clusters (S, L), (O,J,K), (H,I) and (R, A,B) (Figure 4a).
Network analysis revealed a similar certainty surrounding resolution, with four clusters being resolved at a 95% connectivity limit (S,L), (H,I,K,J,O), (R,A,B) and (E,F). Relaxation of the connectivity criteria to below 90% was required to draw a complete network, with 18 mutational steps required to link the entire tree (Figure 5). Pair-wise differences between control region haplotypes can be found in Table 2.
Cytochrome b
In total seven haplotypes of cytochrome b were discovered, which were named MCB1–3, 5–8 and placed on Genbank under accession KJ848631–7. Individuals carrying control region hap-lotypes H and I corresponded to MCB Haplotype 1. MCB2 corresponded to control region B,O,A,D,K,J and R; MCB3 to C; MCB5 to L; MCB6 to N, MCB7 to G,M,F and MCB 8 to E. As previously mentioned, MCB4 corresponds to S (JN632665 whole mitochondrial DNA sequence from animals from San Diego Zoo). These cytochrome b haplotype groupings have been overlaid on the control region network (Figure 5).
For the Bayesian inference of phylogeny the average standard deviation of split frequencies was 0.007 and 0.0042 after 2,000,000 Metropolis-coupled MCMC generations for the two replicates. Graphical output of the change in Log Likelihood during the analysis can be found in supplementary material 1.
Resolution of the phylogeny was not much improved at the cytochrome b gene (Figure 4b), with only a clustering of haplotypes 4 and 5 showing strong support (Figure 4b).
Pair-wise differences between cytochrome b haplotypes can be found in Table 3. There was a 2.1% divergence at cytochrome b across the whole sample set and a 0.475% divergence between haplotypes M and R representing the captive mhorr and ruficollis populations.
Discussion
Genetic diversity of dama gazelle populations
The mtDNA control region data show genetic diversity generally appears to be lower in captivity than in the wild populations (note that for samples exhibiting the same control region haplotype in the wild, we do not know to what extent resampling has occurred, but unintentional resampling would deflate not elevate diversity). Particularly striking is the much higher haplotype diversity in the wild populations as a whole (OROA_R, MANGA_R, TERMIT_D) compared with the captive and captive-derivedmhorrpopulations (AIN_M, EEP_M, SEN_ M, SAF_M) and the captiveruficollis populations samples (AIN_R, MAR_R) (Figure 2). Low genetic diversity in captivity is unsurprising given what we know of the captive population’s history (see Introduction). This survey represents a fairly repre-sentative sample of the captivemhorrpopulation derived from the founding stock at La Hoya (represented by populations AIN_M, EEP_M, SEN_M & SAF_M). However, we have not been able to survey genetic diversity extensively within the captive ruficollis
population, having only sampled from derived European (MAR_R) and Arabian (AIN_R) captive populations, and not the original population brought from Chad to the USA. We can expect USA populations to retain some additional genetic diversity not found in the derived populations sampled as part of this study. Understanding how the captiveruficollis population in the USA, both within zoos and private collections, relates to dama gazelle populations globally, represents an important future task. It is interesting to note that the animals sampled from the ruficollis
captive population exhibit haplotypes that are closely related to those found at OROA (Figure 5), as indeed might be expected
given the location that their ancestors were taken from (Figure 1), although see discussion of general lack of phylogeographic structure later. Genetic diversity in one of the wild populations (TERMIT_D) is equivalent to that of the captivemhorr popula-tions. This may represent a worrying sign for this wild population, however mtDNA sequencing and the level of sampling available lack the resolution required to compare genetic diversity fully.
Captive populations of threatened species should be managed to maximise genetic diversity and to minimise inbreeding for two reasons: to reduce the likelihood of inbreeding depression, and to retain the greatest adaptive potential of the population.
Inbreeding has been shown on numerous occasions to have a detrimental effect on fitness in naturally outbreeding species [43– 45] and review by [46]. This includes studies of captive populations [47–48] and populations released into the wild [49– 51]. Pedigree estimates of inbreeding do not correlate with either body size or juvenile mortality in captive populations ofmhorrat La Hoya ([52–53], although see earlier study [54] for contradictory results). It had been suggested that either captive conditions are artificially inflating fitness or that purging of deleterious alleles are responsible for this lack of effect. On the other hand, in the same population, genetic diversity, measured across 17 microsatellite loci (but not pedigree estimates of inbreeding), is correlated with semen quality, a trait that is directly related to fitness [55]. Therefore, Ruiz-Lopezet al. [55] suggest (based on results both frommhorrand a captiveLynx pardinus, population) that in highly inbred captive populations, pedigree estimates of inbreeding are often not reliable indicators of accumulated inbreeding, because base levels of inbreeding may already be high and assumptions of
Figure 3. Bar chart of control region haplotypes (A–O & R) found at different sampling sites in this study.Sites are enumerated by
collecting locality (see Table 1) and putative subspecies; R (N. d. ruficollis), D (N. d.dama), M (N. d. mhorr). Wild and captive populations are separated by a red line. Particularly striking, but not unexpected, is the higher haplotype diversity in the samples from wild populations (OROA_R, MANGA_R,TERMIT_D) than in samples from captive and captive-derivedmhorrpopulations (Ain_M, EEP_M, SEN_M, SAF_M) and captiveruficollis populations (Ain_R, Mar_R). No haplotypes are shared between wild populations, or between wild and captive populations.
non-relatedness of founders may not be met. It seems likely that captive mhorr populations are suffering from other effects of inbreeding, but it is hard to measure these effects due to lack of statistical power. Similar studies have not been conducted for
ruficollis.
Inbreeding depression is not the only reason to be concerned about inbreeding in captive dama gazelles. Concurrent loss of genetic diversity may result in loss of adaptive potential, limiting the ability of the population to evolve [56–58], to be resilient to environmental change or disease [59–60], and to retain the ability of readapting to wild environments from captivity [61–63].
Although genetic diversity in the wild appears to be consider-ably higher than in captivity, diversity is undoubtedly being lost in wild populations and this is of concern for the same reasons as mentioned above. Populations are small and isolated, and in the long term may become vulnerable to inbreeding, if the situation remains the same. Interestingly no haplotypes were shared between different populations despite lack of genetic structure (see below). This may indicate a lack of recent gene flow between sites and genetic drift in small fragmented populations, or may simply be an artefact of the small sample sizes available to this study. Additionally, the comparatively small number of haplotypes found in Termit versus the other wild populations (Figure 3) may indicate elevated levels of inbreeding there. For example twice as many samples were collected from Termit as from Manga but half as many haplotypes were found. The small sample sizes involved make it hard to draw any strong conclusions (Figure 3). A critical task for dama gazelle conservation is to secure genetic diversity and population connectivity in the wild. However, hunting, habitat loss and competition for grazing due to pastoral
development and inherent vulnerability to demographic fluctua-tions caused by small population size are likely to be more immediate threats to the species’ survival than loss of genetic diversity [12].
Relatedness of dama gazelle populations
A crucial task for this study was to make an assessment of the relatedness of dama gazelle populations. Owing to its desperate conservation status, opportunities for sampling in the wild are limited. Despite this issue, a pattern emerged that suggests that phylogeographical structure of mtDNA across the range of the dama gazelle is weak or even absent altogether (Figure 5). There is a low level of support for basal nodes of the control region and cytochrome b trees (Figure 4), which means that it is not possible to resolve the entire structure of interrelatedness of the mitochon-drial genome with confidence, but there is higher confidence in substructures within the trees, which cluster together haplotypes from disparate geographical locations. For example, control region haplotypes A and B, which come from OROA and Manga, are supported with 98% bootstrap (NJ) and 94% posterior probability (Mr Bayes), and differ by only 3 bp mutations. Haplotypes E and F, which come from the captivemhorrpopulation (originating from Western Sahara, see introduction) and Manga, are supported by 89% bootstrap/75% posterior probability and differ by 8 bp mutation steps. Haplotypes G and M from Manga, and the captive
mhorrpopulation, cluster with 83% posterior probability (no NJ support) and differ by 12 base pair mutations (Figure 4 & 5, Table 2).
Critically, the clustering of these groups is also supported by the pattern of relatedness at the more slowly evolving cytochrome b
Figure 4. Evolutionary relationships at different genes a) Tree based on 560 bp of control region and b) 421 bp of cytochrome B.In
each case Neighbourhood joining (left) and Bayesian Inference of Phylogeny via MrBayes (right) were conducted according to the conditions listed in the methods section. The putativeruficollissubspecies exhibits polyphyly at the control region (and cytochrome b, compare with Figure 5). * Captive populations have been combined (see Table 1).
gene, because closely related control region haplotypes are associated with identical or closely related cytochrome b haplo-types (Figure 4, 5). Notably the closely related control region haplotypes M (mhorr), F (mhorr) and G (ruficollis/Manga) are associated with an identical cytochrome b haplotype.
The result of examination of both control region and cytochrome b data is that the putativeruficollissubspecies grouping is likely to be polyphyletic with respect to both dama and mhorr
(Figure 4), although support for the arrangement is not conclusive (75% posterior probability/89% bootstrap). Sequencing of a larger section of the mtDNA or addition of more samples to the tree might result in greater resolution in the future.
Lack of phylogeographical structure at mtDNA genes has been found in two other large Saharan mammals across their range: the Dorcas gazelle, Gazella dorcas [8,64] and the African wolf Canis lupus lupaster[65]. Other genetic studies of large mammals native to the Sahara are absent, perhaps because there are few or no animals left to study [14]. Evidence for phylogeographical structuring does exist in smaller non-flying vertebrates native to this region and is particularly associated with mountains ranges and micro-scale water features [66].
Phenotypic variation
The lack of phylogeographical structure across the dama gazelle range does present a contradiction because the cline in pelage coloration (Figure 2) points to the fact that some level of genetic divergence must be present, assuming that coat-colour is a trait under genetic control. The existence of clines in phenotypic traits is widespread and well documented (for review see [67–68]). Clines in coat coloration in the oldfield mouse (Peromyscus polionotus)
and rock pocket mouse (Chaetodipus intermedius) have been linked to variation in substrate colour exerting differential selection pressure on specific genes [69–70] and micro-habitat variations in enivormantal luminosity have been linked to divergence in the sympatiric mtDNA clades of the Saharan jerboa (Jaculau jaculus) [71]. The case of the oldfield mouse has interesting parallels to that of the dama gazelle: The mouse inhabits a sandy habitat and the coat colour polymorphism in question is a gradation in the extent of a dark cape over a pale body, with similarities to that of dama gazelle. This trait has been linked to selection on the regulatory region of theAgoutigene, a gene that has also been implicated in coat colour variation in a large number of mammals, including Soay sheep,Ovis aries[72], dogs, Canis familiaris, [73] and other domesticated animals [74].
There are distinct climatic differences between the Sahel and the Atlantic Sahara [66], which may be responsible for variation in coat colour as the darker coat coloration is roughly concordant with the Atlantic Sahara [15]. However it is not known how closely correlated trends in climate are to trends in phenotype (and note for example the relatively minor change in extent of coloration between animals originating from Western Sahara and those from Termit in the Sahel approx. 2800 km inland from the coast, Figure 2). It is also not known whether dama gazelles display other phenotypic traits (e.g. skeletal measures, behavioural traits) that are coincident with the change in pelage colour.
If the phenotype is not under selection, one possible explanation for the observed variation in pelage coloration is that genetic drift occurred in separate refugia, perhaps either side of palaeolake Mega-Chad, which was larger than the Caspian Sea 5,000–6,000 years ago and has undergone changes in size associated with
Figure 5. Haplotype network of the control region haplotypes present in this study. Each haplotype is colour coded according to
population of origin, and single base-pair step-wise mutations between haplotypes are colour coded according to their connection limit. Relatedness of haplotypes does not correspond to subspecies divisions or geographical structure.
A E K J O L N C B D G I H M F
A
E 23
K 17 20
J 18 21 1
O 20 21 3 2
L 19 22 18 19 19
N 22 25 19 20 22 21
C 16 20 19 20 22 19 21
B 3 22 18 19 21 18 21 15
D 14 17 15 16 18 11 18 14 15
G 26 21 21 22 22 17 24 25 23 22
I 22 23 15 14 14 15 22 18 21 14 22
H 25 22 14 13 13 22 23 23 22 21 23 7
M 26 21 25 26 26 25 28 29 25 24 12 26 25
F 19 8 18 19 19 16 19 20 18 13 17 19 20 15
R 2 23 19 20 22 21 22 17 5 16 26 24 27 26 19
doi:10.1371/journal.pone.0098693.t002
Conserva
tion
Genetics
of
the
Dama
Gazelle
ONE
|
www.ploson
e.org
9
June
2014
|
Volume
9
|
Issue
6
|
climatic cycles for at least the last 23,000 years [75]. It is possible that divergence resulted in evolution of separate phenotypes, which came together again after a period of isolation, forming a broad zone of secondary contact. The apparent absence of structure at mtDNA loci does not support this theory. However, there may be a cline at nuclear markers, but not at mtDNA markers. Species with male-biased dispersal (which is often the case in mammals, although nature of dispersal is unknown in the case of the dama gazelle) have paradoxically higher rates of mtDNA intogression than at nuclear loci [76], and so it is possible that differentiation at mtDNA markers might disappear first and that we are viewing the results of extensive introgression over a very large area.
It seems unlikely however that pelage coloration is neutral to selection given the (historical) presence of predators [14] and perhaps more importantly, the high level of solar radiation present in the Sahara/Sahel region. The desert-dwelling antelopes, addax (Addax nasomaculatus) and Arabian oryx (Oryx leucoryx), are thought to have evolved a predominantly white pelage to reflect solar radiation for thermoregulation and advertisement when in the open and to aid with camouflage when in the shade [77–78]. Does the varying degree in white present on the dama pelage point to a varying need to reflect solar energy? Or perhaps a tension between this and camouflage either as adults or juveniles? Whether secondary or primary in origin, it is likely, given the mtDNA results that the cline in pelage is caused by selection on a small number of genes. Importantly considerable variation is apparent in pelage within populations (localities) [20] and to our best knowledge transition in phenotype gradually occurs across a very large area [15], suggesting a concurrent gradual change in selection pressure if one exists.
Until evidence to the contrary is produced, phenotype should be assumed to have some selective relevance as this is the most conservative scenario for conservation. The key here is that it is the preservation of the diversity of genes controlling phenotype that is important as this is the raw material on which selection can act (in different environments), not the phenotype per se. Genetic management of dama gazelles should not seek to deliberately breed for phenotype as this will certainly result in further inbreeding of captive populations and may lead to selection for unforeseen traits, because genes controlling coat colour are known to have pleiotropic effects on other (often fitness-negative) traits [74].
Conservation Dilemma
The issues behind the apparent cline in dama gazelle phenotype come to the fore when dealing with the conservation of its populations, creating a classic dilemma for modern-day conserva-tion: are the now fragmented (wild and captive) populations distinct enough to justify being managed separately?
By mixing populations that are distinct, the risk is that the population will suffer from hybrid sterility or outbreeding depression. The risk of maintaining them separately is inbreeding depression and loss of genetic diversity (see above). Frankhamet al.
[4] argued that when considering the option of mixing different populations for conservation purposes, the risk of outbreeding is generally much lower than the risk of inbreeding (see above), but that conservation practitioners tend to overplay the former risk. Predicting the probability of outbreeding depression in advance is not an easy task and Frankhamet al.[4] propose the use of a flow chart for evaluating risk, where the risk of outbreeding depression is smaller with the absence of chromosomal differences, absence of gene flow for,500 years, and lack of substantial environmental differences between the populations (Figure 1 of [4]).
Table
3.
Matrix
of
pair-wise
mutational
differences
between
cytochrome
b
haplotypes.
12345678
1 2
1
3
21
4
434
5
3231
6
32354
7
323542
8
4346531
doi:10.1371/journal.pone.
In the case of the dama gazelle it seems likely the range has been contiguous within the last 500 years and dama gazelles are known to migrate seasonally in search of water [26,79] suggesting high connectivity (also suggested by mtDNA data). As environmental differences have not been determined, it is tempting to suggest that there is little variation, but given that phenotypic variation is present, we cannot be sure. There is some evidence of karyotypic differences between male animals from Almeria (mhorr) and San Diego (ruficollis) in the form of a single chromosomal rearrange-ment (Robertsonian translocation, centric fusion) between the short acrocentric Y1 male-specific sex chromosome and an autosome of pair 14 in the San Diego animals. However a karyotypic polymorphism is also present within animals from Almeria (mhorr); in this case a Robertsonian polymorphism of chromosome 1 [80–81]. A complex of four Robertsonian translocations was also found in a female mhorr in a private collection at Taif in Saudi Arabia, although the origin of this animal is not known [82]. Chromosomal translocations are commonly responsible for reproductive isolation, but polymor-phism is known to be common in gazelles and has been observed in Gazella subgutturosa, G. gazella (from northern Israel), Eudorcas thomsonii and Antilope cervicapra [80,83]. In summary, karyotypic evidence is inconclusive, but the presence of karyotypic differences suggest that we must treat seriously the possibility of genetic incompatibility between the captive populations.
The dangers of the sampling effect
It must also be noted that the captive animals studied here are descended from few individuals (see introduction) and thus represent a very narrow sampling of the former range. This ‘‘sampling effect’’ must always be borne in mind when comparing captive populations, not only for karyotype, but also for phenotype (which may have become more constrained owing to intentional or unintentional inbreeding) and genetic variation (at both nuclear and genetic markers), which will have been subject to extreme levels of drift. The only way to understand patterns of karyotypic, genetic and phenotypic variation is to examine them in the wild, a task which is all but impossible both for logistical reasons and due to widespread population extirpation and fragmentation. Even when examining nuclear structure in wild populations, care must be taken not to conflate recent drift events caused by population fragmentation with deeper historical substructure. The best examination would involve the use of large numbers of linked markers [84] in both current and historic (museum) samples, but this may not be feasible.
Dama gazelle taxonomy and conservation
The problem with the historical preference for splitting into subspecies is that the burden of proof rests with the contemporary researcher. The null hypothesis becomes: ‘‘there arensubspecies’’ even if subspecies were not classified on a rigorous scientific basis. A large number of putative dama gazelle subspecies were recognised historically, based on rather limited evidence, which the paper by Cano [15] rationalised to only three based on the best available phenotypic and geographical data at the time. We would argue that in retrospect perhaps even this revision did not go far enough, owing to the apparent clinal and non-discrete nature of the variation. Today, although the genetic data do not prove polyphyly of the three subspecies conclusively (thereby disproving a null hypothesis of three putative subspecies), the joint evidence at the mtDNA control region and cytochrome b are suggestive of polyphyly and it is crucial to note that the data would not support a split into three subspecies from ana prioriassumption of one. The levels of genetic divergence at cytochrome b (0.5% between
captivemhorrandruficollishaplotypes and 2.1% as a whole) are at within-species levels both for the best studied Saharan gazelle species, the dorcas gazelle [8,64], and for other a mammalian taxa [85].
In the light of this study and the evidence presented here, we conclude with the following statements relevant to the conserva-tion of the dama gazelle:
1. To the best available knowledge, phenotypic variation was originally more or less clinal across the species range. Today, we see phenotypic variation between populations, but also within captive and wild populations. Phenotypic differences between subspecies in captivity may be exaggerated by (in)breeding of the current populations from small numbers of founder individuals. Uneven and incomplete sampling of historical wild populations, and absence and fragmentation of contemporary populations, has in addition possibly presented a distorted view of the original phenotypic variation throughout the species’ range. There is noa priorireason to divide the cline into three discrete units and lack of coincident mtDNA genetic structure and the possible polyphyly of the nominateruficollis
subspecies supports this view.
2. The conservation of the dama gazelle will be greatly advanced if it is considered a single species without subspecies division, even though it exhibits phenotypic variation. Under the ‘‘three subspecies view’’ artificial impermeable boundaries are erected and only individuals which conform to a particular phenotype from within the same subspecies should be bred together, and used for reintroduction and population augmentation. Under the ‘‘monotypic species view’’ there is a continuum of suitability of donors to a population, where all else being equal, the geographically most proximate population is the most suitable, but there is no a priori barrier to exchange between any populations provided the risks of exchange have been evaluated properly.
3. Inbreeding depression and loss of genetic diversity must be taken seriously during ongoing management efforts. Evidence for inbreeding depression in a captive population has already been found [55]. Captive populations of dama gazelle should be managed to maximise genetic diversity and minimise inbreeding. To achieve this aim, the continuation and improvement of the coordination and monitoring of captive breeding efforts across the world is vital.
4. Unless there is evidence to the contrary, phenotype should be assumed to be under some degree of selection in the wild as this is the most conservative scenario to conservation. However, no attempt should be made to breed or select for ‘‘a true phenotype’’ in captivity as this will result in further loss of genetic diversity and possibly unintended selection for traits linked to phenotype.
Supporting Information
Table S1 Details of the individual samples used in this study. (XLSX)
Acknowledgments
From Al Ain Zoo, we thank the Director General Mr Ghanim al Hajeri for his support for the project and Dr Arshad Toosy, Myyas al Qarqaz and their team for collecting the blood samples from Al Ain Zoo’s population. We thank the Director of the Estacio´n Experimental de Zonas Aridas (EEZA, CSIC, Almerı´a, Spain) for the access to animals in the ‘‘La Hoya’’ Field Station, as well as to the National Parks in Senegal and the Haut Commissariat des Eaux et Foˆrets et de la Lutte Contre la Desertification (Morocco) for access to the Katane´ and Safia Reserves respectively; Marwell Zoo (Peter Small and Peter Bircher) and the City of Belfast Zoo (Michael Griffith and Mark Challis) for donations of dama gazelles to National Museums Scotland; Lauri Bingaman Lackey for help with the
Europeanruficollisstudbook; Eulalia Moreno Man˜as and the EEZA-BRB (Biologic Resource Bank of the Estacio´n Experimental de Zonas A´ ridas (CSIC)) for samples and discussion; Gerardo Espeso Pajares the EAZA
mhorr EEP coordinator for advice and discussion; Montpellier Zoo for samples; Ross McEwing for d-loop primer development; Caroline Whitson for assistance with figure design; Hannes Lerp for comments on the manuscript. Later revisions of this manuscript benefited from discussion during the creation of the Conservation Review of the Dama Gazelle [12], the authors of this report are acknowledged and thanked for indirect input that was obtained.
Author Contributions
Conceived and designed the experiments: HS MM RO JN TW TR. Performed the experiments: HS JK. Analyzed the data: HS. Contributed reagents/materials/analysis tools: ACK TR TW JN TA TLS LB. Wrote the paper: HS.
References
1. Edmands S (2007) Between a rock and a hard place: evaluating the relative risks of inbreeding and outbreeding for conservation and management. Molecular Ecology, 16: 463–75.
2. Frankham R, Ballou JD, Dudash MR, Eldridge MDB, Fenster CB, et al. (2012). Implications of different species concepts for conserving biodiversity. Biological Conservation, 153: 25–31.
3. Zachos FE, Apollonio M, Ba¨rmann EV, Festa-Bianchet M & Go¨hlich U, et al. (2013) Species inflation and taxonomic artefacts - A critical comment on recent trends in mammalian classification. Mammalian Biology - Zeitschrift fu¨r Sa¨ugetierkunde 78 (1): 1–6.
4. Frankham R, Ballou J, Eldridge M, Lacy RC, Ralls K, et al. (2011) Predicting the probability of outbreeding depression. Conservation Biology, 25: 465–475. 5. Iyengar A, Gilbert T, Woodfine T, Knowles JM, Diniz FM, et al. (2007) Remnants of ancient genetic diversity preserved within captive groups of scimitar-horned oryx (Oryx dammah). Molecular Ecology, 16: 2436–49. 6. Nsubuga A, Holzman J (2010) The cryptic genetic structure of the North
American captive gorilla population. Conservation Genetics, 161–172. 7. Witzenberger KA, Hochkirch A (2013) Evaluating ex situ conservation projects:
Genetic structure of the captive population of the Arabian sand cat. Mammalian Biology - Zeitschrift Fu¨r Sa¨ugetierkunde, 1–4.
8. Godinho R, Aba´igar T, Lopes S, Essalhi A, Ouragh L, et al. (2012) Conservation genetics of the endangered Dorcas gazelle (Gazella dorcasspp.) in Northwestern Africa. Conservation Genetics, 13: 1003–1015.
9. Simons ND, Wagner RS, Lorenz JG (2013) Genetic diversity of North American captive-born gorillas (Gorilla gorilla gorilla). Ecology and Evolution, 3: 80–88. 10. Hvilsom C, Frandsen P, Børsting C, Carlsen F, Salle´ B, et al. (2013)
Understanding geographic origins and history of admixture among chimpanzees in European zoos, with implications for future breeding programmes. Heredity, 110: 586–93.
11. Newby J, Wacher T, Lamarque F, Cuzin F, De Smet K (2008) Nanger dama. In: IUCN 2013. IUCN Red List of Threatened Species. Version 2013.2. www. iucnredlist.org
12. RZSS & IUCN Antelope Specialist Group (2014) Dama gazelle, Nanger dama, Conservation Review. Royal Zoological Society of Scotland, Edinburgh, UK. 13. Devillers P, Devillers-Tershuren J, Beudels-Jamarr RC (2005) Gazella dama. In:
Beudels-Jamar RC, Devillers P, Lafontaine RM, Devillers-Tershuren J & Beudels MO (2006) Sahelo-Saharan antelopes. Status and perspectives. Report on the conservation status of the six Sahelo-Saharan Antelopes. CMS Technical Series Publication No. 11. UNEP/CMS, Bonn. pp. 57–70.
14. Durant SM, Wacher T, Bashir S, Woodroffe R, De Ornellas P, et al. (2014) Fiddling in biodiversity hotspots while deserts burn? Collapse of the Sahara’s megafauna. Diversity and Distributions, 20: 114–122.
15. Cano Perez M (1984) Revision Systematik von Gazella (Nanger) dama. Zeitschrift der Ko¨elner Zoo, 27: 103–107.
16. Jebali A (2008) De´clin de la faune Sahe´lo-Saharienne et tentative de re´introduction d’antilopes dans des habitats restaure´s. PhD thesis, Museum of Natural History Paris.
17. Kingdon J, Hoffmann M (eds) (2013) Mammals of Africa:Vol. VI : Pigs, Hippopotamuses, Chevrotain, Giraffe, Deer and Bovids. Bloomsbury Publish-ing, London.
18. Groves C, Grubb P (2011) Ungulate Taxonomy. Baltimore, The John Hopkins University Press.
19. Herna´ndez Ferna´ndez M, Vrba ES (2005) A complete estimate of the phylogenetic relationships in Ruminantia: a dated species-level supertree of the extant ruminants. Biological Reviews of the Cambridge Philosophical Society, 80: 269–302.
20. Malbrant R (1952) Faune du Centre africain franc¸ais (mammiferes et oiseaux). Paris, Lechevalier.
21. SCF reports (2010–2013) www.saharaconservation.org
22. Buffon G-LL (1764) Histoire naturelle ge´ne´rale et particulie`re avec la description du cabinet du roy. Tome XII.
23. Pallas PS (1766) Miscellanea zoologica, quibis novae imprimis atque obscurae animalum apecies describuntur et observationsibus iconibusque illustrantur. The Hague: Kessinger.
24. Hamilton-Smith CH (1827) Supplement to the order Ruminantia. In: Griffith E. et al. The animal kingdon arranged in conformity with its organisations by the Baron Cuvier. London, Whittaker. pp. 33–428.
25. Bennet ET (1833) Chracter of a new species of antelope (Antilope mhorr) presented by E.W.A Drummond Hay in. Proc. Zool. Soc. London 1–2, London. 26. Cano M (1991) El antı´lope mohor (Gazella (Nanger) dama mhorrBennett 1832) en
cautividad. Ph. D. Unviersidad de granada, Spain.
27. Valverde JA (2004) Sa´hara,Guinea,Marruecos.Expediciones africanas. Memor-ias de un bio´logo heterodoxo.Editorial Quercus
28. Abaigar T, Cano M, Espeso G, Ortiz J (1997) Introduction of Mhorr gazelle in Bou-Hedma National Park, Tunisia, International Zoo Yearbook, 35: 311–316. 29. Wiesner H, Mu¨ller P (1998) On the Reintroduction of the Mhorr Gazelle in
Tunisia and Morocco. Naturwissenschaften, 85: 553–555.
30. Cano M, Abaigar T, Vericad JR (1993) Establishmnet of a group of Dama gazelles (Gazella (Nanger) dama) for reintroduction in Senegal. Internaltional Zoo Yearbook 32: 98–107.
31. Aba´igar T, Youm B, Niaga M, Ensenyat C, Cano M (2005) The role of Senegal in the recovery of the Sahelo-Saharan antelope species: the case of the reintroduction of Dorcas Gazelle. Gnusletter, 28: 6–8.
32. Rietkerk F (2008) Regional collection planning for antelope and giraffes. EAZA News 64: 12–13. www.eaza.net/News/EAZA_Magazine
33. Petric A (2012) AZA North American Regional Studbook for Addra Gazelle (Nanger dama ruficollis). Sponsored by Saint Louis Zoo.
34. Scholte P (2013) Nanger dama Dama Gazelle; pp 382–387 In Kingdon, J. & Hoffmann, M. (eds) Mammals of Africa: Volume I: Pigs, Hippotamuses, Chevrotain, Giraffes, Deer and Bovids. London, Bloomsbury Publishing, 35. Mungall C (2007) Exotic Animal Field Guide, Texas A&M University Press. 36. Verma SK, Singh L (2003) Novel universal primers establish identity of an
enormous number of animal species for forensic application. Molecualr Ecology 3: 28–31.
37. Drummond AJ, Ashton B, Buxton S, Cheung M, Cooper A, Heled J, et al. (2010) Geneious v6.1.4 http://www.geneious.com.
38. Huelsenbeck JP, Ronquist F (2001) MR.BAYES: Bayesian inference of phylogeny. Bioinformatics 17: 754–755.
39. Ronquist F, Deans AR (2010) Bayesian phylogenetics and its influence on insect systematics. Annual Review of Entomology, 55: 189–206.
40. Hassanin A, Delsuc F, Ropiquet A, Hammer C, van Vuuren BJ, et al. (2012) Pattern and timing of diversification of Cetartiodactyla (Mammalia, Laura-siatheria), as revealed by a comprehensive analysis of mitochondrial genomes. Comptes Rendus Biologies, 335: 32–50.
41. Excoffier L, Laval G, and Schneider S (2005) Arlequin ver. 3.0: An integrated software package for population genetics data analysis. Evolutionary Bioinfor-matics Online 1:47–50.
42. Nei M (1987) Molecular Evolutionary Genetics. Columbia University Press, New York.
43. Darwin C (1876) The Effects of Cross and Self Fertilisation in the Vegetable Kingdom. John Murray, London.
44. Crnokrak P, Roff D (1999) Inbreeding depression in the wild. Heredity, 83 (Pt 3): 260–70.
45. Spottiswoode C, Møller AP (2004) Genetic similarity and hatching success in birds. Proceedings. Biological sciences/The Royal Society, 271: 267–72. 46. Frankham R (2010) Inbreeding in the wild really does matter. Heredity, 104:
47. Ralls K, Ballou J (1983) Extinction: lessons from zoos. In:Schonewald-Cox CM, C h a m b e r s S M , M a c B r y d e B , T h o m a s L ( e d s ) G e n e t i c s a n d conservation: a reference for managing wild animal and plant populations. Benjamin Cummings, Menlo Park, CA
48. Alados CL, Esco´s J (1991) Phenotipic and genetic characters affecting lifetime reproductive success in female Cuvier’s, Dama and Dorcas gazelles. Journal of Zoology, 223:307–321.
49. Frankham R (1995) Conservation genetics. Annual Review of Genetics, 29, 305– 27.
50. Kephart SR (2004) Inbreeding and reintroduction: Progeny success in rare Silene populations of varied density. Conservation Genetics, 5: 49–61. 51. Vilas C, Miguel ESAN, Amaro R, Garcia C (2006) Relative Contribution of
Inbreeding Depression and Eroded Adaptive Diversity to Extinction Risk in Small Populations of Shore Campion. Conservation Biology, 20: 229–238. 52. Iba´n˜ez B, Moreno E, Barbosa A (2011) No inbreeding effects on body size in two
captive endangered gazelles. Mammalian Biology - Zeitschrift fu¨r Sa¨ugetier-kunde, 76: 748–754.
53. Iba´n˜ez B, Moreno E, Barbosa A (2013) Parity, but not inbreeding, affects juvenile mortality in two captive endangered gazelles (I Gordon, H Fritz, Eds,). Animal Conservation, 16: 108–117.
54. Alados CL, Esco´s J (1991) Phenotipic and genetic characters affecting lifetime reproductive success in female Cuvier’s, Dama and Dorcas gazelles. Journal of Zoology, 223:307–321.
55. Ruiz-Lo´pez MJ, Gan˜an N, Godoy JA, Del Olmo A, Garde J, et al. (2012) Heterozygosity-fitness correlations and inbreeding depression in two critically endangered mammals. Conservation Biology: the journal of the Society for Conservation Biology, 26: 1121–9.
56. Swindell WR, Bouzat JL (2005) Modeling the adaptive potential of isolated populations: experimental simulations using Drosophila. Evolution - Interna-tional Journal of Organic Evolution, 59: 2159–69.
57. Latta RG (2008) Conservation genetics as applied evolution: from genetic pattern to evolutionary process. Evolutionary Applications, 1: 84–94. 58. Frankham R, Ballou JD, Briscoe DA (2002) Introduction to conservation
genetics. Cambridge University Press, Cambridge.
59. Sgro` CM, Lowe AJ, Hoffmann AA (2011) Building evolutionary resilience for conserving biodiversity under climate change. Evolutionary Applications, 4: 326–337.
60. Weeks AR, Sgro CM, Young AG, Frankham R, Mitchell NJ, et al. (2011) Assessing the benefits and risks of translocations in changing environments: a genetic perspective. Evolutionary Applications, 4: 709–725.
61. Araki H, Cooper B, Blouin MS (2007) Genetic effects of captive breeding cause a rapid, cumulative fitness decline in the wild. Science, 318: 100–3.
62. Frankham R (2008) Genetic adaptation to captivity in species conservation programs. Molecular Ecology, 17: 325–33.
63. Christie MR, Marine ML, French RA, Blouin MS (2012) Genetic adaptation to captivity can occur in a single generation. Proceedings of the National Academy of Sciences of the United States of America, 109: 238–42.
64. Lerp H, Wronski T, Pfenninger M, Plath M (2011) A phylogeographic framework for the conservation of Saharan and Arabian Dorcas gazelles (Artiodactyla: Bovidae). Organisms Diversity & Evolution, 11: 317–329.
65. Gaubert P, Bloch C, Benyacoub S, Abdelhamid A, Pagani P, et al. (2012) Reviving the African wolf Canis lupus lupaster in North and West Africa: a mitochondrial lineage ranging more than 6,000 km wide. PloS One, 7: e42740. 66. Brito JC, Godinho R, Martı´nez-Freirı´a F, Pleguezuelos JM, Rebelo H, et al. (2013) Unravelling biodiversity, evolution and threats to conservation in the Sahara-Sahel. Biological reviews of the Cambridge Philosophical Society, 1, doi: 10.1111/brv.12049
67. Endler JA (1977) Geographic variation, speciation, and clines. Princeton Univ. Press, Princeton, NJ.
68. Hedrick PW (2006) Genetic Polymorphism in Heterogeneous Environments: The Age of Genomics. Annual Review of Ecology, Evolution, and Systematics, 37: 67–93.
69. Hoekstra HE, Drumm KE, Nachman MW (2004) Ecolgiocal Genetics of Adaptive Color polymorphism in pocket mice. Evolution, 58: 1329–1341. 70. Mullen LM, Hoekstra HE (2008) Natural selection along an environmental
gradient: a classic cline in mouse pigmentation. Evolution; international journal of organic evolution, 62: 1555–70.
71. Boratyn´ski Z, Brito JC, Campos JC, Karala M, Mappes T (2014) Large spatial scale of the phenotype-enviromental color matching in two cryptic species of African desert Jerboas. PloS One, 9 (4): e94342.
72. Gratten J, Pilkington JG, Brown EA, Beraldi D, Pemberton JM, et al. (2010) The genetic basis of recessive self-colour pattern in a wild sheep population. Heredity, 104: 206–14.
73. Schmutz SM, Berryere TG (2007) Genes affecting coat colour and pattern in domestic dogs: a review. Animal Genetics, 38: 539–49.
74. Cieslak M, Reissmann M, Hofreiter M, Ludwig A (2011) Colours of domestication. Biological reviews of the Cambridge Philosophical Society, 86: 885–99.
75. Gasse F (2000) Hydrological changes in the African tropics since the Last Glacial Maximum. Quaternary Science Reviews, 19: 189–211.
76. Petit RJ, Excoffier L (2009) Gene flow and species delimitation. Trends in Ecology & evolution, 24: 386–93.
77. Newby JE (1984) Larger mammals of the Sahara. In Cloudsley-Thompson, J. L. (ed.). Sahara Desert. Key Environments Series, Pergamon Press, Oxford. 348 pp.
78. Stanley-Price M (1989) The Arabian oryx in Oman, Cambridge University Press, New York
79. Newby JE (1978) The Ecological Resources of the Ouadi Rime´ Ouadi Achim Faunal Reserve, Chad. Direction des Parcs Nationaux, N’Djame´na. 80. Effron M, Bogart MH, Kumamoto AT, Benirschke K, Box PO (1976)
Chromosome studies in the mammalian subfamily antilopinae, Genetica, 46: 419–444.
81. Arroyo Nombela J, Rodriguez Murcia C, Abaigar T & Vericad J (1990) GTC-banded karyotype of Gazella dama mhorr. Z Sa¨ugetierkunde, 55: 194–201. 82. Vassart M, Greth A, Durand V, Cribiu E (1993) An unusual Gazella dama
karyotype. Annales de Ge´ne´tique, 36: 117–111.
83. Vassart M, Se´gue´la A, Hayes H (1994) Chromosomal evolution in gazelles. The Journal of Heredity, 86: 216–27.
84. Lawson DJ, Hellenthal G, Myers S, Falush D (2012) Inference of population structure using dense haplotype data. PLoS genetics, 8: e1002453.