Challenges for Performance Assessment and Improvement in Primary Health Care: The Case of the Portuguese Health Centres
Carla A. F. Amado* and Sérgio P. Santos
Centre for Advanced Studies in Economics and Econometrics Faculty of Economics, University of Algarve
Faculty of Economics, University of Algarve Campus de Gambelas, Edifício 9, 8005-139 Faro, Portugal
E-mail: [email protected]; [email protected] Tel: +351 289 817571
Fax: +351 289 800064
* Corresponding author.
Abstract
Primary care is currently at the heart of health service policy, both in Portugal and internationally. At the same time, interest in the measurement of efficiency of health care delivery has increased considerably. However, very few studies have focused specifically on performance assessment in primary health care provision. In this paper we aim to contribute to a discussion regarding appropriate ways to compare the performance of primary health care providers. Following a review of the literature, a conceptual framework for performance assessment of health centres is developed and tested using the Portuguese case. Our empirical analysis uses data from 2004 and 2005 for all the Portuguese health centres and compares the geographical equity of access to services, technical efficiency and quality of services across District Health Authorities. Data Envelopment Analysis is the technique used to measure technical efficiency. From our empirical analysis, we conclude that there is evidence of large variation in equity of access to services, in technical efficiency and quality of services across District Health Authorities. Our findings suggest that a better use of resources could lead to more and improved services. Whilst formative evaluation could contribute to this, the challenge is to engage health care professionals in the evaluation exercise.
Keywords: Efficiency, Equity of access, Quality, Data Envelopment Analysis; Primary health care.
This is a post-print (i.e. final draft post-refereeing) of a manuscript submitted to Health Policy.
To cite this article: Amado, C.A.F. and S.P. Santos (2009). “Challenges for performance assessment and improvement in primary health care: The case of the Portuguese health centres”. Health Policy, 91: 43-56. To link to this article: http://dx.doi.org/10.1016/j.healthpol.2008.11.008
Introduction
The recognition that primary care is a very important part of any national health care delivery system and the acknowledgement that primary care provision is responsible for a significant proportion of the health care budget, suggest that efforts should be made to identify systematic variations in performance between primary care providers, with the objective of improving performance across the system.
However, there are considerable challenges in performing an informative and fair comparison. Perhaps the greatest challenge in comparing primary care providers relates to the nature of primary health care provision. Whilst a hospital is an organisation with clear boundaries, where patients are admitted and discharged; primary health care delivery is an open community-based system with unclear boundaries. Furthermore, primary care has a fundamental role in terms of providing a long-term, continuing and generalist support towards individuals and families [1]. This long-term, continuous relationship is essential to build trust between the health care professionals and the patients and is one of the founding principles of primary care. In attempting to evaluate primary care providers, it is therefore important to take this aspect into account and aim to develop a framework that recognises the holistic nature of primary care.
Several frameworks have been proposed to evaluate primary care providers. These frameworks tend to rely on the use of Performance Indicators (PIs) detailing different aspects of quality in health care delivery. Donabedian [2] provides a framework that can be used to classify the different PIs into categories. This framework is characterised by three essential elements in health care delivery: structure, process and outcome. More recently, other techniques such as Data Envelopment Analysis (DEA) and Stochastic Frontier Analysis (SFA) have been used in order to take account of the multiple inputs and outputs involved in health care delivery.
Since the mid-1980s, DEA has been used increasingly to measure performance of health care services. Hollingsworth et al. [3] review 91 applications of DEA to health care, showing that most of the applications of DEA published until 1997 had focused on hospitals. Only 5 out of these 91 studies had focused on primary care. This tendency to apply DEA to compare the efficiency of hospitals has continued and Li and Rosenman [4] review this literature. More recently Chilingerian and Sherman [5] review applications of DEA to health care. A full review of the DEA applications to hospitals is,
however, outside the scope of this paper, as our focus is on primary care evaluation. Examples of studies that have applied DEA within the context of primary health care include: Pina and Torres [6], Szczepura, et al. [7], Thanassoulis et al. [8], Bates et al. [9], Luoma et al. [10], Salinas-Jiménez and Smith [11], Garcia et al. [12], Giuffrida [13], Goñi [14], Buck [15], Giuffrida and Gravelle [16], Zavras et al. [17], and Rosenman and Friesner [18].
A common feature of most of the studies that have applied DEA to primary health care is that the number of patients registered is used to measure output. The use of the number of patients registered is particularly common in America, due to the publication of this data by Health Maintenance Organisations. There are two problems associated with using the number of registered patients to compare the performance of primary health care providers. Firstly, it assumes that all the patients registered with a particular health care organisation are receiving the necessary services. Secondly, it assumes that the services provided to the patients registered are appropriate and of similar quality. Recognising that having patients on the lists does not necessarily mean service delivery, some studies have used the number of consultations undertaken as an output measure in primary health care. However, using the full-time equivalent health care professionals as inputs and using the number of consultations as outputs will lead to a system that rewards shorter consultations. Additionally, despite the fact that a consultation is an opportunity for contact with the health care professional, frequent consultations, per se, do not mean better primary health care. It is desirable to assess the appropriateness of the consultations in terms of the delivery of the services deemed necessary to improve health outcomes. Furthermore, it is desirable to assess the effectiveness and quality of the services provided by evaluating the outcomes of care.
Amado and Dyson [19] review the performance assessment studies in primary health care and conclude that most of them focus on structure and outputs, without consideration of outcomes – the ultimate measure of performance – and tend to be of a summative rather than formative nature.
In fact, despite the rising number of studies applying DEA to health care, only a few studies have attempted to compare the performance of several primary health care units in order to provide some guidance regarding the best way to evaluate and improve performance in this context. In this paper we aim to contribute to the discussion
regarding appropriate ways to compare the performance of primary care providers. We suggest a conceptual framework for performance assessment in primary care. This framework aims to establish a link between the local needs, the resources used, the services delivered and the outcomes achieved in primary care. Based on the relationships between these elements, four essential performance assessment criteria are defined: equity of access, technical efficiency, service effectiveness and cost effectiveness.
Our empirical analysis uses data from 2004 and 2005 for all the Portuguese health centres and compares the equity of access to services, the technical efficiency and the quality of the services provided by the District Health Authorities (DHAs). DEA is the methodology used to measure technical efficiency given the fact that it can handle multiple inputs and multiple outputs without requiring the specification of a functional form. After obtaining the relative scores for equity, efficiency, and quality we discuss some of the factors that may explain the results obtained.
This paper makes a contribution on several grounds. Firstly, by discussing the issues involved in developing appropriate models to assess and improve the performance of primary health centres, it sheds light onto an issue in which there is a considerable interest. Secondly, by providing empirical evidence regarding the equity, the efficiency and the quality of the Portuguese DHAs, it contributes to highlight areas that require further investigation. This empirical evidence can be important both for policy making and for research.
The rest of the paper is organised as follows. The Portuguese Health Care System is described in the next section. The third section briefly introduces DEA, discussing the reasons for using this methodology in this context. The fourth section presents the conceptual framework suggested to evaluate primary health care providers, and discusses the criteria proposed for evaluation. The fifth section discusses the data available regarding the activity of the Portuguese health centres and presents the measure used to assess the equity of access, the DEA model used to measure technical efficiency and the indicator adopted to assess quality of services. In the sixth section the results are presented and discussed. The conclusion summarises the main results, discusses the potential of DEA for formative evaluation and presents suggestions for further research.
The Portuguese Health Care System
In Portugal the majority of the population receives health care from the National Health Service (NHS). The Portuguese NHS was founded in 1979 and aims to provide health care, almost free at the point of delivery, with universal coverage, being funded mainly by general taxation. In parallel with the NHS, there are several ‘corporatist’ health insurance sub-systems and a voluntary health insurance system. Based on a report by the Organisation for Economic Co-operation and Development [20], it is estimated that the ‘corporatist’ health insurance systems cover around 25% of the Portuguese population (mainly civil servants and employees of private financial institutions). The voluntary insurance system covers only around 2% of the population [20]. The population covered by the health insurance subsystems also have access to the NHS services, benefiting from double or triple coverage. Figure 1 presents the basic structure of the Portuguese NHS. For further details on the key institutions and relationships in the Portuguese health care system, and the reforms it has faced in the last three decades, the reader is referred to Oliveira and Pinto [21].
Figure 1 - The Structure of the Portuguese National Health Service
In 2005 primary care services were provided in 351 health centres and 254 Permanent Health Units (Serviços de Atendimento Permanente – SAPs). These centres are accountable to one of the 18 DHAs. People can choose a General Practitioner (GP) or family doctor from a health centre in their area of residence, with whom they register. This doctor will be the patient designated family doctor for all consultations. However, around 10,6% of the patients are not given a chance to register with a designated doctor,
Financeira da Saúde - IGIF [22]). Patients that cannot register with a designated doctor may still register with the health centre but will be seen by any available doctor at the time of the consultation.
According to the report on the activity of the health centres published by the IGIF [22], on average, in 2005, each health centre had 30,388 registered patients and employed 20 doctors and 20 nurses. The average utilisation rate of the services provided by the health centres was 60%. The average list size per doctor was 1,497 registered patients, with an average of 927 regular users per doctor. In 2005, each health centre provided around 75,000 consultations in the health centre and 15,000 emergency consultations in the Permanent Health Units (SAPs). The average annual total costs of each health centre was €6,674,690, with an average cost per patient of €216,5.
The next section briefly introduces the methodology used – DEA - and discusses its appropriateness to measure efficiency in primary health care.
Data Envelopment Analysis and Its Use in Primary Health Care
DEA is a non-parametric technique used to measure the efficiency of Decision Making Units (DMUs) and was first proposed by Charnes et al. [23]. This initial DEA model assumes constant returns to scale (CRS). Later on, Banker et al. [24] proposed a DEA model that assumes the existence of variable returns to scale (VRS), which is applicable when returns to scale exist.
The DEA technique uses a production metaphor. It considers that each DMU is engaged in a transformation process, where by using some inputs (resources) it is trying to produce some outputs (goods or services). With the provision of these services, the DMU intends to achieve certain outcomes, which measure the impact of the services in the patients. One of the interesting features of DEA is that it allows each unit to identify a benchmarking group; that is, a group of units that are following the same objectives and priorities, but performing better. In this regard DEA aims to respect the priorities of each DMU by allowing each one of them to choose the weight structure for inputs and outputs that most benefits its evaluation. As a result, it aims to classify each unit in the best possible light in comparison to the other units.
The formulation of the CRS model to determine the input-oriented radial efficiency measure of DMU Q is presented below:
where S is the number of DMUs; I is the number of outputs; yis is the amount of outputs
i generated by unit s; J is the number of inputs; xjs is the amount of input j used by unit
s; wi is the weight associated with output i; vj is the weight associated with input j; ε is a
small positive number. HQ is the radial efficiency measure for DMU Q. HQ ∈
[ ]
0 ,1, andwill be equal to 1 if the DMU is efficient, and smaller than 1 if the DMU is inefficient when compared with the other DMUs. A comprehensive review of the DEA technique can be found in Boussofiane et al. [25], Cooper et al. [26] and Cooper et al. [27].
While the use of DEA in the primary health care context faces several difficulties, some of which will be discussed later, there are also several distinct reasons that make it suitable and convenient for comparing the performance of primary health centres.
Firstly, DEA can handle the existence of several non-commensurate inputs and outputs, without requiring unit prices for each of them. This is a clear advantage in health care studies, when we consider that we are usually confronted with processes characterised by the use of several resources, involved in the delivery of several distinct services, in order to achieve several distinct outcomes. Whilst unit costs for the resources may be obtainable, we do not have information regarding the unit value of outputs and outcomes.
Secondly, DEA uses all the data available to construct a best practice empirical frontier, to which each non-optimal production point is compared. This is a distinct advantage when compared to regression-based techniques that focus on the average units and construct an average production function.
. ,..., 1 , ; ,..., 1 , , . ... ,... 1 , 1 o subject t Max 1 1 1 1 J j with j I with i i v w S Q s with s x v y w x v y w H j i J j js j I i is i J j jQ j I i iQ i Q = ∀ = ∀ ≥ = ∀ ≤ =
∑
∑
∑
∑
= = = = εThirdly, in contrast with parametric techniques, such as Stochastic Frontier Analysis, DEA does not require the specification of the functional form that links the inputs to the outputs. Moreover, if information is available, it allows the incorporation of several distinct assumptions regarding the relationships operating at the frontier, regarding the returns to scale, the disposability of the inputs and outputs, and the convexity of the production function.
Fourthly, the performance of DMUs can be assessed by using several alternative orientations to the best practice frontier, depending on the context of the study. The DEA projections of the best practice frontier can reflect an output maximisation, an input minimisation, or a combination of both.
Finally, given that most DEA models can be conceptualised as a linear programme, a vast range of useful information becomes available for research, decision-making and policy making. This information is very valuable for performance improvement.
Despite all these advantages, DEA does have some limitations that need to be taken into account. Firstly, standard DEA models do not take into account stochastic variation in the data and assume that any deviation to the best practice frontier is inefficiency. Progress has been made in the development of stochastic DEA models [28], but these tend to require rich data sets. Secondly, DEA assumes that it is possible to fully characterise the production of health care by identifying a set of inputs, outputs and outcomes of production. However, some of the outputs and outcomes of primary care are not measurable. Furthermore, there are an extensive number of factors operating at different levels which impact on this transformation and which may lead to the violation of the linear input-output relationship. Finally, DEA assumes proper envelopment of all the DMUs. That is, a meaningful measure of efficiency can only be calculated if the DMU under evaluation has a comparison set. Otherwise, the DMU will be classified as efficient, simply because no comparison can be established. This problem can, however, be solved by the introduction of weight restrictions regarding the admissible ranges of input or output weights. Awareness of these limitations and of their potential impact on the results is necessary if useful information is to be obtained. Furthermore, it is fundamental to use this information in a formative rather than summative way.
Evaluation in public services is often of a summative nature involving rankings, classifications and targets leading to dysfunctional behaviour [29]. In this paper we
argue that evaluations of a formative nature aimed at developing a better understanding of the structures and processes are more appropriate for the development of better services. Furthermore, evaluation in primary care needs to be inclusive of local needs, resources used, outputs and outcomes, and we believe that DEA provides the basis of an appropriate methodology to compare different providers.
The next section discusses the conceptual framework we suggest to evaluate primary health care providers, as well as the models and indicators we propose to compare the equity of access, the technical efficiency and the quality of the Portuguese health centres.
A Conceptual Framework to Compare Primary Health Care Providers
In terms of public services provision, performance assessment is legitimate from the perspectives of several stakeholders of the services. Williams [30] identified a long list of potential stakeholders for a National Health Service, such as the patients and their representatives, the taxpayers, the professionals working in the NHS, local government bodies and the Department of Health. Each one of these groups of people has its own set of objectives for the NHS and these should form the basis for the development of different performance assessment frameworks. Fitzgerald and Storbeck [31] pointed out the importance of addressing the question of to whose interests organisations are answering, and we see this as a very important part of any performance assessment exercise.
In this study, we are concerned with performance assessment from the perspective of the primary health care centres responding to external forces, in particular, Government pressure to improve primary care delivery for the local population using the limited resources available.
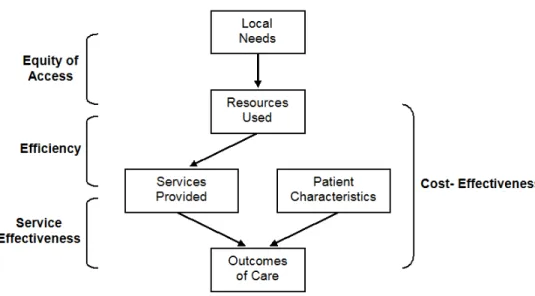
Figure 2 presents a simplified version of the conceptual framework we propose to compare primary care providers. This framework presents five essential elements that need to be measured in order to compare primary care providers: local needs, resources used, services delivered, patient characteristics and the outcomes achieved. We shall now discuss each one of these elements in more detail.
Figure 2 - Conceptual Framework to Compare Primary Care Providers
Williams [32] and Culyer [33] proposed an early definition of need, which in our view, is appropriate. This definition equates need for health care with the patient’s capacity to benefit from the consumption of health care. In this respect, an assessment of the local needs of a health centre involves the identification of the patients who can benefit from the consumption of primary health care. A crude measure of local need for a health centre may be the number of residents in the area served by the health centre, as we believe that everyone can benefit to a greater or lesser extent from primary health care. Alternatively, if we want a measure that takes into account the willingness of the residents to use public health care, we may consider that the number of patients registered with the health centre is the most basic measure of need for that centre.
The resources used in primary health care involve the full-time equivalent of the doctors, nurses and other professionals, as well as the expenditure on all means of diagnosis, the expenditure on medication, and other types of expenditure.
The services delivered by each primary health centre can be measured using indicators relating to their activity, such as the number of consultations provided, the number of vaccinations applied, the number of minor surgeries undertaken, and so on.
Researchers investigating health care performance are aware of the need to control patient case-mix, in order to obtain fairer comparisons. However, obtaining data to develop appropriate indicators of case-mix for primary care is still a challenge.
Indicators such as the age of the patients, the socio-economic group to which they belong, as well as the number of patients diagnosed with chronic conditions have been used to control case-mix.
The last element, outcomes achieved, despite being essential for the formative evaluation of primary care providers, is the most difficult element to measure in primary health care. The outcomes aim to measure the impact of the health care provided. This impact may be physical or psychological, and may occur immediately after the service is delivered, or with a delay. Furthermore, the outcomes of care may be of a subjective nature, posing increased challenges for measurement.
From an evaluation of these five elements, we can define four criteria that can be used for formative evaluation in health care: (1) equity of access, (2) efficiency, (3) service effectiveness and (4) cost-effectiveness. An important aspect we would like to emphasise is that the measurement of the different dimensions of performance requires the use of different models. A single model would not be appropriate to measure all the dimensions as they relate to different parts of the process.
Equity is concerned with justice and fairness in the treatment of cases. Aristotle provided two essential definitions of equity. Horizontal equity: equal treatment of equals; and vertical equity: unequal but fair treatment of unequals. In this paper we are concerned with the measurement of horizontal equity. A horizontally equitable health care system provides services of the same standard independently of, for example, patients’ income group, age, gender, race and area of residence. Horizontal equity of access measures whether patients from different groups have similar access to the services they equally need. This has also been the interpretation given by Portuguese Governments in terms of equity of access [34].
Efficiency is related to the notion of ‘value-for-money’. It is a measure of how well each provider is able to use its resources to deliver the maximum possible quantity of relevant services (output-orientation), or a measure of how well each provider is able to provide a certain level of services, whilst minimising the resources used (input-orientation).
Effectiveness, in its turn, is related with the achievement of the objectives established. Schinnar et al. [35] proposed an alternative definition of service effectiveness that we find very useful. They defined effectiveness as the ratio of
outcomes achieved to services delivered and proposed the use of DEA to compare the service effectiveness of different organisations. This is done by using an output-oriented DEA model, which aims to maximise the level of outcomes achieved, given the amount of services delivered; and aims to evaluate the ‘added value’ of the services delivered, independently of the resources used. Similarly, cost-effectiveness can also be measured by using a DEA model (e.g. [36]), which aims at maximising the level of outcomes achieved, given the level of expenditure of the provider.
Having discussed the conceptual framework, we shall now discuss the data available to compare the Portuguese DHAs, and the measures and models used in our empirical study.
Data, Measures and Models
The data used in this study refers to the activity of the Portuguese health centres during the year 2005 and to the patients’ satisfaction with the services delivered in 2004, and it was obtained from the IGIF [22] and from the Portuguese EUROPEP website (http://europep.fe.uc.pt), respectively. Our main unit of analysis is the DHA, despite the fact that we have run the models at the level of the health centres to better understand the patterns in the results. These results were then aggregated to the level of the DHAs.
In 2005, there were 351 health care centres in Portugal, belonging to 18 DHAs. We have compared these 351 centres in terms of equity of access. With regards to the efficiency analysis, we had to exclude 14 centres from the analysis, due to missing values in the dataset.
In order to analyse effectiveness, we have used information regarding patients’
satisfaction with the quality of the services, collected by the EUROPEP instrument [37]. This is an internationally validated standardised instrument developed by the European Task Force on Patients Evaluations of General Practice for measuring patients' evaluations of general practice care. The EUROPEP instrument encompasses 23 outcome questions grouped into five major dimensions: (1) Patient-doctor interaction; (2) Medical care; (3) Information and support; (4) Continuity and cooperation; and (5) Organisation of services. Each question has a 5 point Likert answering scale, ranging
from ‘very poor’ to ‘excellent’. The EUROPEP instrument also considers a global satisfaction indicator, resulting from the clustering of these dimensions and which varies between 0 and 100.
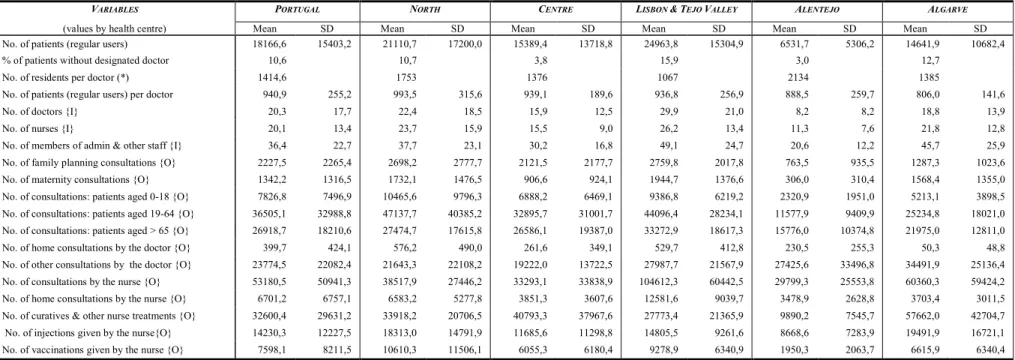
Table 1 presents a descriptive summary of the data aggregated for Portugal and also aggregated by Regional Health Areas.
From this table, one can see that there are considerable discrepancies across regional health areas. For example, whilst the average list size for a doctor in the region of the Algarve is 806 patients, this average raises to 993,5 patients in the North region. From another side, we can see that the percentage of patients without a designated doctor is also highly variable between regions. Whilst in the region of Alentejo only 3% of the patients do not have a designated doctor, in the region of Lisbon and Tejo Valley this percentage rises to 15,9. These discrepancies are even more significant across the DHAs and across the centres. In order to investigate these differences in more detail, we have built DEA models to measure the relative efficiency across centres, and have also analysed the horizontal equity of access and quality across centres. We will now discuss the measures and models used in our empirical analysis.
Our measure of horizontal equity of access across centres is the percentage of registered patients who have a designated family doctor. We recognise that this is a crude measure of horizontal equity. The most important limitation is that it focuses solely on geographical equity, leaving out other important dimensions relevant to equity assessment. Nevertheless, at a first level, it is important to investigate the percentage of patients who have a designated family doctor. Identifying the coverage rate of each centre is essential because full coverage is one of the founding objectives of the Portuguese NHS [38] and it is one of the Portuguese Ministry of Health key-initiatives to improve primary care services [39]. If a registered patient does not have a designated family doctor, it means that despite the fact that the patient can go for a consultation with one of the available doctors, he/she will not be able to develop a long-term relationship with the doctor, which is desirable in primary care.
Table 1. Summary Statistics for the Variables used in the Study: National and Regional Values for 2005
VARIABLES PORTUGAL NORTH CENTRE LISBON &TEJO VALLEY ALENTEJO ALGARVE
(values by health centre) Mean SD Mean SD Mean SD Mean SD Mean SD Mean SD
No. of patients (regular users) 18166,6 15403,2 21110,7 17200,0 15389,4 13718,8 24963,8 15304,9 6531,7 5306,2 14641,9 10682,4
% of patients without designated doctor 10,6 10,7 3,8 15,9 3,0 12,7
No. of residents per doctor (*) 1414,6 1753 1376 1067 2134 1385
No. of patients (regular users) per doctor 940,9 255,2 993,5 315,6 939,1 189,6 936,8 256,9 888,5 259,7 806,0 141,6
No. of doctors {I} 20,3 17,7 22,4 18,5 15,9 12,5 29,9 21,0 8,2 8,2 18,8 13,9
No. of nurses {I} 20,1 13,4 23,7 15,9 15,5 9,0 26,2 13,4 11,3 7,6 21,8 12,8
No. of members of admin & other staff {I} 36,4 22,7 37,7 23,1 30,2 16,8 49,1 24,7 20,6 12,2 45,7 25,9
No. of family planning consultations {O} 2227,5 2265,4 2698,2 2777,7 2121,5 2177,7 2759,8 2017,8 763,5 935,5 1287,3 1023,6
No. of maternity consultations {O} 1342,2 1316,5 1732,1 1476,5 906,6 924,1 1944,7 1376,6 306,0 310,4 1568,4 1355,0
No. of consultations: patients aged 0-18 {O} 7826,8 7496,9 10465,6 9796,3 6888,2 6469,1 9386,8 6219,2 2320,9 1951,0 5213,1 3898,5 No. of consultations: patients aged 19-64 {O} 36505,1 32988,8 47137,7 40385,2 32895,7 31001,7 44096,4 28234,1 11577,9 9409,9 25234,8 18021,0 No. of consultations: patients aged > 65 {O} 26918,7 18210,6 27474,7 17615,8 26586,1 19387,0 33272,9 18617,3 15776,0 10374,8 21975,0 12811,0
No. of home consultations by the doctor {O} 399,7 424,1 576,2 490,0 261,6 349,1 529,7 412,8 230,5 255,3 50,3 48,8
No. of other consultations by the doctor {O} 23774,5 22082,4 21643,3 22108,2 19222,0 13722,5 27987,7 21567,9 27425,6 33496,8 34491,9 25136,4 No. of consultations by the nurse {O} 53180,5 50941,3 38517,9 27446,2 33293,1 33838,9 104612,3 60442,5 29799,3 25553,8 60360,3 59424,2 No. of home consultations by the nurse {O} 6701,2 6757,1 6583,2 5277,8 3851,3 3607,6 12581,6 9039,7 3478,9 2628,8 3703,4 3011,5 No. of curatives & other nurse treatments {O} 32600,4 29631,2 33918,2 20706,5 40793,3 37967,6 27773,4 21365,9 9890,2 7545,7 57662,0 42704,7 No. of injections given by the nurse{O} 14230,3 12227,5 18313,0 14791,9 11685,6 11298,8 14805,5 9261,6 8668,6 7283,9 19491,9 16721,1 No. of vaccinations given by the nurse {O} 7598,1 8211,5 10610,3 11506,1 6055,3 6180,4 9278,9 6340,9 1950,3 2063,7 6615,9 6340,4
(*) Number of residents based on the values estimated by the Instituto Nacional de Estatistica (INE NUTS 2005)
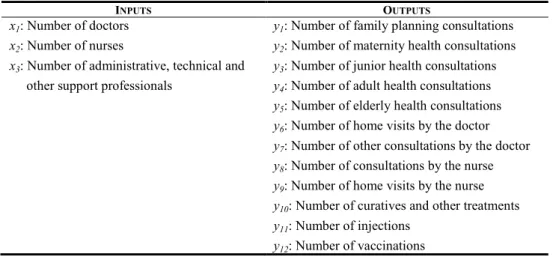
Table 2 presents the DEA model used to measure technical efficiency of the health centres. The inputs focus on the staff employed by each centre, given that this was the only type of data available. We are aware of the fact that the costs of staff only account for a proportion of the total costs of the health centres [40], and it would be interesting to include information regarding the expenditure on medication and on other means of diagnosis. However, at the moment, data regarding the other types of expenditure for each centre is not available. As soon as this data becomes available it would be valuable to include it in the analysis. In spite of this limitation, which has been experienced in other studies (e.g., [8, 13, 17]) we believe that the model adopted is appropriate because the outputs selected relate exclusively with the inputs considered.
The outputs focus on the activity of the centres. We are assuming that all the services provided by each centre are of similar relevance and quality to the local community. Obviously, a post-evaluation study should investigate the appropriateness of this assumption. This is the subject of future research. Our output measures have been separated by type of consultations and by patients’ age group, in order to control the case-mix. We have used an output-oriented model because we believe that the health centres should aim at delivering the maximum number of services with the available staff. A CRS model was used because we could not find evidence regarding the existence of economies of scale.
Table 2. Variables used in the DEA Model to Measure Technical Efficiency
INPUTS OUTPUTS
x1: Number of doctors
x2: Number of nurses
x3: Number of administrative, technical and
other support professionals
y1: Number of family planning consultations
y2: Number of maternity health consultations
y3: Number of junior health consultations
y4: Number of adult health consultations
y5: Number of elderly health consultations
y6: Number of home visits by the doctor
y7: Number of other consultations by the doctor
y8: Number of consultations by the nurse
y9: Number of home visits by the nurse
y10: Number of curatives and other treatments
y11: Number of injections
We have included five weight restrictions in the efficiency model, in order to ensure meaningful results and to account for the production trade-offs between inputs and outputs [41]. The weight restrictions included were the following:
−v1+v2 ≤0 (Restriction 1) −v1+v3≤0 (Restriction 2) −v2 +v3≤0 (Restriction 3) 7 6 5 4 3 2 1 3 1 v w w w w w w w v + = + + + + + + (Restriction 4) 12 11 10 9 8 3 2 v w w w w w v + = + + + + (Restriction5)
We have chosen to include conservative weight restrictions, given that we did not have the information necessary to place tighter restrictions in terms of feasible production trade-offs. Our main concern was to ensure meaningful results. In this respect, the first three restrictions aim to establish meaningful production trade-offs between the three inputs. The first restriction states that if the number of nurses decreases by one and the number of doctors increases by one, there should be no detriment to the level of outputs. We are assuming that the work carried out by a nurse could also be carried out by a doctor, but the reverse is not true. The second and third restrictions imply a similar judgement in terms of the production trade-offs between doctors and administrative, technical and support professionals and between nurses and administrative, technical and other support professionals, respectively.
The fourth restriction states that the sum of the weights attributed to the number of doctors and the number of administrative, technical and other support professionals has to be equal to the sum of weights attributed to all outputs related with the activity of the doctors. In this respect, it states that it is possible to increase the outputs related to the activity of the doctors if the number of doctors plus the number of administrative, technical and support staff increase accordingly. Similarly, the fifth restriction states that the sum of the weights attributed to the number of nurses and the number of administrative, technical and other support professionals has to be equal to the sum of weights attributed to all outputs related with the activity of the nurses. In this respect, we do not allow a particular health centre to place a very high weight on the number of nurses, whilst completely ignoring the outputs related with the activity of the nurses. We
have considered that the administrative, technical and other support professionals are auxiliary staff for the activity of the doctors and nurses.
In order to assess the effectiveness of the services provided by the health centres we have used the EUROPEP global satisfaction indicator previously mentioned. Certainly, there are many different indicators of outcomes of treatment which offer opportunities for measurement. However, as pointed out by Grol and Wensing [37]
“in improving the quality of health care the ultimate criterion is the extent to which health care succeeds in meeting the (subjective and objective) needs of patients well. At the end of the day it is the patient who determines whether care provided helped to improve their health status or quality of life. Not only the outcomes of care in terms of health gains or needs met are important in this respect, but also the ways in which care is provided: the accessibility of care, the organisation of services, the attitude of care providers, and their education of and communication with the patient.”(Grol and Wensing [37]: 9)
The EUROPEP instrument tries to capture patients’ views regarding these dimensions. The information about the satisfaction measures for each health centre is, however, confidential and, therefore, only information regarding the global measure of patients’ satisfaction by DHAs is reported and discussed in this paper. As soon as data becomes available regarding the outcomes of care, we believe that it would be very interesting to undertake a new study evaluating the service effectiveness and the cost-effectiveness of the health centres.
Analysis of Results Equity of Access
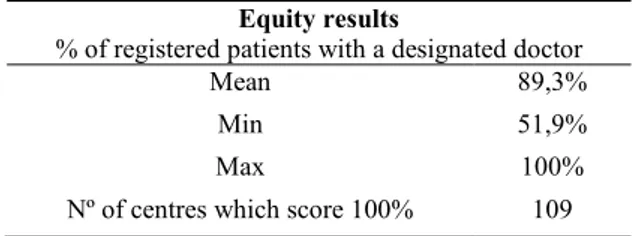
As previously discussed, our measure of horizontal equity of access is the percentage of registered patients with a designated doctor. Table 3 presents a summary of the results obtained for the 351 centres compared.
Table 3. Summary of the Equity Results across the Centres
Equity results
% of registered patients with a designated doctor
Mean 89,3%
Min 51,9%
Max 100%
Nº of centres which score 100% 109
The analysis of the results in terms of equity suggests that there is significant variation in terms of the percentage of patients with designated doctors across centres. The average rate of patients with a designated doctor in 2005 was 89,3%. Whilst there were 109 health centres where all registered patients had a designated doctor, there were other centres where a significant proportion of patients were unable to develop a long-term relationship with a doctor. For example, if a patient is registered with Amora health centre, belonging to the DHA of Setúbal, there is nearly 50% chance of not having a designated doctor.
Map 1, presented below, shows the equity results for each of the DHAs in Portugal. When we analyse the results by region, we conclude that the worst results in terms of equity of access are visible in the DHAs of Setúbal, Porto and Lisbon, with average equity scores of 73,3%, 85,8% and 87%, respectively. These are regions with a relatively high population density, which can somehow explain the difficulty in having a designated doctor for all registered patients.
From another side, the DHAs with the highest equity scores are Bragança, Castelo Branco and Guarda, with average scores of 100%, 99,8% and 99,5%, respectively. These are DHAs located in the interior of the country, with a relatively lower population density. An interesting aspect to analyse is the list size for doctors in these DHAs. Contrary to what we might expect, the list size varies considerably between the DHAs with the highest equity scores. Whilst in Guarda, each doctor has an average list size of 792 patients, in Bragança the average list size of a doctor is 1,032 patients. With a national average of 941 patients per doctor, Guarda presents one of the lowest list sizes per doctor, whilst Bragança presents one of the highest list sizes per doctor. Independently of these discrepancies in the list size, these are two DHAs that are able to designate a doctor to all their patients.
Map 1 - Equity of Access Across DHAs in Portugal
In order to complement the analysis regarding the proportion of registered patients without a designated doctor, from a perspective of geographical equity of access, it is also interesting to investigate the average number of residents per doctor (please refer to Table 1). This analysis can shed some light regarding the existing inequalities in the geographical distribution of doctors. When we analyse this information, we conclude that the region with the highest number of residents per doctor is Alentejo, with an average of 2,134 residents per doctor. However, only an average of 42% of these residents regularly consults with a doctor from a health centre. This contrasts heavily
with the number of residents per doctor in the region of Lisbon and Tejo Valley, where this average is halved (1,067 residents per doctor). Interestingly, in the region of Lisbon and Tejo Valley, around 88% of the residents regularly see a doctor. One possible explanation for these regional asymmetries lies in the population willingness to go to the health centre, which is also influenced by the ease of access to the centre, by cultural factors and by access to information.
It is interesting to compare these results with those obtained by Giraldes [42], relating to the equity in the distribution of doctors in Portugal. In Giraldes’ study it was concluded that there was a lack of doctors in remote areas, with a large number of doctors being concentrated in Lisbon, Porto and Coimbra. Oliveira and Bevan [43] arrived at similar conclusions in terms of the geographic inequities in the distribution of hospital resources in Portugal. They concluded that these three DHAs presented hospital resources above the national mean, because these are the DHAs where the central hospitals are located.
One possible interpretation for our equity results, together with the results from previous studies, is that the concentration of resources in big cities creates its own demand, leaving remote areas relatively deprived from certain services. At the same time, in these remote areas of the interior, a relatively lower proportion of residents register with a health centre, allowing a larger proportion of registered patients to have a designated doctor. This is only one interpretation of the results and we suggest that further investigation is necessary in order to better understand the phenomenon of equity of access across regions in Portugal.
Efficiency
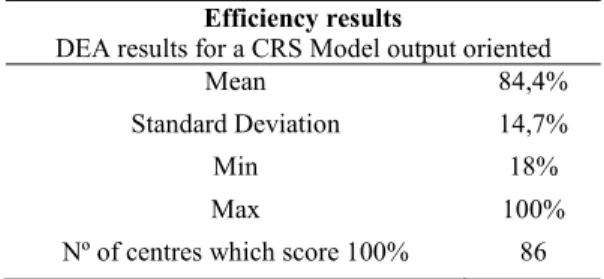
As previously discussed, our analysis of technical efficiency uses an output oriented DEA model, assuming CRS, with the variables detailed in Table 2. A summary of the efficiency results is presented in Table 4 and the average results by DHAs are presented in Map 2.
Table 4. Summary of the Efficiency Results across the Centres
Efficiency results
DEA results for a CRS Model output oriented
Mean 84,4%
Standard Deviation 14,7%
Min 18%
Max 100%
Nº of centres which score 100% 86
The mean efficiency score is 84,4%, with a standard deviation of 14,7%, suggesting that there is significant discrimination in the results. The health centre with the lowest efficiency score belongs to the DHA of Lisbon and Tejo Valley and presents a score of 18% suggesting that its use of resources could be significantly improved. This health centre has chosen to place its highest output weight on the number of nurse consultations, neglecting the outputs related to the activities of the doctors. This is the centre with the lowest list size per doctor (140 patients). This contrasts heavily with the health centre of Avis, which presents the highest list size per doctor (2002 patients). This health centre belongs to the DHA of Portalegre, and has been classified as technically efficient, placing most of its input weight in the number of doctors, and most of its output weight in the number of adult consultations by the doctor. Furthermore, this is a very common weight structure, as Avis is peer to 112 inefficient centres.
When we look at the results of technical efficiency by DHAs (Map 2), we find that Aveiro, Évora and Leiria present the highest results in terms of efficiency. In these DHAs a large proportion of health centres are classified as efficient. In Aveiro, 58% of the centres are classified as efficient. In Leiria and Évora this percentage is 53% and 50% respectively. This contrasts with the DHA of Guarda, which presents the lowest average of efficiency (69,9%), and where only 7% of the centres are classified as technically efficient. The DHA of Beja also scores poorly in terms of its efficient use of resources, with an average score of efficiency of 74,8%, and with only 8% of the centres being classified as efficient. In the DHA of Castelo Branco, although the average efficiency is relatively higher (80,3%), none of the centres is classified as technically efficient.
The DHA of Lisbon, known for its concentration of resources, also presents a relatively poor performance in terms of technical efficiency, with an average score of 79,5%, and with only 13% of the centres classified as efficient.
Map 2 - Technical Efficiency Across DHAs in Portugal
These results suggest that a better use of resources in certain parts of the country could lead to a higher volume of service provision. A post-evaluation study would be necessary to establish learning networks between centres in order to identify processes and practices that may lead to improved efficiency, without compromising the equity of access and the quality of services. In order to investigate this last criterion, we turn our attention now to the analysis of the results of quality of the services across regions.
Quality of Service
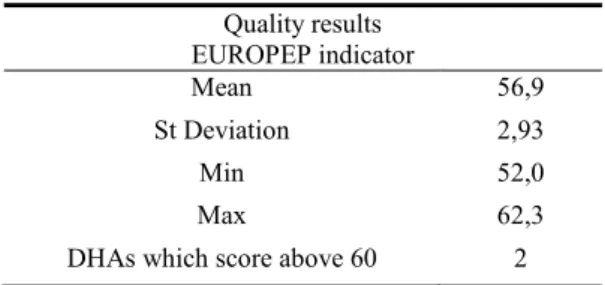
In addition to the equity of access to services, and the efficiency in the use of resources, it is also fundamental to evaluate the quality of the services provided. It is of paramount importance to ensure that the treatment patients receive in a general practice is efficient and accessible, but also that it is of the highest quality. To this purpose, and as previously discussed, we use the EUROPEP global satisfaction index, which reflects patients’ priorities on the quality of care. It has also been designed to provide relevant feedback to general practitioners, patients and health care policy makers at different levels with the aim of stimulating improvements on the primary care systems [37].
The results shown in Table 5 and in Map 3 are based on the answers of 11,166 users of all Portuguese mainland health centres to the EUROPEP questionnaire proposed by the Health Quality Institute in 2003 and conducted by the Centre for the Study and Research in Health at the University of Coimbra. The patients studied comprised patients 18 years of age or older with recent experience of general practice care. Participation was requested after a visit to the practice. Although there is information for each health centre, this information is confidential and, therefore, only information regarding the quality of services of the DHAs is reported and discussed in this section.
Table 5. Summary of the Quality Results across the Centres
Quality results EUROPEP indicator Mean 56,9 St Deviation 2,93 Min 52,0 Max 62,3
DHAs which score above 60 2
Comparing between DHAs it is clear that there exists some asymmetry in the level of satisfaction of the patients with the care they receive. Coimbra, Guarda and Aveiro are the DHAs where patients are most satisfied with the quality of the services received, with global satisfaction indexes of 62,3, 60,1 and 59,6, respectively. These results contrast significantly with the results of Viseu, Setúbal and Leiria, which are the DHAs with the lowest satisfaction rates. In these DHAs the global satisfaction indexes are 52,0, 52,5 and 53,5 respectively.
Map 3 – Quality of Services Across DHAs in Portugal
A more detailed analysis of the data provided in the Portuguese EUROPEP website (http://europep.fe.uc.pt) allows us to verify that in Coimbra DHA the overall quality of 8 of its 22 health centres was considered excellent, and around 78% of the respondents rated the level of care received as good, very good or excellent and 11% rated it as very poor. In Viseu DHA the number of respondents that rated the care received as good, very good or excellent was only of 64%, with over 21% of the respondents very unhappy about the level of care received. Furthermore, none of the 26 health care centres belonging to Viseu was considered as providing an excellent service.
While it is difficult to make a full assessment of the main causes of these asymmetries based on the results of the EUROPEP instrument, it is clear that there is considerable scope for improvement in some DHAs. In general the area of care which the patients are less satisfied with is the organisation of the services. On the other hand, patients praise the patient-doctor interaction.
Caution needs however to be exercised in interpreting these results. As mentioned previously, the EUROPEP instrument measures the quality of services based on the satisfaction of the patients with the services received, which is strongly determined by the expectations that the patients have for their care. In this respect, a relatively low satisfaction rate in a particular region may simply reflect that the patients have higher expectations, and not necessarily reflect poorer quality of services.
Discussion and Conclusion
There is increased pressure to improve the performance of health services delivery in Portugal and worldwide. Although some progress has been made developing techniques and models to measure it, the use of the results to improve the performance of the providers is still a great challenge. The use of the results in a formative way requires the participation of the health care professionals both to build the assessment models, and to discuss the results. In order to explore the usefulness of the DEA results in practice, we have tried to consult several health care professionals because “[no] amount of guidance from the NHS Executive or hectoring by politicians can substitute for a drive to improve performance that comes from within and is acknowledged and valued by those steering the process of change” (Ham [44]: 1492). In particular, we attempted to get feedback from the members of the Management Board of one of the District Health Authorities, and from senior managers, doctors and nurses belonging to the Portuguese National Health Service. At the time of submission, we have only received feedback from nine doctors. Their comments raised a number of issues regarding the framework used and the results obtained. Below we discuss the issues raised, focusing separately on the comments regarding the measures used to assess equity, efficiency and quality of care.
In terms of the measure used to assess the equity of access to the services two questions were raised. Firstly, it was suggested that patients should be grouped according to different needs for health care and that equity should be assessed within each group. In particular it was suggested that patients should be separated into ‘occasional users’ and ‘regular users’ of services, and into ‘healthy patients’ who need preventive services and ‘sick patients’ who need curative services. Secondly, it was suggested that a study should be conducted in order to investigate which variables (income, area of residence, etc.) may explain the level of utilisation of primary care services. In this respect, it was felt that the results obtained in this study can only assess geographic equity of utilisation of primary care services and that future studies should use different measures to assess the equity of access and equity of outcomes between different groups of patients.
The model used to assess the efficiency of services was considered appropriate, because it links the human resources used with the multiple services provided by the health centres, allowing each centre to focus on the areas prioritised by each centre according to its local needs. The results obtained were considered valid to describe the relative efficiency of the providers and to provide an opportunity to discuss the different models of service provision.
In terms of the measure used to assess the quality of care, there was consensus that it was adequate. Nevertheless, one question was raised. The professionals were surprised to find out that the patients who answered the questionnaire were mostly unsatisfied with aspects of service management, such as waiting time for consultations and provision of preventive services, rather than aspects related with the patient-doctor interaction and the medical care. The possibility that the type of questions included in the questionnaire may have influenced these results was raised. In terms of the results obtained regarding the quality of care, it was pointed out that the relatively low patients’ satisfaction requires urgent corrective action from the health centres in order to meet their expectations.
Performance measurement is fundamental to assist health care organisations, or rather people in health care organisations, assess how well they are achieving their objectives and identify areas of strength and weakness. Yet, performance measurement by itself produces no improvements in performance and its impact will be limited unless
it brings about change in the organisation. It is the effective analysis and use of the results of performance measurement initiatives by decision makers at all levels of the organisation to improve services that will lead to the necessary changes.
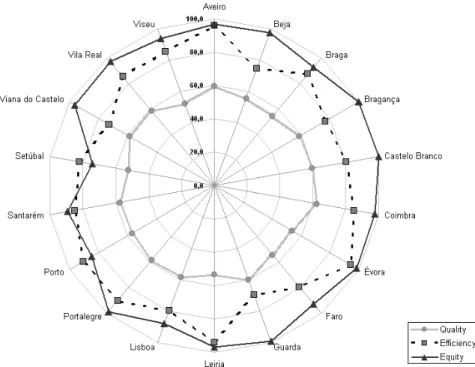
Despite the difficulties encountered in receiving feedback from a wider range of stakeholders, there are some important empirical findings from our study. Firstly, we found wide variation in terms of the equity, efficiency and quality of health services delivery, both across and within DHAs. At the most basic level of access to a family doctor, we found that there are health centres where nearly half of the patients are not registered with a designated doctor. This contrasts heavily with centres where all the patients are registered with a designated doctor. This variation ought to be investigated in order to ensure equitable access to the services across the country. A significant variation was also found in terms of efficiency of services delivered, suggesting that a better use of the resources could lead to more services being delivered to the patients in need. Secondly, considering performance as multidimensional, this study has addressed the question of conflicting objectives in health care provision. Our results do not reveal a clear trade-off between any of the assessment criteria. Whilst some DHAs present above average results in all three criteria, other DHAs present below average results in all criteria. Aveiro is a DHA that could serve as a learning benchmark to other DHAs, given the fact that it delivers services with a high level of equity and efficiency, whilst maintaining above average results in terms of the perceived quality of those services (Figure 3). Our DEA analysis of the efficiency within DHAs allows the identification of suitable learning peers to each health centre, as well as targets for performance improvement.
It is our conviction that DEA is a strong analytical technique upon which to build, despite the fact that we were unable to explore the usefulness of the results in practice with a wider range of stakeholders. However, one of the premises of this article is that DEA has to be broadened to address problematic situations such as those faced by health services delivery in order to contribute to performance improvement in practice.
Figure 3 - Trade-offs Between Evaluation Criteria
Some of the situations that need to be addressed and require further research include: a) Different stakeholders have different, and sometimes conflicting, views regarding what is good performance in health care provision. Further research is needed to discuss appropriate ways to capture these different views and to assess whether different views should be incorporated in a single model or whether different models should be used to assess performance from multiple perspectives.
b) The evaluation of health care providers should account not only for current performance but also for past inheritances and investment in the achievement of desired long-term outcomes. Further research is also needed to develop DEA models that can successfully capture these dynamic effects.
c) Most of the outcomes of primary health care provision are very difficult to measure and might be affected by factors other than health care. In addition to the difficulty in measuring some of the outcomes (e.g. better quality of life and successful disease prevention), it is also important to take into consideration that some of the services of primary care only produce effects in the long term. Research on the definition of appropriate measures for primary health care outcomes adjusted for
case-mix is required.
d) Standard DEA models allow full flexibility in the choice of the inputs and outputs weights. This, however, might lead to some of the variables being neglected from the assessment. This problem can be solved by the introduction of weight restrictions in the DEA model. Whilst several approaches to define weight restrictions exist, the specification of appropriate weight restrictions can be a very challenging task. The Multicriteria Decision Analysis literature (e.g. [45], [46]) is very rich regarding procedures to elicit the preferences of the stakeholders. Further research can explore the extent to which some of these procedures can be used in the DEA context to express weight restrictions that are economically valid and that derive from the preferences of the stakeholders.
Research on these issues would represent an important step towards improving the contribution of performance assessment in practice. However, it is our belief that this contribution would be strengthened if researchers move away from the ‘black box’ type of evaluation, by incorporating the DEA exercise into case studies and context-driven research projects.
References
[1] Fry J. General Practice – The Facts. Radcliffe Medical Press: Oxford, 1993.
[2] Donabedian A. The Definition of Quality and Approaches to its Assessment. Ann Arbor, Health Administration Press: Michigan, 1980.
[3] Hollingsworth B, Dawson PJ, Maniadakis N. Efficiency measurement of health care: a review of non-parametric methods and applications. Health Care Management Science 1999; 2: 162-172.
[4] Li T, Rosenman R. Cost Inefficiency in Washington Hospitals: A Stochastic Frontier Approach Using Panel Data. Health Care Management Science 2001; 4: 73-81.
[5] Chilingerian JA, Sherman HD. Health Care Applications: From Hospitals to Physicians, From Productive Efficiency to Quality Frontiers. In Handbook on Data Envelopment Analysis, Cooper WW, Seiford LM, Zhu J (eds.). Kluwer Academic Publishers, London, 2004; 481-537.
[6] Pina V, Torres L. Evaluating the efficiency of non-profit organizations: an application of data envelopment analysis to the public health services. Financial Accountability and Management 1992; 8: 213-225.
[7] Szczepura A, Davies A, Fletcher C, Boussofiane A. Efficiency and effectiveness in general practice. Journal of Management in Medicine 1993; 7(5): 36-47.
[8] Thanassoulis E, Boussofiane A, Dyson RG. Exploring output quality targets in the provision of perinatal care in England using DEA. European Journal of Operational Research 1995; 80(3): 588-607.
[9] Bates J, Baines D, Whynes D. Measuring the Efficiency of Prescribing by General Practitioners. Journal of the Operational Research Society 1996; 47: 1443-1451. [10] Luoma K, Järviö M-L, Suoniemi I., Hjerppe R. Financial Incentives and Productive
Efficiency in Finnish Health Centres. Health Economics 1996; 5: 435-445.
[11] Salinas-Jiménez J, Smith PC. Data envelopment analysis applied to quality in primary health care. Annals of Operations Research 1996; 67: 141-161.
[12] García F, Marcuello C, Serrano D, Urbina O. Evaluation of Efficiency in Primary Health Care Centres: An application of data envelopment analysis. Financial Accountability and Management 1999; 15(1): 67-83.
[13] Giuffrida A. Productivity and efficiency changes in primary care: a Malmquist index approach. Health Care Management Science 1999; 2(1): 11-26.
[14] Goñi S. An analysis of the effectiveness of Spanish primary health care teams. Health Policy 1999; 48(2), 107-117.
[15] Buck D. The Efficiency of the Community Dental Services in England: a data envelopment analysis. Community Dentistry and Oral Epidemiology 2000; 28: 274-280.
[16] Giuffrida A, Gravelle H. Measuring performance in primary care: econometric analysis and DEA. Applied Economics 2001; 33: 163-175.
[17] Zavras A, Tsakos G, Economou C, Kyriopoulos J. Using DEA to evaluate Efficiency and Formulate Policy within a Greek National Primary Health Care Network. Journal of Medical Studies 2002; 26(4): 285-292.
[18] Rosenman R, Friesner D. Scope and scale inefficiencies in physician practices. Health Economics 2004; 13: 1091-1116.
[19] Amado CAF, Dyson RG. On comparing the performance of primary care providers. European Journal of Operational Research 2008; 185:915-932.
[20] OECD. OECD Economic Surveys Portugal: The Ongoing Reform of the Health Care System, 2004, Vol. 2004, N.º 13, 127-180.
[21] Oliveira MD, Pinto CG. Health care reform in Portugal: an evaluation of the NHS experience. Health Economics 2005; 14: S203-S220.
[22] IGIF. Estatística do Movimento Assistencial dos Centros de Saúde em 2005. Instituto de Gestão Informática e Financeira da Saúde: 2006.
[23] Charnes A, Cooper WW, Rhodes E. Measuring the Efficiency of decision-making units. European Journal of Operational Research 1978; 2: 429-444.
[24] Banker RD, Charnes A, Cooper WW. Some Models for Estimating Technical and Scale Inefficiencies in Data Envelopment Analysis. Management Science 1984; 30: 1078-1092.
[25] Boussofiane A, Dyson RG, Thanassoulis E. Applied data envelopment analysis. European Journal of Operational Research 1991; 52: 1-15.
[26] Cooper WW, Seiford, L, Tone K. Data Envelopment Analysis: A Comprehensive Text with Models, Applications, References and DEA-Solver Software. Kluwer Academic Publishers: Massachusetts, 2000.
[27] Cooper WW, Seiford L, Zhu J. Handbook on data envelopment analysis, Kluwer Academic Publishers: Massachusetts, 2004.
[28] Sengupta JK. Efficiency Measurement in Stochastic Input-Output Systems. International Journal of Systems Science 1982; 13: 273-287.
[29] Smith PC. On the unintended consequences of publishing performance data in the public sector. International Journal of Public Administration 1995; 18(2/3): 277-310.
[30] Williams A. Health and Health Care. In Measuring Outcome in the Public Sector, Smith PC (ed.). Taylor and Francis Ltd.: London, 1996; 20-33.
[31] Fitzgerald L, Storbeck JE. Distinguishing interests in the performance of regulated water: the UK experience. In Performance Measurement Research and Action, Neely A, Walters A, Austin R (eds). Centre for Business Performance: Cranfield, 2002; 197-203.
[32] Williams A. ‘Need’ as a demand concept (with special reference to health). In Economic Policies and Social Goals: Aspects of Public Choice, Culyer, A. (ed.). Martin Robertson: London, 1974.
[33] Culyer AJ. Need and the National Heath Service: Economics and Social Choice. Martin Robertson: London, 1976.
[34] Pereira JA. Equity objectives in Portuguese health policy. Social Science and Medicine 1990; 31(1): 91-94.
[35] Schinnar AP, Kamis-Gould E, Delucia N, Rothbard AB. Organizational Determinants of Efficiency and Effectiveness in Mental Health Partial Care Programs. Health Services Research 1990; 25(2): 387-420.
[36] Bjørner J, Keiding, H. Cost-effectiveness with multiple outcomes. Health Economics 2004; 13: 1181-1190.
[37] Grol R, Wensing M. Patients evaluate general/family practice: the EUROPEP instrument. EUROPEP Group: Nijmegen, 2000.
[38] Assembleia da República. Constituição da República Portuguesa. Assembleia da República: Lisboa, 1992.
[39] Direcção-Geral da Saúde. Regime Remuneratório Experimental dos Médicos de Clínica Geral. Lisboa, 2004.
[40] Gouveia M, Silva SN, Oliveira P, Miguel LS. Análise dos Custos dos Centros de Saúde e do Regime Remuneratório Experimental. APES, 2006.
[41] Podinovski VV. Production trade-offs and weight restrictions in data envelopment analysis. Journal of the Operational Research Society 2004; 55(12): 1311-1322. [42] Giraldes MR. Portugal: current distribution and development of the human health
resources. Cahiers Sociologie Demographie and Medicine 1995; 3-4: 343-60. [43] Oliveira MD, Bevan G. Measuring geographic inequities in the Portuguese health
care system: an estimation of hospital care needs. Health Policy 2003; 66(3): 277-293.
[44] Ham C. Health Policy in Britain. Macmillan Press Ltd: London, 1999.
[45] Keeney RL, Raiffa H. Decisions with Multiple Objectives. John Wiley & Sons: New York, 1976.
[46] Belton V, Stewart TJ. Multiple Criteria Decision Analysis: An Integrated Approach. Kluwer Academic Publishers: London, 2002.