Abstract
The genus Avena comprises four distinct genomes organized in diploid (AA or CC), tetra-ploid (AABB or AACC) and hexatetra-ploid species (AACCDD), constituting an interesting model for phylogenetic analysis. The aim of this work was to characterize 45S rDNA intergenic spacer (IGS) variability in distinct species representative of Avena genome diversity–A.
strigosa (AA), A. ventricosa (CvCv), A. eriantha (CpCp), A. barbata (AABB), A. murphyi
(AACC), A. sativa (AACCDD) and A. sterilis (AACCDD) through the assessment of the 5’ external transcribed spacer (5’-ETS), a promising IGS region for phylogenetic studies poorly studied in Avena genus. In this work, IGS length polymorphisms were detected mainly due to distinct 5’-ETS sequence types resulting from major differences in the number and organi-zation of repeated motifs. Although species with A genome revealed a 5’-ETS organiorgani-zation (A-organization) similar to the one previously described in A. sativa, a distinct organization was unraveled in C genome diploid species (C-organization). Interestingly, such new orga-nization presents a higher similarity with other Poaceae species than A-genome sequences, supporting the hypothesis of C-genome being the ancestral Avena genome. Additionally, polyploid species with both genomes mainly retain the A-genome 5’-ETS organization, con-firming the preferential elimination of C-genome sequences in Avena polyploid species. Moreover, 5’-ETS sequences phylogenetic analysis consistently clustered the species stud-ied according to ploidy and genomic constitution supporting the use of ribosomal genes to highlight Avena species evolutive pathways.
Introduction
Oat (Avena L., Poaceae family) is one of the most cultivated cereals worldwide and a valuable
resource in several countries both for human consumption and animal feed [1]. GenusAvena
L. constitutes an interesting model for phylogenetic studies comprising 26 species with differ-ent genomes and ploidy levels [2]. Within this genus, the basic number of chromosomes is x = 7 and there are diploid species with AA or CC genomes; tetraploids with AABB or AACC genomes and hexaploids with AACCDD genome [3,4]. While the C-genome is quite different
a1111111111 a1111111111 a1111111111
OPEN ACCESS
Citation: Rodrigues J, Viegas W, Silva M (2017)
45S rDNA external transcribed spacer organization reveals new phylogenetic relationships in Avena genus. PLoS ONE 12(4): e0176170.https://doi.org/ 10.1371/journal.pone.0176170
Editor: Giovanni G Vendramin, Consiglio Nazionale
delle Ricerche, ITALY
Received: June 14, 2016 Accepted: April 6, 2017 Published: April 27, 2017
Copyright:© 2017 Rodrigues et al. This is an open access article distributed under the terms of the
Creative Commons Attribution License, which permits unrestricted use, distribution, and reproduction in any medium, provided the original author and source are credited.
Data Availability Statement: All relevant data are
within the paper and its Supporting Information files. All DNA sequences are available at NCBI Nucleotide database (accession numbers KM586737, KM586738, KM586747, KM586748, KM586749, KM586759, KM586760, KM586761, KM586772, KM586773, KM586762, KM586763, KM586764, KM586765, KM586739, KM586740, KM586756, KM586757, KM586758, KM586741, KM586742, KM586766, KM586767, KM586768, KM586743, KM586744, KM586750, KM586751, KM586752, KM586769, KM586770, KM586745,
from the other ones [5], B and D genomes are very similar to the A-genome [4,6]. Besides, since diploid species with B or D genomes have not been found, it seems that both diverged from an ancestral A’ genome [7]. The model proposed for hexaploid species evolution involves the hybridization of two diploid species, followed by chromosome duplication, originating an AACC ancient genome. Afterwards, this allotetraploid underwent another hybridization event with an AA diploid species and subsequent chromosome duplication. The evolution of the tet-raploid species with AABB genomes was suggested to be an unrelated event that followed a diploid AA species autopolyploidization (for a review see [8]). Cytogenetic evaluation of ribo-somalloci has been extensively used to study Avena species variability [4,9–12] suggesting that allopolyploidization was followed by a preferential decrease in the number and/or size of C-genome NORs (nucleolar organizing regions) [5].
To clarifyAvena diversity and evolution several molecular markers have been used such as
simple sequence repeats (SSR) or microsatellites [13–16]; restriction fragment length polymor-phism (RFLP) [17,18]; amplified fragment length polymorphism (AFLP) [19] and inter-retrotransposon amplified polymorphism (IRAP), inter-retrotransposon-microsatellite amplified polymorphism (REMAP) and Inter Simple Sequence Repeat (ISSR) [12,20,21]. 45S rDNA units, organized in tandem repeats of IGS-18S-ITS1-5.8S-ITS2-25S [22], have also been tar-geted forAvena phylogenetic analysis. The internal transcribed spacers (ITS1 and ITS2) and
the ITS1-5.8S-ITS2 region have been studied in detail inAvena species [5,12,23–25]. Addi-tionally, Polanco and De La Vega [26] detected intergenic spacer (IGS) length polymorphism inA. sativa cv. Cometa and the analysis of the longest sequence (4098bp, Accession Number:
X74820.1) disclosed five different types of repeats—A, B, C, D and E—being each one present in two to 13 repetitions. These results were latter confirmed through PCR amplification in an extensive collection ofA. sativa accessions [27]. Inter and intraspecific variations in the IGS have been also described inAvena by RFLP [23,28,29]. Nikoloudakis and colleagues [23] assessed IGS diversity through restriction enzyme digestion of a ~4000bp fragment amplified from fifty four accessions belonging to 23Avena taxa and found 150 different banding
pat-terns. Within the IGS, the assessment of the 5’ external transcribed spacer (5’-ETS) has also been used to clarify phylogenetic relationships and differentiate between closely related species of distinct genera of Asteraceae [30] and Fagaceae [31]. However, this particular IGS region that begins with the transcription initiation site (TIS) and encompasses several pre-rRNA pro-cessing signals [26] was never detailed studied inAvena species.
The present work aimed to evaluate rDNA intergenic sequences diversity in severalAvena
species with distinct ploidy levels and genome compositions contributing to enlightenAvena
genus evolution pathways.
Materials and methods
The plant material used includes the following species:A. strigosa (genome AA, 5284) obtained
from EAN Germplasm Bank (Oeiras, Portugal, PRT005);A. ventricosa (genome CvCv,
PI657337);A. eriantha (genome CpCp, Clav9050); A. barbata (genome AABB, PI367338); A. murphyi (genome AACC, PI657606); A. sativa (genome AACCDD, Clav8250) and A. sterilis
(genome AACCDD, PI267989) obtained from United States Department of Agriculture, Agri-cultural Research Service (USDA). At least three seeds were germinated and plants were main-tained in growth chambers at 16h/day (22°C) and 8h/night (15°C). Leaves from different one
month old plants were stored at -80°C for further utilization and plants were then maintained
in greenhouse until life cycle completion. KM586746, KM586753, KM586754, KM586755,
KM586771, KM586774, KM586775).
Funding: MS was funded by the FCT Investigator
Programme (IF/00834/2014) from Fundac¸ão para a Ciência e a Tecnologia, Portugal (FCT) and the research work was financed by FCT project PTDC/ BIA-BEC/101964/2008, and FCT LEAF (Linking Landscape, Environment, Agriculture and Food) Unit (UID/AGR/04129/2013).
Competing interests: The authors have declared
DNA extraction and PCR experiments
DNA extractions were performed with DNA Cell & Tissue Kit (Citogene) according to the manufacturer’s instructions. DNA was quantified and stored at -20°C. Primers used are listed
inTable 1and their schematic representation is presented inFig 1in relation toA. sativa
rDNA spacer published sequence (Accession Number: X74820.1). PCR experiments were per-formed in at least three replicates for each primer combination in a 20μl volume with: 1x PCR buffer; 1.5 mM MgCl2; 0.1 mM dNTP’s; 0.25 to 1μM of each primer; 1 U NZYTaq DNA poly-merase (NZYtech); 30 to 50 ng DNA template and Milli-Q H2O for the remaining volume. The IGS was amplified using the modified touchdown PCR program [32]: 94˚C for 4 minutes; 10 cycles of 94˚C for 1 minute; 65˚C for 30 seconds, decreasing 0.5˚C each cycle; 72˚C for 4 minutes; 25 cycles of 94˚C for 1 minute; 60˚C for 30 seconds; 72˚C for 4 minutes and 10
ITS_for 5’–GCATCGATGAAGAACGCAGC– 3’
ITS_rev 5’–TCCTCCGCTTATTGATATGC– 3’
Notes:
Primers were designed using Primer3: ETS1_for and rev, ETS2_for and rev and ETS3_for and rev based on the A. sativa rDNA spacer published sequence (Accession Number: X74820.1); ETS4_for based on the A. ventricosa partial sequences obtained in this work (Accession Number: KM586761); and 18S based on the T. aestivum 18S sequence (Accession Number: X07841). Primer 25S was designed by [26] and primers ITS_for and ITS_rev were designed by [33] (ITS3 and ITS4, respectively).
https://doi.org/10.1371/journal.pone.0176170.t001
Fig 1. Organization of 45S rDNA units in A. sativa. IGS—intergenic spacer; 3’-ETS– 3’ External transcribed spacer; TIS—transcription initiation site; 5’-ETS– 5’ external transcribed; ITS—internal transcribed spacers. ETS1, ETS2 and ETS3 primers used for intergenic sequences amplification designed based on the A. sativa sequence (Accession Number: X74820.1).
minutes of final extension at 72˚C. Amplification of partial 5’-ETS sequences was carried as followed: 94˚C for 4 minutes; 30 cycles of 94˚C for 1 minute; 57˚C for 45 seconds; 72˚C for 90 seconds; with 15 minutes of final extension at 72˚C. The complete 5’-ETS sequences were amplified with the same program but with 2 minutes in each extension step. The amplification of the ITS2 region used as control was performed with the partial 5’-ETS program but with 60˚C in the annealing step. PCR products were separated in 1 or 1.7% agarose gels with 1 Kb Plus DNA Ladder (Invitrogen) as molecular marker. Gels were detected with ethidium bro-mide and photographed using BIO-Rad GEL DOC 2000.
Firstly, primers 25S and 18S were used to amplify the IGS sequences. Primers ETS1_for and rev, ETS2_for and rev were used to obtain 5’-ETS partial sequences (between TIS sequence and D repeat). From those, primer ETS1_for was chosen to obtain the entire 5’-ETS in combi-nation with 18S primer. Primers ETS3_for and rev were used combined with other primers to further confirm the entire 5’-ETS sequencing and ETS4_for primer, designed based on theA. ventricosa partial sequences obtained in this work (Accession Number: KM586761), was used
to assess the occurrence of C-organization sequences. Finally, ITS_for and rev primers were used as internal controls to amplify the 45S rDNA ITS2 sequences.
Sequence cloning
Selected bands were isolated from agarose gels, purified with NZYGelpure (NZYtech) and the fragments obtained were ligated into the pCR2.1 vector (Invitrogen) cloned into NZY5α Com-petent cells (NZYtech). Transformed cells were incubated at 37°C overnight on LB agar plates
containing ampicillin (100μg/ml) and X-Gal (20 μg/ml) and colony screening was performed by PCR with M13 primers. Selected colonies were grown overnight at 37°C, 250 rpm in liquid
LB medium with ampicillin. Plasmids were purified with NZY Miniprep (NZYtech) and the inserted fragments were sequenced through the Sanger method (Stabvida). The accession numbers of all sequences obtained (Accession Numbers: KM586737 to KM586775) are listed inS1 Table.
Sequence and phylogenetic analysis
The phylogenetic analysis was tested by aligning the sequences using different methods with the default settings: Clustal Omega, MUSCLE, MAFFT and T-COFFEE (http://www.ebi.ac.uk/ Tools/msa/). Next, the best evolutionary model was tested in JModelTest2 with 3 substitutions schemes [34]. A similar tool is available in MEGA version 6 [35] and was also tested. The best phylogenetic model was selected based on the lowest BIC (Bayesian Information Criterion) score and in general the same models had low scores in both programs. Lastly, the phyloge-netic trees for the different alignments and with the different models were made in MEGA6 and in MrBayes [36] and all trees generated clustered the species similarly. Thus, the phyloge-netic analysis was performed in MEGA version 6 and the sequences were aligned using the MUSCLE application with default settings. The best phylogenetic model was tested and selected based on the lowest BIC score and the Maximum Likelihood trees with 1000 bootstrap repetitions were obtained. Since some sequences presented insertions, one standard sequence of each species with the highest similarity with the published sequence for A.sativa (Accession
Number: X74820.1) was used to construct the tree based on the complete 5’-ETS sequences. Similar phylogenetic trees were built using the 5’-ETS sequences excluding all repeat motifs identified.
The alignment of all sequences inS2 Figwas obtained using the ClustalW application and manually adjusted using BioEdit Sequence Alignment Editor version 7.2.5 [37]. Dotplots to
identify repeats were constructed in Unipro UGENE [38] with minimum repeat length of 8bp and 100% identity.
Results
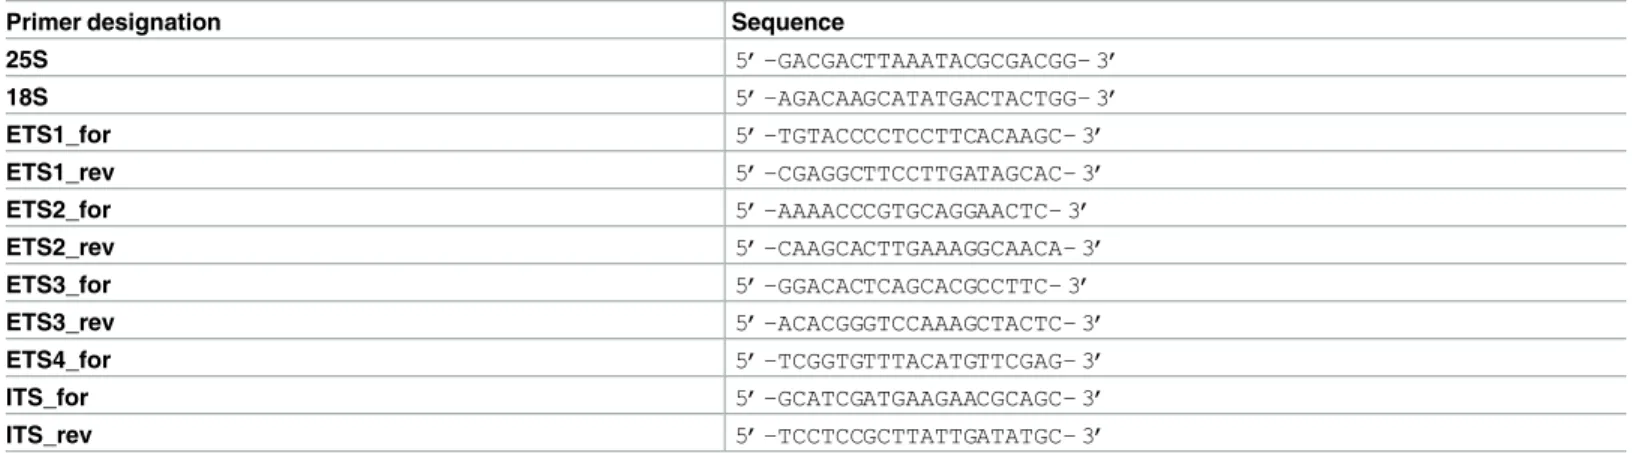
The amplification of the entire 45S rDNA intergenic spacer (IGS) using 25S and 18S primers from different individuals of each species did not reveal intraspecific diversity (Fig 2A). A major band with a size approximated to the expected from theA. sativa rDNA IGS published
sequence (4098 bp, Accession Number X74820.1) was observed in all species analyzed. Yet, a clear interspecific IGS length polymorphism was detected (~4000bp gel region,Fig 2B) withA. strigosa presenting the longest spacer with ~4000bp, and A. ventricosa, A. barbata and A. steri-lis showing smaller IGSs with similar dimension (~3600bp), as well as A. eriantha, A. murphyi
andA. sativa (~ 3800bp). Moreover, an additional band with lower intensity can be seen in
this gel region inA. eriantha and A. barbata.
Additionally, bands with much shorter dimension than the ~4000bp expected were detected (Fig 2A). From them a band with ~500bp was observed in most species except inA. vetricosa and A. eriantha and an additional band with ~1500bp was observed in A. murphyi. In A. sterilis a smaller band with ~800bp, presenting higher intensity than the ~4000bp band, was
gel isolated and sequenced. This sequence corresponds to a truncated shorter variant of the IGS possibly nonfunctional due to the lack of transcription initiation site (for detail seeS1 Fig).
5’-ETS sequences analysis unraveled marked differences between A
and C genomes
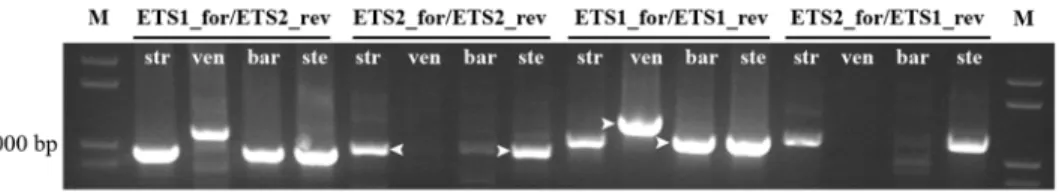
We started our study of the 45S rDNA 5’ external transcribed spacer (5’-ETS) amplifying a region between TIS sequence (TATAGTAGGG) and the beginning of D repeat using two pairs of primers (Table 1) to amplify fragments with the following expected sizes: ETS1_for/ Fig 2. IGS complete sequence. PCR amplification of the complete IGS sequence from A. strigosa (str); A. ventricosa (ven); A. eriantha (eri); A. barbata (bar); A. murphyi (mur); A. sativa (sat); and A. sterilis (ste) using primers 25S and 18S. (A) Amplification from different individuals of each species. (B) Bands with the size approximate to the expected from A. sativa IGS sequence. M: molecular marker 1Kb+. The arrowhead indicates the ~800bp A. sterilis band sequenced.
ETS1_rev—1089 bp; ETS2_for/ETS2_rev—977 bp; ETS1_for/ETS2_rev—942 bp and ETS2_ for/ETS1_rev—1129 bp. The results presented inFig 3show that the four primers combina-tions yielded bands with the expected dimension in species with the A-genome—A. strigosa, A. barbata and A. sterilis, although A. barbata bands obtained with the primer ETS2_for showed
a considerable lower intensity. On the other hand, the C genome diploid speciesA. ventricosa
yielded a larger band (more ~150 bp) with primer ETS1_for and a lack of amplification prod-ucts with primers ETS2_for.A. sativa produced bands with the expected sizes as well as the
other species with A genome.A. eriantha results were similar to the ones described for A. ven-tricosa (results not shown). So it seems that the ETS2_for sequence is absent in the C-genome
diploid species.
PCR amplification products obtained with primers ETS2_for/ETS2_rev inA. strigosa, A. sativa and A. sterilis and with primers ETS1_for/ETS1_rev in A. ventricosa and A. barbata
were sequenced (arrowheads inFig 3). The overall similarity of all sequences with theA. sativa
published sequence was 94 to 99% except inA. ventricosa which shows 66% similarity traduced
by unexpected E repeats in the 507-881bp region and only one C repeat. Additionally, one shorter clone fromA. sativa revealed the lack of the C2 repeat. The analysis of the region
sur-rounding TIS (Fig 4) revealed insertions of a 30bp sequence or fragments of it, inA. strigosa, A. sativa and A. sterilis. A search for regulatory elements in these sequences performed in
PLACE database [39] revealed that most motifs detected were related to promoter sequences. Moreover, this study unraveled variability around TIS namely in the RNA polymerase I recog-nized site established in several plant species (reviewed in [40]) inA. ventricosa and even a
truncated shorter variant lacking TIS was observed inA. sterilis.
Since the amplification using ETS1_for primer was effective in all genotypes analyzed, it was further used combined with 18S primer to amplify 5’-ETS complete sequences in all spe-cies studied. The results obtained presented inFig 5disclosed bands with similar length (~1750bp) in all species with A-genome–A. strigosa, A. barbata, A. murphyi, A. sativa and A. sterilis while C-genome diploid species–A. ventricosa and A. eriantha–showed shorter 5’-ETS
sequences (~1500bp) andA. eriantha revealed an additional band with 1400bp.
Complete 5’-ETSs were sequenced using internal primers based on the partial sequences previously referred (primers ETS3_for and ETS3_rev,Table 1). Their alignment along with the partial sequences is presented inS2 Fig. Sequence similarity analysis (summarized inTable 2) revealed 96 to 99% homology amongst species with A genome and 99% similarity in C-genome diploid species. The similarity observed between species with A- and diploid species with C-genome was considerably lower (ranging from 70 to 76%) and few SNPs were detected upstream the 18S, a region prone to loops formation. However, these SNPs do not appear to affect loop conformation significantly since Mfold [41] analysis revealed similar structures Fig 3. Partial 5’-ETS sequence. PCR amplification of partial 5’-ETS obtained with the following primers combinations: ETS1_for/ETS2_rev; ETS2_for/ETS2_rev; ETS1_for/ETS1_rev; and ETS2_for/ETS1_rev on A. strigosa (str); A. ventricosa (ven); A. barbata (bar) and A. sterilis (ste). M: molecular marker 1Kb+. Arrowheads indicate bands sequenced.
with similar free energies (-29.90 kcal/mol in species with A-genome and -30.50 kcal/mol in C-genome diploid species).
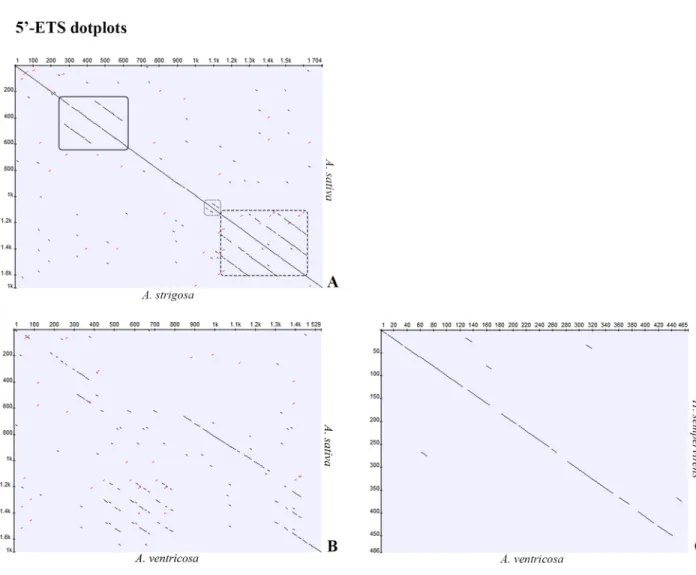
To identify repetitive elements and further understand the organization of the 5’-ETS, dot-plots were constructed. Given the high similarity observed between all species with A-genome studied, theA. strigosa sequence was used to construct a dotplot in comparison with A. sativa
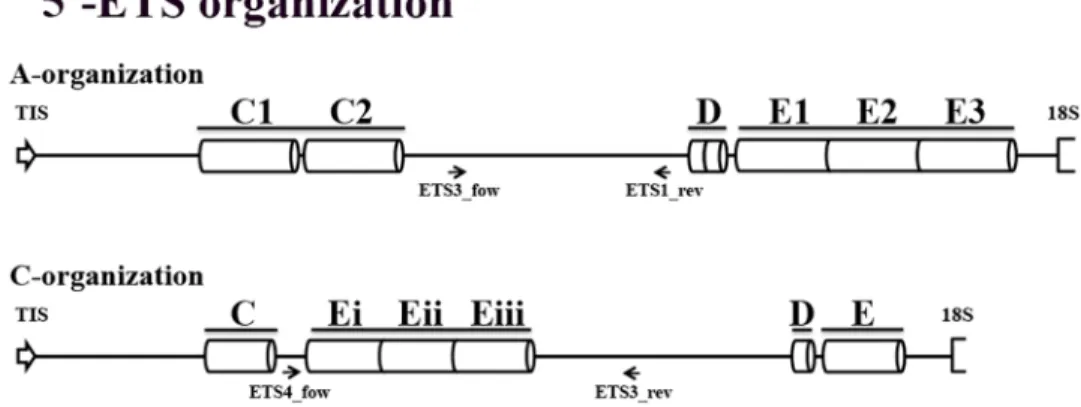
published sequence (Fig 6A) revealing the repeats previously reported: two C repeats with ~150bp in the 300-600bp region; two short D repeats in the 1100–1200 bp region; and three E repeats with approximately 120 bp in the 1200-1600bp region. This 5’-ETS organization is henceforward referred as A-organization (Fig 7).
Since the ~1500bp sequences of C-genome diploid species—A. ventricosa and A. eriantha—
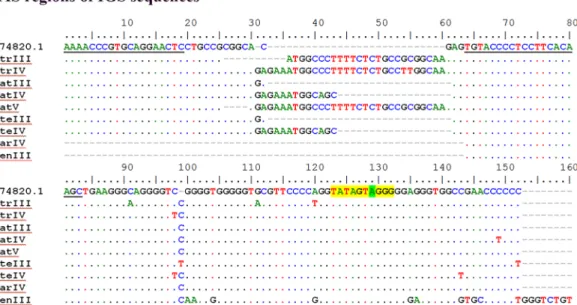
are similar, theA. ventricosa sequence was selected to construct a dotplot along with the A. sativa published sequence (Fig 6B). C-genome diploid species dotplot analysis revealed the presence of only one C repeat, as also revealed by the partial sequences described, followed by three E repeats absent in A-organization. Additionally, only one D repeat and one E repeat are Fig 4. TIS regions of IGS sequence. Alignment of IGS sequences surrounding the transcription initiation site (TIS) from A. strigosa (str), A. sativa (sat), A. sterilis (ste), A. barbata (bar), A. ventricosa (ven) with A. sativa published sequence (Accession Number: X74820.1). Roman numerals indicate different clones. Primer sequence of ETS1_for (from position 64 to 83) and ETS2_for (from position 1 to 19) are underlined. TIS is highlighted in yellow. TIS position +1 is highlighted in green.
https://doi.org/10.1371/journal.pone.0176170.g004
Fig 5. Complete 5’-ETS sequence. PCR amplification of the complete 5’-ETS obtained with primer combination ETS1_for/18S from A. strigosa (str); A. ventricosa (ven); A. eriantha (eri); A. barbata (bar); A. murphyi (mur); A. sativa (sat) and A. sterilis (ste). M: molecular marker 1Kb+.
Table 2. Similarity between complete 5’-ETS sequences of all Avena species analyzed.
% X74820 Str Ven EriL EriS Bar Mur Sat Ste
X74820 100 97 70 71 75 97 98 96–97 96–99 Str 100 71 71 75 99 98 99 98 Ven 100 99 99 71–72 71 71–72 71–72 EriL 100 100 71 70–71 71–72 71 EriS 100 75–76 75 75–76 75–76 Bar 98 98 98–99 98–99 Mur 100 98 98 Sat 100 98–100 Ste 98 Notes:
EriL and EriS represent the sequences of the larger and shorter bands of A. eriantha, respectively.
The similarity between the sequences of species with A-genome and C-genome diploid species is highlighted in light grey.
https://doi.org/10.1371/journal.pone.0176170.t002
Fig 6. 5’-ETS sequence dotplots. Dotplots (min length 8, identity 100%) of the 5’-ETS sequences in comparison between the published sequence of A. sativa (Accession Number: X74820.1) and A) A. strigosa (Accession Number: KM586737) or B) A. ventricosa (Accession Number: KM586759). C) Comparison of the +1011 to +1475 region of A. ventricosa with the homologous H. sempervirens sequence (Accession Number: GQ324269.1). Solid underline highlights the C repeats, dot outlines D repeats and dash outline highlights the E repeats.
present upstream the 18S sequence. This organization described inA. ventricosa is henceforth
referred as C-organization (Fig 7) and explains the unexpected presence of shorter 5’-ETS sequences in C-genome diploid species (Fig 5). In fact,A. ventricosa partial sequence is larger
(Fig 3) due to the higher number of E repeats downstream C repeat but the complete sequence is shorter due to the lower number of E repeats downstream the D repeat (Fig 7). Finally, the 1400bp shorter variant unraveled inA. eriantha lacks the first copy of the E repeat.
Interspecific comparisons of E repeats show the highest similarity betweenA. sativa repeats
E2 and E3 and theA. ventricosa repeat closest to 18S (82%). E repeats comparison within A. ventricosa revealed that the three repeats closer to the C repeat are more similar (94–96%) than
the one closer to 18S (75 to 78%). Interestingly, theA. ventricosa E repeat proximal to 18S is
more similar (91%) to other Aveninae sub-tribe species asHelictotrichon (GQ324269.1) than
with the otherAvena E repeats analyzed. A. sativa E2 and E3 repeats present 81% similarity
with theHelictotrichon sequence.
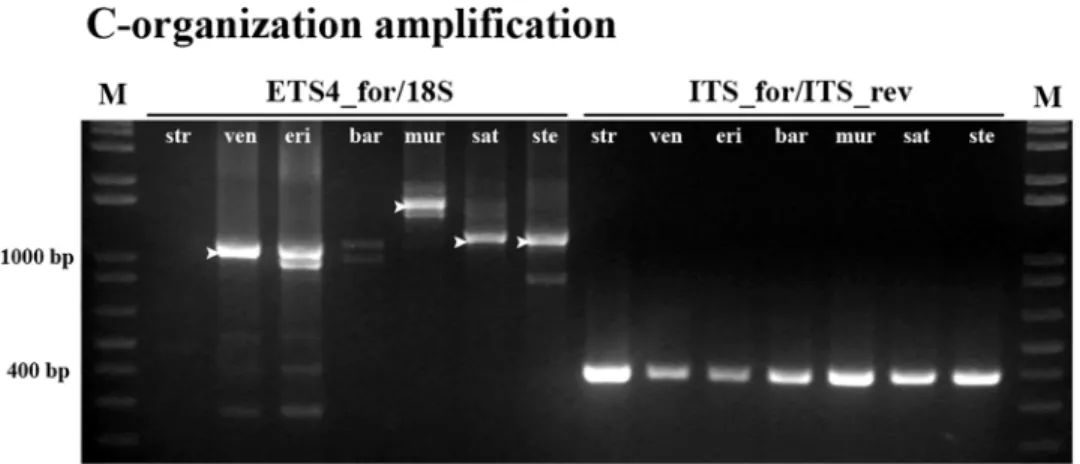
Unraveling Avena A and C genomes evolutive clues
To assess the presence of sequences with organization in polyploid species with C-genome a ETS4_for primer (for localization seeFig 7) was designed based on ourA. ventri-cosa partial sequences (Accession Number: KM586761) and combined with 18S primer (Fig 8, ETS4_for/18S). As control 45S rDNA ITS2 sequence was amplified yielding the expected band with ~380bp in all species (Fig 8, ITS_for/ITS_rev). ETS4_for primer matches an IGS sequence domain downstream the C repeat inA. ventricosa that is absent in the A. sativa
sequence (Fig 7) and the absence of amplification in A-genome diploidA. strigosa confirms
that such sequence is not present in the A genome diploid species. Conversely, the amplifi-cation ofA. ventricosa and A. eriantha with primers ETS4_for and 18S yielded the expected
band with ~1100bp and an additional band with ~1000bp inA. eriantha. The same
experi-ment amplified fragexperi-ments with higher dimensions in polyploid species asA. murphyi, A. sativa and A. sterilis. Sequence comparative analysis of the bands amplified from the
poly-ploid genotypes and fromA. ventricosa (indicated inFig 8) confirmed the presence of three copies of the E repeat downstream the C repeat inA. ventricosa and sequences with the
C-organization type were also detected in polyploid species although with higher number of E repeats. In fact,A. sativa and A. sterilis present four repeats and in A. murphyi four, six and
seven E repeats were observed.
Fig 7. 5’-ETS organization types. Representation of 45S rDNA 5’-ETS organization in species with A-genome (A-organization) and in diploid species with C-A-genome (C-organization). Arrows represent the relative location of the internal primers used to sequence the complete 5’-ETS.
To attempt a deeper understanding on 5’-ETS organization evolutive patterns, organization types A and C were compared with related species of the same tribe (Puccinellia bruggemannii
Accession Number: GQ283217.1), of the same sub-tribe (Helictotrichon sempervirens,
Acces-sion Number: GQ324269.1); and of the same sub-family (Triticum aestivum Accession
Num-ber: X07841.1). This analysis revealed a higher overall homology of C-organization with sequences fromA. ventricosa, H. sempervirens, P. bruggemannii and T. aestivum than between
A-organization and sequences from referred related species. This great homology of C-organi-zation with IGSs from species of other genus was moreover confirmed through dotplot matrix comparingA. ventricosa and H. sempervirens sequences (Fig 6C).
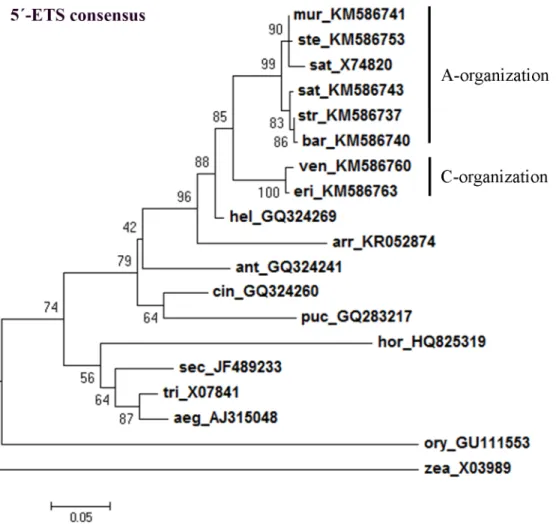
The maximum-likelihood consensus tree constructed usingAvena 5’-ETSs obtained in this
study and sequences from other Poaceae species allowed the separation of a clade comprising allAvena species. Avena species are further separated in different clades, one including C
genome diploid species and the other including species with the A genome (Fig 9). Likewise, the consensus tree constructed using all clones of complete and partial 5’-ETS sequences obtained from allAvena genotypes analyzed (Fig 10) confirms a clear separation of C genome diploid species.
To evaluate if the phylogenetic inference described only reflects repeats organization, a phy-logenetic tree was built using the external transcribed sequences excluding all repeat motifs (repeats: C2, E2, E3, Ei, Eii and Eiii when applicable). As can be seen inFig 11, a clear separa-tion is similarly obtained between C genome diploid species and species with A genome con-sidering only 5’-ETS unique sequences. Moreover, clusters within the A genome branch correspond to the ones obtained with the complete 5’-ETSs (Fig 9) were observed, namely one cluster groupingA. murphyi, A. sterilis and the published A. sativa sequence and the other
clus-ter comprisingA. strigosa, A. barbata and A. sativa.
To assess the robustness of the phylogenetic trees presented in this study, sequence align-ment was tested using different methods (Clustal Omega, MUSCLE, MAFFT and T-COFFEE). The evolutionary models for the alignments generated were tested in JModelTest2 and MEGA6 and the best model was selected based on the lowest BIC (Bayesian Information Crite-rion) score. For all models selected, phylogenetic trees were obtained using MEGA6 and in MrBayes. Overall, all trees generated clustered the species similarly reinforcing the use of the 5’-ETS forAvena phylogeny.
Fig 8. C-organization specific amplification. PCR amplification obtained with primers ETS4_for/18S (2–8) and primers ITS2_for/ITS2_rev (9–15); 16 –molecular marker 1Kb+. A. strigosa (str); A. ventricosa (ven); A. eriantha (eri); A. barbata (bar); A. murphyi (mur); A. sativa (sat) and A. sterilis (ste). M: molecular marker 1Kb +. Arrowheads mark the bands isolated for sequence analysis.
Discussion
In this study 45S rDNA IGS sequences, particularly the 5’-ETS organization, were for the first time comparatively characterized in species of the genusAvena with different ploidy levels and
genomic constitutions. The evaluation of the intergenic spacer (IGS) unraveled clear length variability between theAvena species A. strigosa, A. barbata, A. murphyi, ventricosa, A. eriantha, A. sativa and A. sterilis. IGS variability was previously reported in Poaceae between
different species [45,46] and varieties [47] as well as between distinctA. sativa accessions [27]. Additionally, besides the IGS sequences with the expected size (~4000bp) amplicons with dis-tinct lengths were also detected in species with A genome—A. strigosa, A. barbata, A. murphyi, A. sativa and A. sterilis. Similar within species IGS length variation was also described in A. sativa [26] and more recently inMedicago arborea [48] and in the Fagaceae family [31]. More-over, the detection of IGS sequences with different lengths withinAvena species are mainly
Fig 9. 5’-ETS consensus tree. Maximum-likelihood consensus tree based on 5’-ETS from A. strigosa (str, KM586737), A. ventricosa (ven, KM586760), A. eriantha (eri, KM586763), A. barbata (bar, KM586740), A. murphyi (mur, KM586741), A. sativa (sat, KM586743) and A. sterilis (ste, KM586753); and from sequences previously published: A. sativa (sat, X74820), H. sempervirens (hel, GQ324269); A. elatius (arr, KR052874); A. monticola (ant, GQ324241), P. bruggemannii (puc, GQ283217), C. arundinacea (cin, GQ324260), H. vulgare (hor, HQ825319), S. cereale (sec, JF489233), T. aestivum (tri, X07841), A. umbellulata (aeg, AJ315048), Z. mays (zea, X03989) and O. sativa (ory, GU111553). Accession Numbers in brackets. Tree obtained using the Hasegawa-Kishino-Yano model [42] with discrete gamma distribution; numbers on the branches represent bootstrap support for 1000 replicates; scale indicates the percentage of divergence. https://doi.org/10.1371/journal.pone.0176170.g009
due to differences in the non-transcribed spacer since 5’-ETS amplifications yielded a unique fragment in most species, except in diploid C-genome species.
The detailed analysis of the 5’-ETS sequences presented in this work shows that all species with A-genome have the repeats pattern previously described inA. sativa [26] and here Fig 10. 5’-ETS clones consensus tree. Maximum-likelihood consensus tree based on all complete and partial 5’-ETS sequence clones from Avena species analyzed (Accession Numbers inS1 Table) and from T. aestivum published sequence (Accession Number: X07841) as out-group. Tree obtained using the Kimura phylogenetic model [43]; numbers on the branches represent bootstrap support for 1000 replicates, scale indicates the percentage of divergence.
https://doi.org/10.1371/journal.pone.0176170.g010
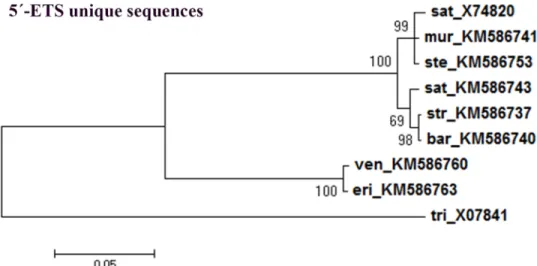
Fig 11. 5’-ETS unique sequences consensus tree. Maximum-likelihood consensus tree based on 5’-ETS unique sequences from Avena (excluding repeat sequences C2, E2, E3, Ei, Eii and Eiii): A. strigosa (str, KM586737); A. ventricosa (ven, KM586760); A. eriantha (eri, KM586763); A. barbata (bar, KM586740); A. murphyi (mur, KM586741); A. sativa (sat, KM586743) and A. sterilis (ste, KM586753)and T. aestivum (tri, X07841) as the out-group. Accession Numbers in brackets. Tree obtained using the Tamura model [44]; numbers on the branches represent bootstrap support for 1000 replicates, scale indicates the percentage of divergence.
designated as A-organization. However, we identified a novel 5’-ETS organization pattern in C-genome diploid species—A. ventricosa and A. eriantha -, nominated C-organization. This
C-organization lacks one C and one D repeat and is also characterized by the presence of only one E repeat downstream the D repeat and two or three E repeats located between the C and D motifs (Fig 12). Both dotplot (Fig 6B and 6C) and phylogenetic tree (Fig 11) analyses ofAvena
5’-ETS sequences in comparison with other Poaceae taxa shows a higher similarity of C-genome organization than of A-organization with those related genera, suggesting an ances-trality of the C-genome.
Additionally, the exploitation of 5’-ETS repeats diversity allows the proposal presented in
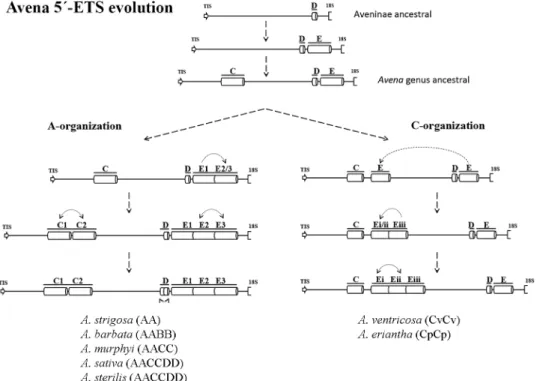
Fig 12for the succession of events involved inAvena genomes evolution. Comparative analysis
of A and C 5’-ETS organizations with sequences from related species revealed that E repeat is only absent inZ. mays and O. Sativa, while D repeat is found in all related species analyzed
(for species and Accession Numbers seeFig 9), suggesting that D repeats are the more ances-tral ones. On the other hand, C repeats present in both organization types seem to be specific ofAvena genus since apart from A. sativa published sequence, no similar sequences are found
through BLAST in NCBI database. Thus, the differences unraveled between A- and C-organi-zations must have emerged after the divergence of theAvena genus from the ancestral
Aveni-nae. Further considering the nucleotide polymorphisms observed between different repeats and between repeats from the distinct species analyzed (S2 Fig) we suggest that the more ancient event that occurred in A-organization was E repeat duplication, followed by C repeat duplication and a second duplication of the E repeat and, lastly, a D repeat duplication arose. Considering the organization pattern disclosed in C genome diploid species, the first plausible event was the duplication/translocation of the final E repeat to upstream the D repeat, followed by subsequent duplications of E repeats that seem to occurred more recently.
Fig 12. Avena 5’-ETS evolution. Representation of the proposed succession of events leading to the establishment of 45S rDNA 5’-ETS A- and C-organization.
Our results prove that the 45S rDNA 5’-ETS domain can be a particularly valuable option to enlighten the phylogenetic pathways of the genusAvena. Indeed, the tree presented based
on the 5’-ETS consensus sequences unraveled a clear separation between the C-genome dip-loid species and the otherAvena species. It must moreover be emphasized that those clusters
ofAvena species are revealed both by the analysis of entire 5’-ETS sequences (Fig 9) as well as when repeat motifs are excluded (Fig 11). Thus, besides the described 5’-ETS repeats narrative, this IGS region discloses a consistent evolutionary history since the phylogenetic analysis per-formed suggest that both 5’-ETS unique sequences and repeat motifs were under the same selection force.
This is particularly important considering the high homology of the internal transcribed spaces traditionally used in phylogenetic studies extensively reported inAvena [5,12,23–25]. Concordantly, 5’-ETS sequences have been previously considered more efficient than tradi-tional ITS1 and ITS2 to study phylogenetic relationships between related species [31,49].
The present work may also be relevant in the context of rDNAloci remodeling events
induced by polyploidization [50,51] corroborating that sequences from C-genome origin NORs tend to be eliminated inAvena polyploid species [5] since complete 5’-ETS C-organi-zation was not detected in polyploid species with C genome. However, the detection of par-tial C-genome 5’-ETS sequences in polyploid speciesA. murphyi, A. sativa and A. sterilis
using C-organization specific primers suggests the occurrence of complex restructuring events induced by polyploidization. Similarly, molecular traces of C-genome specific ITS sequences were reported in polyploid species by [5] corresponding to 1.5% of C-genome ori-gin rDNA copies. Furthermore, it can be suggested that C-genome sequences loss may be correlated with differences in parental genome size inAvena polyploid species. Indeed, C
genome is larger (5.48 pgA.ventricosa) than A-genome (4 to 5.33 pg in A-genome diploid
species) (Plant DNA C-values Database, [52]). Thus, C-organization 5’-ETS sequence loss may be a part of parental genome size homogenization that may preferentially affects the larger parental genome to stabilizeAvena polyploid species, as proposed to other Poaceae
polyploid species [53]. An integrative view of the data obtained in this study evidences that the study ofAvena ribosomal DNA evolution patterns constitute an interesting model to
assess Poaceae taxa evolutionary pathways as well as to understand restructuring events asso-ciated with polyploidization.
Supporting information
S1 Table. Accession numbers. Accession numbers ofAvena sp. 45S rDNA intergenic
sequences. (PDF)
S1 Fig.A. sterilis shorter IGS. Consensus sequence of A. sterilis shorter intergenic spacer
sequence. (PDF)
S2 Fig.Avena sp. 5’ ETS sequences. Alignment of complete and partial Avena sp. 5’ ETS
sequences with the published sequence ofA. sativa between 2320 and 4098 bp (Accession
Number: X74820.1). Complete sequences obtained fromAvena strigosa, A. barbata, A. mur-phyi, A. sativa and A. stetilis (strI to steII), partial sequences obtained with primer ETS2_for
fromA. strigosa, A. sativa and A. sterilis (strIII to steV) and with primer ETS1_for from A. bar-bata, A. ventricosa and A. eriantha (barIII to eriIV).
Formal analysis: JR. Funding acquisition: MS. Investigation: JR. Methodology: JR MS. Project administration: MS. Supervision: MS. Validation: JR MS. Visualization: JR MS.
Writing – original draft: JR MS. Writing – review & editing: JR WV MS.
References
1. Strychar R. World Oat Production, Trade, and Usage. In: Webster F, Wood P, editors. Oats: Chemistry and Technology. Minnesota, U.S.A.: AACC International, Inc.; 2011. p. 1–10.
2. Loskutov I, Rines H. Avena. In: Kole C, editor. Wild Crop Relatives: Genomic and Breeding Resources: Springer Berlin Heidelberg; 2011. p. 109–83.
3. Katsiotis A, Loukas M, Heslop-Harrison JS. Repetitive DNA, genome and species relationships in Avena and Arrhenatherum (Poaceae). Ann Bot-London. 2000; 86(6):1135–42.
4. Linares C, Ferrer E, Fominaya A. Discrimination of the closely related A and D genomes of the hexa-ploid oat Avena sativa L. Proc Natl Acad Sci U S A. 1998; 95(21):12450–5. PMID:9770506
5. Nikoloudakis N, Katsiotis A. The origin of the C-genome and cytoplasm of Avena polyploids. Theoretical and Applied Genetics. 2008; 117(2):273–81.https://doi.org/10.1007/s00122-008-0772-9PMID: 18463841
6. Katsiotis A, Hagidimitriou M, HeslopHarrison JS. The close relationship between the A and B genomes in Avena L (Poaceae) determined by molecular cytogenetic analysis of total genomic, tandemly and dis-persed repetitive DNA sequences. Ann Bot-London. 1997; 79(2):103–9.
7. Ananiev EV, Vales MI, Phillips RL, Rines HW. Isolation of A/D and C genome specific dispersed and clustered repetitive DNA sequences from Avena sativa. Genome. 2002; 45(2):431–41. PMID: 11962640
8. Loskutov IG. On evolutionary pathways of Avena species. Genet Resour Crop Ev. 2008; 55(2):211–20. 9. Badaeva ED, Shelukhina OY, Dedkova OS, Loskutov IG, Pukhalskyi VA. Comparative cytogenetic
analysis of hexaploid Avena L. species. Russian Journal of Genetics. 2011; 47(6):691–702. 10. Fominaya A, Hueros G, Loarce Y, Ferrer E. Chromosomal distribution of a repeated DNA sequence
from C-genome heterochromatin and the identification of a new ribosomal DNA locus in the Avena genus. Genome. 1995; 38(3):548–57. PMID:7557363
11. Irigoyen M, Loarce Y, Linares C, Ferrer E, Leggett M, Fominaya A. Discrimination of the closely related A and B genomes in AABB tetraploid species of Avena. Theoretical and Applied Genetics. 2001; 103:1160–6.
12. Tomas D, Rodrigues J, Varela A, Veloso MM, Viegas W, Silva M. Use of Repetitive Sequences for Molecular and Cytogenetic Characterization of Avena Species from Portugal. International Journal of Molecular Sciences. 2016; 17(2).
13. Fu YB, Chong J, Fetch T, Wang ML. Microsatellite variation in Avena sterilis oat germplasm. Theoretical and Applied Genetics. 2007; 114(6):1029–38.https://doi.org/10.1007/s00122-006-0496-7PMID:17265024 14. He X, BjørnstadÅ. Diversity of North European oat analyzed by SSR, AFLP and DArT markers.
Theo-retical and Applied Genetics. 2012; 125(1):57–70.https://doi.org/10.1007/s00122-012-1816-8PMID: 22350091
15. Leisˇova´ L, Kučera L, Dotlačil L. Genetic Resources of Barley and Oat Characterised by Microsatellites. Czech J Genet Plant Breed. 2007; 43:97–104.
16. Li CD, Rossnagel BG, Scoles GJ. The development of oat microsatellite markers and their use in identi-fying relationships among Avena species and oat cultivars. Theoretical and Applied Genetics. 2000; 101(8):1259–68.
17. Goffreda JC, Burnquist WB, Beer SC, Tanksley SD, Sorrells ME. Application of Molecular Markers to Assess Genetic-Relationships among Accessions of Wild Oat, Avena sterilis. Theoretical and Applied Genetics. 1992; 85(2–3):146–51.https://doi.org/10.1007/BF00222852PMID:24197297
18. Morikawa T, Nishihara M. Genomic and polyploid evolution in genus Avena as revealed by RFLPs of repeated DNA sequences. Genes Genet Syst. 2009; 84(3):199–208. PMID:19745568
19. Fu YB, Williams DJ. AFLP variation in 25 Avena species. Theoretical and Applied Genetics. 2008; 117 (3):333–42.https://doi.org/10.1007/s00122-008-0778-3PMID:18461302
20. Paczos-Grzeda E, Bednarek PT. Comparative analysis of hexaploid Avena species using REMAP and ISSR methods. Turk J Bot. 2014; 38(6):1103–11.
21. Tanhuanpaa P, Kalendar R, Laurila J, Schulman AH, Manninen O, Kiviharju E. Generation of SNP markers for short straw in oat (Avena sativa L.). Genome. 2006; 49(3):282–7. PMID:16604112 22. Richard GF, Kerrest A, Dujon B. Comparative Genomics and Molecular Dynamics of DNA Repeats in
Eukaryotes. Microbiology and Molecular Biology Reviews. 2008; 72(4):686–727.https://doi.org/10. 1128/MMBR.00011-08PMID:19052325
23. Nikoloudakis N, Skaracis G, Katsiotis A. Evolutionary insights inferred by molecular analysis of the ITS1-5.8S-ITS2 and IGS Avena sp. sequences. Mol Phylogenet Evol. 2008; 46(1):102–15.https://doi. org/10.1016/j.ympev.2007.10.007PMID:18039583
24. Peng YY, Baum BR, Ren CZ, Jiang QT, Chen GY, Zheng YL, et al. The evolution pattern of rDNA ITS in Avena and phylogenetic relationship of the Avena species (Poaceae: Aveneae). Hereditas. 2010; 147 (5):183–204.https://doi.org/10.1111/j.1601-5223.2010.02172.xPMID:21039456
25. Rodionov AV, Tyupa NB, Kim ES, Machs EM, Loskutov IG. Genomic configuration of the autotetraploid oat species Avena macrostachya inferred from comparative analysis of ITS1 and ITS2 sequences: On the oat karyotype evolution during the early events of the Avena species divergence. Russian Journal of Genetics. 2005; 41(5):518–28.
26. Polanco C, De La Vega MP. The structure of the rDNA intergenic spacer of Avena sativa L.: a compara-tive study. Plant Mol Biol. 1994; 25(4):751–6. PMID:8061326
27. Polanco C, De La Vega MP. Intergenic ribosomal spacer variability in hexaploid oat cultivars and landra-ces. Heredity. 1997; 78:115–23.
28. Cluster PD, Allard RW. Evolution of Ribosomal DNA (rDNA) Genetic-Structure in Colonial Californian Populations of Avena barbata. Genetics. 1995; 139(2):941–54. PMID:7713443
29. Jellen EN, Phillips RL, Rines HW. Chromosomal Localization and Polymorphisms of Ribosomal DNA in Oat (Avena Spp). Genome. 1994; 37(1):23–32. PMID:18470058
30. Linder CR, Goertzen LR, Heuvel BV, Francisco-Ortega J, Jansen RK. The complete external tran-scribed spacer of 18S-26S rDNA: Amplification and phylogenetic utility at low taxonomic levels in Aster-aceae and closely allied families. Mol Phylogenet Evol. 2000; 14(2):285–303.https://doi.org/10.1006/ mpev.1999.0706PMID:10679161
31. Inacio V, Rocheta M, Morais-Cecilio L. Molecular Organization of the 25S-18S rDNA IGS of Fagus syl-vatica and Quercus suber: A Comparative Analysis. PLoS ONE. 2014; 9(6).
32. Don RH, Cox PT, Wainwright BJ, Baker K, Mattick JS. ’Touchdown’ PCR to Circumvent Spurious Prim-ing durPrim-ing Gene Amplification. Nucleic Acids Res. 1991; 19(14):4008-. PMID:1861999
33. White T, Bruns T, Lee S, Taylor J. Amplification and direct sequencing of fungal ribosomal RNA genes for phylogenetics. In: Innis M, Gelfand D, Shinsky J, White T, editors. PCR Protocols: A Guide to Meth-ods and Applications: Academic Press; 1990. p. 315–22.
34. Darriba D, Taboada GL, Doallo R, Posada D. jModelTest 2: more models, new heuristics and parallel computing. Nat Methods. 2012; 9(8):772-.
41. Zuker M. Mfold web server for nucleic acid folding and hybridization prediction. Nucleic Acids Res. 2003; 31(13):3406–15. PMID:12824337
42. Hasegawa M, Kishino H, Yano TA. Dating of the Human Ape Splitting by a Molecular Clock of Mitochon-drial-DNA. J Mol Evol. 1985; 22(2):160–74. PMID:3934395
43. Kimura M. A Simple Method for Estimating Evolutionary Rates of Base Substitutions through Compara-tive Studies of Nucleotide-Sequences. J Mol Evol. 1980; 16(2):111–20. PMID:7463489
44. Tamura K. Estimation of the Number of Nucleotide Substitutions When There Are Strong Transition-Transversion and G+C-Content Biases. Mol Biol Evol. 1992; 9(4):678–87. PMID:1630306
45. Boutte J, Aliaga B, Lima O, de Carvalho JF, Ainouche A, Macas J, et al. Haplotype Detection from Next-Generation Sequencing in High-Ploidy-Level Species: 45S rDNA Gene Copies in the Hexaploid Spar-tina maritima. G3-Genes Genom Genet. 2016; 6(1):29–40.
46. Chang KD, Fang SA, Chang FC, Chung MC. Chromosomal conservation and sequence diversity of ribosomal RNA genes of two distant Oryza species. Genomics. 2010; 96(3):181–90.https://doi.org/10. 1016/j.ygeno.2010.05.005PMID:20580815
47. Carvalho A, Guedes-Pinto H, Lima-Brito J. Intergenic spacer length variants in Old Portuguese bread wheat cultivars. Journal of Genetics. 2011; 90(2):203–8. PMID:21869468
48. Galian JA, Rosato M, Rossello JA. Incomplete sequence homogenization in 45S rDNA multigene fami-lies: intermixed IGS heterogeneity within the single NOR locus of the polyploid species Medicago arborea (Fabaceae). Ann Bot-London. 2014; 114(2):243–51.
49. Baldwin BG, Markos S. Phylogenetic utility of the external transcribed spacer (ETS) of 18S-26S rDNA: Congruence of ETS and ITS trees of Calycadenia (Compositae). Mol Phylogenet Evol. 1998; 10 (3):449–63.https://doi.org/10.1006/mpev.1998.0545PMID:10051397
50. Maluszynska J, Heslop-Harrison JS. Physical Mapping of rDNA Loci in Brassica Species. Genome. 1993; 36(4):774–81. PMID:18470023
51. Pontes O, Neves N, Silva M, Lewis MS, Madlung A, Comai L, et al. Chromosomal locus rearrange-ments are a rapid response to formation of the allotetraploid Arabidopsis suecica genome. P Natl Acad Sci USA. 2004; 101(52):18240–5.
52. Bennett MD LI. Plant DNA C-values database (release 6.0, Dec. 2012) 2012.
53. Bento M, Gustafson JP, Viegas W, Silva M. Size matters in Triticeae polyploids: larger genomes have higher remodeling. Genome. 2011; 54(3):175–83.https://doi.org/10.1139/G10-107PMID:21423280