Detection and identification of registration and fishing gear in
vessels
Jorge Miguel de Albuquerque Branquinho
Dissertation submitted as a partial requirement to obtain a Master's degree in: Information Systems and Knowledge Management
Professor:
PhD João Carlos Amaro Ferreira
ISCTE-IUL
Contents
I. INTRODUCTION ... 11
A. Motivation and framing ... 11
B. Objectives ... 12
C. Research questions ... 12
D. Investigation method ... 13
E. Contributions ... 18
II. LITERATURE REVIEW AND RELATED WORK ... 19
A. Overview ... 19
B. Methodology in object detection ... 21
C. Feature detection ... 22
D. Pixel-based detection ... 23
E. Object-based detection ... 24
F. Infrared-based detection ... 26
G. Part-based detection ... 26
H. Convolutional neural networks ... 27
I. Frameworks ... 28
III. METHODS AND SYSTEM DEVELOPED ... 30
A. System architecture and constraints ... 30
B. Non-boarded System ... 33
Comparison with similar systems ... 36
Vessel Detection Module ... 40
ROI Analysis Module ... 47
OCR Module ... 57
C. Boarded System ... 62
IV.COMMERCIAL SYSTEM ... 65
A. Non-Boarded System ... 65
B. Boarded System ... 68
V. RESULTS ... 70
A. Non-Boarded System ... 70
Vessel Detection Module ... 70
OCR Module ... 73
B. Boarded System ... 74
VI.CONCLUSION AND FUTURE WORK ... 76
VII. REFERENCES... 79
Abstract—Illegal, unreported and unregulated (IUU) fishing is a global menace to both marine ecosystems and sustainable fisheries. IUU products often come from fisheries lacking conservation and management measures, which allows the violation of bycatch limits or unreported catching. To counteract such issue, some countries adopted vessel monitoring systems (VMS) in order to track and monitor the activities of fishing vessels. The VMS approach is not flawless and as such, there are still known cases of IUU fishing. The present work is integrated in a project PT2020 SeeItAll of the company Xsealence and was included in INOV tasks in which a monitoring system using video cameras in the Ports (Non-boarded System) was developed, in order to detect registrations of vessels. This system registers the time of entry or exit of the vessel in the port. A second system (Boarded System) works with a camera placed in each vessel and an automatic learning algorithm detects and records fishing activities, for a comparison with the vessel’s fishing report.
Keywords — Fishing, Vessel, CCTV, Image Processing, Plate Recognition, Machine Learning, Computer Vision, Machine Vision
Resumo — A pesca ilegal, não declarada e não regulamentada (INDNR) é uma ameaça global tanto para os ecossistemas marinhos quanto para a pesca sustentável. Os produtos INDNR são frequentemente provenientes de pescas que não possuem medidas de conservação e de gestão, o que permite a violação dos limites das capturas ou a captura não declarada. Para contrariar esse problema, alguns países adotaram sistemas de monitoramento de embarcações (VMS) para acompanhar e monitorar as atividades dos navios de pesca. A abordagem VMS não é perfeita e, como tal, ainda há casos conhecidos de pesca INDNR. O presente trabalho encontra-se integrado num projeto PT2020 SeeItAll da empresa Xsealence. Este trabalho integrado nas tarefas do INOV no qual foi desenvolvido um sistema de monitorização das entradas dos navios nos Portos (Sistema não embarcado) no qual pretende-se desenvolver um sistema que detete as matriculas dos navios registando a hora de entrada e saída do porto com recurso da camaras de vídeo. A outra componente (sistema embarcado) é colocada em cada embarcação uma camara de video e, recorrendo a aprendizagem automática e um sistema de CCTV, são detetadas as atividades de pesca e gravadas, para posterior comparação com o relatório de pesca do navio.
Palavras-chave — Pesca, Embarcação, CCTV, Processamento de Imagem, Reconhecimento de matriculas, aprendizagem automática, visão artificial
Acknowledgments
Firstly, I would like to express my sincere gratitude to my advisor Professor João Ferreira for the continuous support during this dissertation, for his patience, motivation, and experience. His guidance was crucial to accomplish this dissertation. I would also like to thank my girlfriend, my family and friends for all the support.
I. INTRODUCTION
A. Motivation and framing
Illegal, unreported and unregulated fishing (IUU) is one of the greatest threats to the preservation of endangered species, responsible for the destruction of marine habitats, distortion of competitive logic, weakening coastal communities and places licensed fishers at a disadvantage. According to data from the European Commission of fisheries and maritime affairs (European Commission, 2016a), illegal fishing accounts for about 15% of global catches, amounting around € 10 billion / year.
The EU, together with other international organizations, is making efforts to address the gaps that allow illegal operators to profit from their activities. Among the issues to be considered, the European Commission of fisheries and maritime affairs (2016) highlights the following:
The catch report does not have a direct inspection, which means the reported information is based exclusively on the information given by the master / captain of the vessel;
The control regulation only provides for the observer (on-board inspector), which is only used in specific international control areas; The only point of control is the landing, where the species and weights
are recorded; There is no control over discards at sea.
Fisheries control focus not only on the verification of fishing activities at sea, but also acting on all points of the chain, since the time of leaving the vessel to the placement of fish on the market. The management of the fishing activity is based on obtaining estimates of fish abundance and mortality imposed by fishing. In order to promote the sustainable exploitation of marine resources, a European quota system has been set up to manage the catch of various species of fish according to various parameters such as abundance, reproductive cycles and their economic value. However, limiting does not reduce the total catches as fishermen optimize the use of their catching capacity by discarding low-value fish, and there is currently no way to quantify discarded fish. In addition to the fish disposal, there is sometimes a deviation between the fish caught and the fish declared by the vessel that overflowed it before reaching the port.
Most of the existing technologies allow the monitoring of vessels during their activity, tracking the vessel’s position over time and determining the fishing activity through logbooks or other reports produced by the vessel’s captain. As such, currently, the only reliable means of verifying the fishing activity are the on-site inspection from the exit of the port until the return of the vessel.
B. Objectives
The proposed system aims to provide the surveillance authorities with an automatic solution that responds to the needs identified in the monitoring, control, management and surveillance systems of fishing activities. To meet those needs, it is intended to develop a surveillance system that allows the control of entrances and exits of fishing vessels in the port, in particular by collecting and processing vessel profile images that identify call sign, IMO or registration. A database holds a log of the port's entries and exits by associating the ship's identifications with the detection timestamp.
The approach followed is based on a CCTV (closed-circuit television) system, therefore it needs support from image processing to recognize objects.
In parallel with the inspection at the port, the project also includes a second module composed of a Vessel Monitoring System (VMS) (European Commission, 2016b), also equipped with a camera, both placed on the vessels. The devices determine the characteristics of the fishing techniques being used in the vessel. The goal is to analyse whether or not there existed a moment during the journey where the crew caught fish, which method was used and the duration of the catching. In addition, the VMS unit records the location of the vessel. The implementation of both the hardware and the VMS unit is outside the scope of this thesis.
The data captured by the cameras of both modules is evaluated through a solution based on machine learning techniques, capable of predicting various forms of the solution and evolving based on the number of cases. In this sense, it is intended to make use, when possible, of rule models from the capture of images through fixed cameras and/or amateur videos, in order to train the algorithm to find the boats and the corresponding identifications, for the first module, and the gear/methods used, for the second module.
The automation of the identification and recognition is one of the most difficult challenges of this work, especially the recognition of the characters of the registration, since it is intended to obtain correct data with a great success rate, without consuming too much time in the analysis, compromising the authorities’ actuation.
C. Research questions
The main goal of this work is to answer the following question:
• “How to create a system capable of interpreting the license/registration of a fishing vessel and identifying the gear/methods of the boats in a robust way, attending to similar technologies already developed?”
In order to answer this question and due to its degree of complexity, there is a need to adopt the methodology of dividing and conquering, that is, to divide this question into smaller questions so that they can be answered easily and directly. The division consists of two main systems: the registration retrieval and the identification of the fishing gear.
Regarding the registration retrieval, some obstacles must be dealt with, including non-contrasting colours to display the registration, vague standards in respect to font types and sizes, lack of specifications on the registration’s positioning and distortion. The following questions stand out:
• “Which are the best methods/algorithms to find fishing vessels, attending the need of satisfactory performance in adverse situations (e.g. bad weather and occlusion)?”
• “Which methods have a performance that enables responses to be delivered as quickly as possible and with an acceptable level of successful recognition?”
As for the identification of the fishing gear/methods, similar issues regarding standards occur, as such the following questions are raised:
• “Can the previous algorithms be applied to find the vessel's registration number? If not, which are the most appropriate methods for this purpose? “
• “What is the most robust method (s) for this module in relation to a probable set of limitations that may have similarities and differences relative to the other module (occlusion, illumination, atmospheric conditions, etc.)?”
D. Investigation method
Concerning the research methodology followed in this thesis, the Design Science Research is a problem-solving process and an information technology research methodology that focuses on the study, development and performance of innovative artefacts containing knowledge. We’ll be focusing on the contributions of Peffers et al. (2006-8), Hevner et al. (2004) and Cardoso (2001). With this methodology, we ought to create new artefacts contributing to the construction and evaluation of generic means-ends relations. Design Science Research reveals the knowledge and understanding of a design problem and its solution are acquired during the building and application of an artefact.
This thesis is composed by the following artefacts, corresponding to each part of the system:
Non-Boarded system:
o A module (composed by a computer vision algorithm) capable of identifying moving vessels and determining the direction of the motion (entering or exiting the harbour).
o A module (composed by a computer vision algorithm) capable of recognizing most of the regions containing characters present in the vessel.
o A module (composed by an OCR algorithm) capable of interpreting the regions determined in the previous module and obtain a portion or totality of the characters.
Boarded system:
o A module, composed by one or several algorithms, able of detecting, tracking and counting the fishing gear in the ship. This procedure has several components designed in a sequence, that is the output of the previous state is the input of the next, while maintaining the possibility of iteration, retroceding to the faulty component. The Design Science Research suggest 7 guidelines for information system research:
1. Design as an artefact – the goal is to produce a viable artefact in the form of a construct, model, method or instantiation. In this work, the artefacts we aim to develop are a model that combines state-of-the-art methods to accomplish two goals: identify fishing vessels nearing a harbour and detect when a fishing occurs observing the behaviour of the fishing gear.
2. Design as an artefact – the goal is to produce a viable artefact in the form of a construct, model, method or instantiation. In this work, the artefacts we aim to develop are a model that combines state-of-the-art methods to accomplish two goals: identify fishing vessels nearing a harbour and detect when a fishing occurs observing the behaviour of the fishing gear.
3. Problem relevance – which states the goal of Design Science Research is to develop technology-based solutions to matters of relevance. The introductory section introduces the importance of this thesis.
4. Design evaluation – This methodology requires the demonstration of quality, rigour and efficiency of the artefacts through well-designed test cases.
5. Research contributions – Design Science Research also suggest the clear and verifiable contributions in the design phases, that serves the purpose of both avoid plagiarism and inefficiency caused by unknown best fitted alternatives.
6. Research Rigor – Rigorous methods in both construction and evaluation of the design artefact are advised.
7. Design as a search process – The effective use of available means to reach the desired end while satisfying the laws in the problem environment results in an also effective artefact.
8. Communication of research – The presentation must be well-presented for both technology and management-oriented audiences.
Figure 1– Design Science Research process model according to Peffers et al. (2007-8).
In parallel to the guidelines, this methodology (Figure 1) is also composed by 6 main activities:
1. Identification and definition of the research problem – the model suggests starting with the identification and definition of the research problem as well as its relevance, which contributes to the development of an artefact capable of supplying a solution. It is necessary to include knowledge of the state of the art of the problem. This activity is contained throughout the introduction of this thesis and later extended in the literature review section, where it is explained the importance of a system capable of identifying fishing vessels and check the conformance of the fishing report by analysing the VMS data, or in other words, whether the fishing gear was used or not.
2. Define the objectives/requirements of the solution - The next step is the definition of the objectives/requirements of the solution, determining what is conceivable either quantitatively or qualitative, followed by the design and development of artefacts that may explain specific segments of the problem. The introduction and the methods discuss and develop this topic in detail, but, to put it in short, and recalling the research questions, it is required an image processing
algorithm, or a combination of image processing algorithms, to be run in a real-time scenario, with the highest detection rate within possible, attending they must ultimately achieve their goals in a great variety of scenarios: identify the fishing gear and determine if any fishing activity is occurring, in the case of the boarded system; and identify a fishing vessel entering or exiting the harbour, in the non-boarded system. 3. Design and development - The third phase involves specifying the
desired functionality of the artefact and its creation. In this phase, the resources necessary are all the knowledge that can sustain a possible solution. The methods section details more about this topic, explaining and detailing the conditions in which the system/algorithms must be able to work, which scenarios are optional or non-relevant, the conditions in which the system can be called a success or a failure and relevant details about the development of this artefacts.
4. Demonstration of the artefact - The succeeding step is the demonstration of the artefact and the goal is to prove its effectiveness to solve ate least one of the instantiations of the problem. It is essential to measure how the objectives of a solution match the observed results from the use of the artefact. As such, in this thesis, the solution must answer the research questions therefore fulfilling the core functionality, that is to detect and help identifying fishing vessels near the harbour and detecting when a vessel is fishing. At this moment, little to no progress has been made, therefore no relevant information was placed in this thesis.
5. Evaluation of the artefact - The fifth stage is a further evaluation and can either be a comparison of the artefact’s functionality with the solution’s goals or a quantitative performance measure. In this work, the solutions are evaluated attending to its performance in the detection and identification, along with its processing time. The system was tested initially in a simulated scenario using a programmable and dynamic animation, simulating with higher or lesser details, and later in a real-life scenario and, if possible, with real fishing vessels.
6. Communication - The final phase is the communication of the research developed. The usefulness of the artefact is announced to relevant audiences and professionals. This is the purpose of the papers that was released during the realization of this thesis.
Figure 2 – Design Science Research process model (Peffers et al. 2007-8) adapted to this thesis
The DSR model suggest 4 major approaches:
1. Problem-centred approach – This approach is starts from the first activity resulting from the observation of the problem / suggested research.
2. Objective-centred approach – On the other hand the objective-centred approach starts on the second step (define objectives) and typically comes from industry and/or a research need and involves creating an artefact to address the problem.
3. Design and development-centred approach – Starts with the third activity (design and development) and is the suitable approach for an Identify problem
and motivate Prevent the IUU fishing and the losses it causes;
Improve current monitoring solutions;
Objectives of a
solution Use state-of-the-art algorithms to achieve the best performance in all the tasks of the system (e.g. vessel detection, OCR and gear detection)
maintaning real-time processing;
Explore and study new alternatives to detect objects;
Design &
development A system divided in 2 parts capable of:
Detecting a vessel, determine the direction its going and its registration;
Detect, track and count the fishing gear being used in the vessel;
Demonstration Performance at achieving its main objectives: best rate of detection
possible, while maintaning real-time performance
Evaluation Simulation enviroment: costumizable animation to simulate the
conditions the system faces;
Real-life enviroment: simulation in an harbour facing similar conditions with passing vessels, for the non-boarded system, and simulation of a real-scale fishing vessel, for the boarded system:
already existing but still incomplete artefact. This approach focuses on adapting the artefact to fit as a solution for the specific problem. 4. Client/context initiated solution – Is generally based on the
observation of a previously implemented solution that worked. The goal is to replicate previous activities and apply rigour to the research.
The problem was previously identified and studied by the European Commission of fisheries and maritime affairs and later by both INOV INESC INOVAÇÃO and Xsealence. Considering this research started with an already mature identification and definition of the problem, this research follows the Objective-centred approach, starting with the definition of the objectives and specification of all the conditions in which the algorithm must work. The remaining steps are all part of this research and correspond to the elaboration of the artefacts, demonstration and evaluation.
E. Contributions
The research made during this dissertation originated the following scientific contributions:
Ferreira, J. C., Branquinho, J., Ferreira, P. C., & Piedade, F. (2017, June). Computer Vision Algorithms Fishing Vessel Monitoring— Identification of Vessel Plate Number. In International Symposium on
II. LITERATURE REVIEW AND RELATED WORK
A. Overview
There are several different ways to monitor commercial fishing operations. The traditional approach includes undertaking dockside compliance and fish market visits. Other approaches have been tackled by numerous authors (McElderry, 2006; Witt & Godley & Christensen & Guenette & Pitcher & Mountain, 2007; Jennings & Lee, 2012), including: using aircraft (manned or unmanned) to overfly fishing vessels; using patrol vessels to undertake at sea boarding or surveillance; using VMS that use satellite positioning data to work out the location and speed of the vessel; sending observers to sea for the duration of a sea trip to collect scientific data or evidence gathering for compliance; and using self-reported data, such as E-logs, paper logbooks, sale-notes, landing declarations.
Blaha described a system having similarities to the intended implementation (Blaha, 2016). This system uses image processing techniques with a VMS system attached to the fishing vessel. The VMS system is activated when it detects load, through weight sensors or when hydraulic mechanisms are activated. Once the VMS system is activated, the camera registers the moment of capture, analysing some of the fish caught in search of protected fish species. The data is stored locally and after each month is then submitted to the corresponding authorities for conformity check. On the other hand, the same system had low accuracy in detecting is private and therefore there isn’t any specifications on the methods or equipment used.
In Mangi’s work, in order to protect seabird populations attracted by fishing activities, an EMS (electronic monitoring system) approach was used to assist in compliance with fish catching standards (Mangi & Dolder & Catchpole & Rodmell & Rozarieux, 2013). Despite this type of systems typically are not exclusive to fishing vessels, the goal is similar, hence its use. The solution consists of a camera system that identifies the presence of birds caught in fishing nets, with a success rate of around 79%, proving that the use of EMS produces accurate results.
To summarize, there is quite a small number of solutions which try to address similar issues with image processing and computer vision. In order to get some starting guidelines, multiple computer vision applications were studied, and the best algorithms are discussed in this section. A common misconception is comparing this project with license plate detection algorithms designed for cars, since there are some considerable differences, including:
Contrasting colours – Car license plates are of contrasting colours (black and white), while vessel registrations allow for a wide variation of colours, including non-contrasting colours. In addition, the white background in car plates is made of a highly reflecting material, while
the foreground is made of a non-reflecting material, easing the distinction of both colours.
Different font sizes – there is a lack of standards in the registration size in vessel’s, making it difficult to predict how large or small is the region we are looking for in the image, even knowing the distance to the vessel. The size often changes for each text, depending on its location in the hull and occasionally there is font size difference in the same word in order to adapt to the hull’s characteristics.
Deformation – car plates are flat, hence not deforming the text. The same can’t be said about the vessel’s registration which often are deformed by the hull’s shape.
Text format – while the license plate number commonly has a fixed format, composed of a fixed number of letters and a fixed number of numbers, some elements in the vessel do not have many formatting rules, such as the name, which can be composed of an undefined number of words of different sizes.
Exposed conditions – Most license plate algorithms work if photos taken in a considerable controlled environment granted by the toll infrastructure, minimizing some atmospheric conditions such as rain and lack or excess lighting. This type of infrastructure may not be possible to provide in a harbour.
As previously mentioned there are 4 modules to implement, each having its own specification and can be solved by different image processing algorithms. Currently, some of the most popular methods used in image processing are visual descriptors, more specifically, frameworks such as HOG classifiers (Dalal & Triggs, 2005), Viola and Jones detectors (Jalled & Voronkov, 2016) or particle filters, mainly due to their performance, as well as training speed. Recently, convolutional neural networks also became quite popular, especially to solve image classification problems. This section reviews object recognition approaches, including some of those previously mentioned, together with their weaknesses and strengths, in order to answer the questions posed in the introductory section, using state-of-the-art technologies. The choice of the solutions is based on the fulfilment of the proposed objectives, valuing the solutions with the best rate of correct identifications, within a limited processing time, allowing the authorities to act if necessary. The purpose of this section is also to explore existing ways of tackling disadvantages if it proves to be rewarding. This sections also debates and evaluates some of the existing frameworks for computer vision and image processing.
B. Methodology in object detection
One of the most important steps it’s the detection of objects: in order to find the vessel’s plate, it is necessary to find the vessel in the first place; and to detect the presence of a fishing equipment it is also necessary to find the object. There are different methods to find objects but an adequate methodology is necessary to ensure robustness and performance.
A computer vision methodology varies depending on the needs, as well as the characteristics of the algorithm. Typically, each author separates each step in their own way, according to their needs and fitting the task.
According to Moeslund et al. (Moeslund & Hilton & Kruger & Sigal, 2011), the steps for a good performance and correct functioning of a computer vision algorithm should follow the following sequence (Figure 3): 1) detection of a new object; 2) classification of the same object into categories of interest; 3) continue to trace the same object while it is visible, thus avoiding repeating the first two steps. Keep in mind these authors develop this methodology for tracking objects. Justin Johnson and Andrej Karpathy (n.d.), use an architecture composed of: 1) Input, where N images of K classes are provided; 2) Learning, where the algorithms learn the features of each class of object; 3) evaluation were a new set of images is provided and algorithm tries to label each image. These authors are specifying this architecture to fit a convolutional neural network. On the other hand, the most commonly accepted model is a broken-down architecture, divided in 6 steps, as shown in Figure 3, which tends to be more general. All these methodologies were taken into account throughout this document. These approaches have different levels of abstractness, different goals, and some rely more on a machine learning type of approach more than other, but the same guideline is used in all three.
Figure 3 – Moeslund, Hilton, Kruger and Sigal’s (2011) methodology for computer vision algorithms (above), Justin Johnson and Andrej Karpath’s (n.d.)
Object Recognition
Identification
Detection
Input
Learning
Evaluation
Image Acquisition Pre-processing Feature Extraction Detection/ segmentation high-level processing Decision making
methodology (middle) and traditional/most common methodology (bottom), according to the same authors (Justin Johnson and Andrej Karpath, n.d.).
There are mostly two main methods for object detection, that act as a starting point to all other algorithms and sub-methods: pixel-based detection and object-based detection. In essence, both methods use features to evaluate whether a pixel belongs to the object or the background, therefore there is a strong relation between feature detection and both pixel-based detection and object-based detection. Due to its importance a section below is dedicated to the detection of features, since it helps explaining some of the approaches later on. Additionally, these features can also be combined with other technologies, such as infrared cameras or complex artificial intelligence, giving rise to innovative high-performance alternatives, some of which are mentioned throughout this section (Moeslund & Hilton & Kruger & Sigal, 2011). This separation is sort of a “grey area”, since different authors have different views regarding grouping or separating these approaches, which use artificial intelligence or help from hardware, in the other two main approaches. In this context it makes sense to separate simpler approaches from complex approaches, therefore the infrared approach and the deep learning approach were separated from the remaining methods of detection.
C. Feature detection
Features define how a computer can identify a certain object, for example, it’s shape and colour. An algorithm searches for a set of rules in order to validate these features, plus a machine learning algorithm can even learn this features on its own. Features are necessary in order to find the objects we are looking for.
There is no universal definition of feature, but is considered a relevant part of an image, since they are what differentiates or associates objects, therefore features are on the basis of any computer vision / image processing algorithm (OpenCV, 2014). When comparing objects, we are looking for repeatability in features between two or more images. The concept of feature detection refers to methods able of making local decisions at every image point, and evaluate whether a given point contains a distinguishable image feature of a given type or not. The most common types of image features are:
Edges – points where there is a boundary between two regions and typically have a strong gradient magnitude.
Corners – refer to point-like features in an image and can be located by looking for high levels of curvature in the image gradient. It is also common to capture small bright points in darker backgrounds, which in the sense of the word is not considered a corner, hence this feature is also referred to as points of interest.
Blobs – also called regions of interest, and often reference to areas in an image which are too smooth to be detected by a corner detector. Ridges – are considered elongated objects and can be thought of as
one-dimensional curve that represents an axis of symmetry.
Figure 4 – Examples of some features and their differences (Opencv, 2014).
Figure 5 – Hierarchy of low-level algorithms in feature detection. These methods are used to extract features, which can later be used in pixel-based, object-based or hybrid detection algorithm (Moeslund & Hilton & Kruger & Sigal, 2011).
D. Pixel-based detection
In this model, the pixels of the image are extracted and compared with a previously developed model, in order to identify each pixel, either as background, or foreground (object). What distinguishes pixel-based detection from feature detection is that the first method parses the detected features and verifies if they match those of the object, while feature detection only focuses on finding features of an image. After performing this filtering, subtracting the background to the image, it is possible in theory to distinguish the silhouette of each object in the image. The pixel based detection method typically has better results in indoor environments where there are no significant changes in the background than in outdoor environments where changing brightness, shadows and atmospheric
Feature detection Edge detection Canny Deriche Differential Sobel Prewitt Roberts Cross Corner detection Harris operator
Shi and Tomasi
Level curve curvature Hessian feature strength measures SUSAN FAST Blob detection Laplacian of Gaussian (LoG) Difference of Gaussians (DoG) Determinant of Hessian (DoH) Maximally stable extremal regions PCBR Ridge detection Hough transform Structure tensor Affine invariant feature detection Affine shape adaptation Harris affine Hessian affine Feature descriptors SIFT SURF GLOH HOG Motion
detection Shape based
Thresholding
conditions may be some of the sources of noise (Moeslund & Hilton & Kruger & Sigal, 2011).
This approach focuses heavily on finding objects that move or are introduced to the scene (Moeslund & Hilton & Kruger & Sigal, 2011; Heikkilä & Pietikäinen, 2006). It should also be complemented with filtering and blob analysis to distinguish the shapes of the object from any other non-relevant objects. For example, in the case of a given moving object, this technique can be used to remove other moving objects (cars, animals, etc.), as Haj et al. states (Haj & Fernández & Xiong & Huerta & Gonzàlez & Roca, 2013). Blob analysis uses the silhouettes to eliminate noise, but there is an added difficulty when there are shadows (Moeslund & Hilton & Kruger & Sigal, 2011; Perez, 2005), because they have similar traits relative to the object, thus requiring a reasoning about the context in order to eliminate the shadows (analysis of atmospheric conditions or colour comparison). This approach is typically lighter in terms of processing but typically has worse results as several authors agree (Lu & Tsechpenakis & Metaxas & Jensen & Kruse, 2005; Gao & Mas, 2008).
Figure 6 – Theoretical example of a process of pixel-based detection and subsequent segmentation, starting with the initial image (left), applying the most effective filter(s) (colour, edge, etc.) and obtaining a binary mapping of all the relevant pixels (middle). The result (right) is the combination of the mapping and the original image, and shows only the relevant information.
E. Object-based detection
Alternatively, in this second approach, a floating window of fixed size navigates through each frame of the video, scaling and undergoing translations in all possible locations of the image. A binary classifier evaluates the presence of the object for each position. The reason why the window is scaled relates to its ability to detect objects at different distances. Each relevant object found is marked with
a box / window that surrounds it, so that it is visible to a user. Methods such as Support vector machines (SVM), AdaBoost and Random Forest Classifiers have been successfully used in the past to sort the contents of the window (Moeslund & Hilton & Kruger & Sigal, 2011; Lienhart & Kuranov & Pisarevsky, 2003). However, to complete only one frame in its entirety it is necessary to adjust the window 10 to 100 thousand times, causing severe delays in the execution time. Using simple and sensitive classifiers, such as SVMs, to, in a first step, traverse the entire image and return a list of locations in the image where there is a greater probability of locating the intended object, while in a second step, a more effective classifier is run in the marked places, confirming the objects, is a good way to increase the performance (Mahadevan & Li & Bhalodia & Vasconcelos, 2010; Mehran & Oyama & Shah, 2009). This method is called cascading. This approach typically fails when the background is far from static, such as when a mobile camera is used for image capture, or when there is partial occlusion phenomenon. This approach typically uses HOG detectors constructed with the notion of edges produced by the object in certain well-defined and non-random locations. It can also be complemented by using Viola and Jones detectors, which combine simple features with cascade classifiers as well as contrast detection (Moeslund & Hilton & Kruger & Sigal, 2011; Lienhart & Kuranov & Pisarevsky, 2003). The Viola and Jones approach, like the cascade approach, requires a previously trained classifier with a set of positive examples and an even larger set of negative examples, so that proper extraction of the characteristics occurs. Precautions should also be taken to avoid overtraining (Lienhart & Kuranov & Pisarevsky, 2003). This approach presents better results, especially in outdoor areas with the possibility of partial occlusion (Moeslund & Hilton & Kruger & Sigal, 2011).
Figure 7 – Theoretical example of an object-based detection algorithm, starting with the original image (left), applying a previously trained cascade classifier (middle) and the resulting window with the relevant object
F. Infrared-based detection
The authors in (Abuarafah & Khozium & AbdRabou, 2012) demonstrate that when there is a large number of objects in the same image, making a real-time identification becomes inefficient or even impossible. In this context, the author proposes the use of a forward looking infrared (FLIR) camera to monitor and estimate the density of people, given the maximum capacity of the site. In the case of the fishing detection module, the presence of heat means the presence of fishermen or fish, which in a significant amount evidences that the vessel is fishing. The use of infrared is based on the fact that at an ambient temperature of 300 Kelvin, a body emits wavelengths in the order of 9.7 μm, situated in the middle of an interval that makes them appear bright. This approach also allows you to obtain images even without the presence of natural light. After the image capture, a geometric algorithm is used to analyse the silhouettes and reduce the number of false positives (for example, motors) (Abuarafah & Khozium & AbdRabou, 2012). This method is not completely foolproof, since in closed or very hot environments it is difficult to detect the differences at thermal level, as well as very bright places for the same reason, as evidenced in (Abuarafah & Khozium & AbdRabou, 2012). This method also requires a calibration taking into account the context, since the human temperature varies in the FLIR cameras according to the time of capture (whether it is day or night) and surrounding temperature. According to (Moeslund & Hilton & Kruger & Sigal, 2011), this calibration must occur every 30 minutes.
Figure 8 – Example of an infrared picture containing people. As shown in the Figure 8, colder surfaces are represented with darker colours and hotter surfaces, like skin, are represented with lighter colours (Anon., 2017, available at: https://alfa-img.com/show/thermal-infrared-people.html).
G. Part-based detection
There are hybrid methods that use both pixel-based, as well as learned features to detect objects: holistic representations (Moeslund & Hilton & Kruger
& Sigal, 2011) (Mahadevan & Li & Bhalodia & Vasconcelos, 2010; Mehran & Oyama & Shah, 2009), part-based (Moeslund & Hilton & Kruger & Sigal, 2011) and local characteristics (Moeslund & Hilton & Kruger & Sigal, 2011; Lienhart & Kuranov & Pisarevsky, 2003). These methods generally are not the most suitable to carry out this type of analysis, since they require very detailed images, long processing times, are sensitive to dynamic scenarios and do not perform well in the event of occlusion (e.g. tires covering the inscription or waves/water). They may, on the other hand, facilitate the task of finding the vessel and the direction in.
H. Convolutional neural networks
Recently, with advances in neural networks, neural convolutional neural networks (CNN) and deep neural networks (DCNN) have gained great popularity, thanks to their efficiency and speed in detecting objects. This approach, because it supports video filmed on dynamic cameras, is also used in some self-driving cars (Perez, 2005). Its disadvantages are the speed, since the processing can even reach the order of minutes per frame, needing task-oriented or optimized hardware (Gao & Mas, 2008), and the fact that, like any neural network, its performance depends on the training of the network (Moeslund & Hilton & Kruger & Sigal, 2011; Gao & Mas, 2008), which is a complicated and time consuming process. For the correct functioning of a neural network, proper training is necessary so that the network can identify objects and distinguish them from the remaining objects in the scene, not forgetting that, like classifiers, too much training can cause the network to recognize only the instances of the Objects used for training, rather than a particular class of objects (Simard & Steinkraus & Platt, n.d.). Other factors to consider are the minimum of acceptable accuracy and the maximum acceptable processing time, since increasing precision increases processing time and vice versa. Angelova et al (Angelova & Krizhevsky & View & Vanhoucke & Ogale & Ferguson, 2015) state that they have developed a network, composed of a set of DCNNs arranged in cascade, with a precision rate of 75%, capable of analysing 15 frames in a second, quite revealing results for the project to be developed, where the rapid achievement of results is valued.
Figure 9 – Example of the mechanisms behind a convolutional neural network (Opencv, 2011-4)
I. Frameworks
There are not many frameworks dedicated to computer vision/image processing and even a fewer number of open source frameworks. OpenCV (Opencv, 2011-4) is by far the most popular tool and also the one with more variety of support platforms – Android, iOS, Linux, Mac OS and Windows – and also programming languages – C/C++, Python and Java. OpenCV is a library of programming functions aiming for real-time applications with great efficiency, displaying optimized libraries, which can take advantage of multi-core processing. This framework is widely accepted worldwide and its community reaches 47 thousand users in diverse areas. Some software tools such as Matlab use OpenCV libraries for computer vision and image processing purposes (Matlab, 1994-2017).
Alternative tools such as SimpleCV tend to base themselves on OpenCV and end up using some of them (SimpleCV, n.d.). PyCVF (Python Computer Vision Framework) is a Python only alternative, but has certain limitations both on the support and compatibility (Python Computer Vision Framework. n.d.). FastCV is a framework available only for mobile and focuses on gesture recognition, face detection, tracking and recognition, text recognition and tracking and augmented reality (FastCV Computer Vision SDK - Qualcomm Developer Network, (n.d.). Xpcv (n.d.) is another modular cross-platform framework designed for rapid prototyping of computer vision systems and its programming works on a drag and drop interface with blocks of code, in which an input is received and an output is transmitted to the next block. Each block can be configured with different parameters. Khoros (n.d.) is an older alternative from 1995 with few supported systems.
The most fitted framework for the purpose of this thesis is OpenCV considering its open source, support in both the operating systems level as well as diversity
of compatible programming languages and for its large community, which can provide useful suggestions.
III. METHODS AND SYSTEM DEVELOPED
A. System architecture and constraints
This section details the system architecture, using a top-down approach, starting from the solution as a whole, and then breaking it down to two parts and again breaking each of them in their corresponding modules. In this chapter, when analysing each component, all the constraints are detailed. Each component is also compared with different state-of-art methods and algorithms.
The proposed architecture is composed of two parts, as previously mentioned: One of the parts registers the identification of the fishing vessels entering or exiting the harbour (non-boarded system) and the other part monitors fishing activities in each vessel (boarded system). These parts of the solution are addressed as systems. Figure 10 clarifies how both systems fit in the overall architecture.
Figure 10 – The solution and corresponding parts.
Recalling the previous sections, some of the algorithms discussed are eliminated as they are not fitted for the task: The convolutional neural networks may require too much time, data and better hardware, which are all resources unavailable during the elaboration of this project; Due to hardware and budget limitations it is not possible to install any infrared cameras in the boarded system, despite the infrared could be used to find humans and determining, by their actions, if the kind of activity they were doing was related to fishing. This solution is also not feasible in the non-boarded system considering it would not contribute to identifying vessels.
The implementation of both systems occurred in two main phases: phase of experimentation and testing of algorithms in order to identify the best solution and the phase of implementation of the algorithm into their respective platforms: a computer for the non-boarded system and a VMS unit for the boarded system.
SeaITall
Non-boarded System
•Registers vessels entering/exitingthe harbor
Boarded System
•Registers fishing activitiesThe first phase (testing) was performed using MATLAB because it is a popular high-level language in the area of computer vision, reducing effort and implementation time. The system created was called Test Environment and the idea is to quickly understand the capabilities and performance of a given algorithm and evaluate its implementation effort. There is, however, a disadvantage: by the ease and optimization of MATLAB it is common for complex applications to be developed, making it difficult or even impossible to implement it in another language, which can lead to the redesign of the solution.
The second phase, Production Environment, is different for each of the systems. As for the Non-boarded system, it consists of the implementation in .NET with access to DLLs developed in C ++, containing the algorithms tested in the Test Environment. The .NET platform is used due to the ease of implementation with the hardware component and its robustness, being essentially in charge of managing the hardware and coordinating it with the algorithm. Figure 12 illustrates how the components are connected in the production environment. Despite the existence of wrappers, the algorithm was developed in C++, in order to maintain all OpenCV functions without having an abstraction of variables that may have led to non-linear behaviour. The development was iterative and sometimes it became necessary to go back to the first phase to redesign the algorithm when converting from MATLAB to C ++ due to its complexity. Figure 11 outlines the tasks of each of the environments.
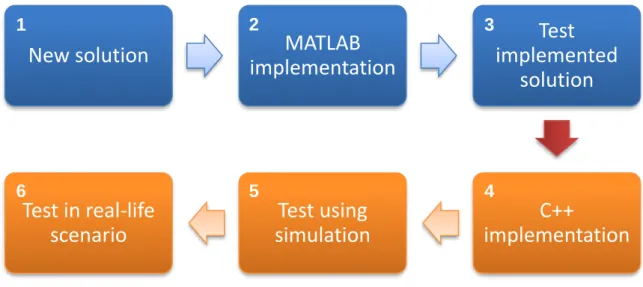
Figure 11 – The test environment is represented in blue, corresponding to steps 1 to 3. The production environment is represented in orange.
New solution
implementation
MATLAB
Test
implemented
solution
C++
implementation
Test using
simulation
Test in real-life
scenario
1 2 3 4 5 6
Figure 12 – Abstraction of the roles of each component in the production environment.
The boarded system’s production environment is design in a similar fashion as the previous system, with the exception the developed processing unit is now as shared object instead of a DLL, because this system’s target operating system is Linux, instead of Windows. Also, the .NET platform is a black box controlled by Xsealence and can be changed without affecting the algorithm’s performance.
B. Non-boarded System
As for the non-boarded system, it determines vessel’s registration by analysing the photo taken by the photographic camera, which is triggered when a video (context) camera detects a vessel passing by. As previously explained the algorithm is written in C++ and is managed by a .NET executable. The algorithm is composed of three modules. Despite being in the same DLL, each module is called separately and report to the .NET executable, which may or not activate the next module. The three modules are:
Vessel detection module - responsible for finding a possible vessel in the surrounding area, using the context camera, and trigger the photographic camera;
ROI (region of interest) analysis module - which analyses the high-resolution image for regions that may contain elements of interest (namely areas containing characters);
OCR module - tasked with recognising the text in each area detected by the previous module. Additionally, the results are stored locally and can be later retrieved using a web service.
Figure 13 sums up the constitution of the system, including relevant hardware components and the three software modules. In this diagram, there is no distinction between the DLL and the executable. The lighter colours are used to represent the software and the darker colours the hardware. At the bottom, there is an example of input and output of the system.
Figure 13 - Diagram of the relevant hardware and software that compose the non-boarded system (top), and example of a possible input and expected output (bottom).
The non-boarded system is operated with high resolution images, therefore eliminating the maximum noise possible is imperative. One simple and effective approach is to apply a filter to the colours of the image, more specifically converting the whole image to monochromatic and then eliminate all values that are neither light or dark.
The non-boarded system was placed in a harbour (Nazaré’s harbour) and initially was considered two options regarding the placement of the camera, as shown in Figure 14:
Option 1 – Entrance closer to the sea:
o Allows a 100-meter gap between each side of the canal; o Public access;
o Possibility of contemplating undulation. Option 2 – Entrance near the core of the harbour:
o Passage width of 80 meters;
o Restricted access with lower chance of vandalism; o Protection against undulation;
o Vessels slow down near the narrow passage.
As different locations may require different algorithms, considering the inputs are disparate as well, the location chosen may be relevant in order to guarantee correct results. Option 2 proved to be the most advantageous as are discussed in the rest of this section.
Figure 14 - Geographic characteristics of the harbour and the two possible camera positions (Google Maps, 2016)
The hardware concerning the non-boarded system is composed of two cameras: one low resolution video camera (Bosch’s DINION IP starlight 7000 HD) and a photographic high-resolution camera (IDS’ UI-5490RE-C-HQ). The filming camera seeks moving vessels nearing the canal, triggering the photographic camera when the ship enters or exits the harbour, as such this camera is addressed as context camera. The choice of the cameras took into account a previous study where the requirements to ensure a minimally satisfactory operation of the solution for the site were analysed, considering a limited budget for the project.
In this way, for the reasons previously highlighted, the passage with 80 meters of width was chosen. It should be noted the depth of the passage is deeper in the centre and not navigable at the edges, giving a margin of about 10 to 15 meters from the edges was considered. In cooperation with several agencies selling CCTV equipment, the chosen video camera has a better price-quality ratio, guaranteeing an ideal quality between 24 and 70 meters, for a lens aperture of 29.91º, an exposure time of 3.33 and considering the maximum navigable speed of 10km / h within the channel, covering most of the channel's navigable area. Taking into account the camera's settings, the resolution is 10.6 Mpix, producing an image with 10 to 30 pixels per letter, and ensuring that letters up to 9 meters’ high are still fully framed and readable in the image.
For the photographic camera, a maximum stern width of about 4.5 meters, a maximum stern length of 5.5 meters and a camera height of 5 meters was considered. With the camera parameterized for a lens aperture of 28.1 ° and a resolution of 720pixels, a CCD ratio of 9, a slope of 36.3 ° and considering a loss of 1 meter resulting from a dead angle of 11.3 °, the visible length of Stern is
about 5.47 meters. The vision of the camera covers a width of 4.76 meters next to the camera and 9.71 in the maximum length of the stern.
Comparison with similar systems
A common fallacy during the project design was the comparison with car registrations. There are a number of differentiating features that can make it difficult to apply algorithms used to detect car plates. Many of these differences relate to existing standards or, generally, to their lack, essentially in the construction and maintenance of vessel registrations. The understanding of these differences is critical to the understanding of the choice of algorithms and approaches used, since due to the purpose of the objects to be found and the human being's ability to identify characters, we easily assume similarities that may not be linear for an image processing algorithm. These differences are described below in Table 1.
Feature Cars Vessels Relevance
Bounding box Yes Optional Ease of delimiting and extracting straight lines and contours
Standard colors Yes (black letters in white
background)
No Ease to search for
certain colors, by intensity or values (Hue or RGB)
Contrasting colors Yes Yes, but open to interpretation
Ease of identifying contours and intensity changes
Standard font size Yes No, but with maximum and minimum limits
Ease of calculating the angle of
skewness and rotation and ease to search for contours with the same thickness Occlusion, degradation and/or damage Unusual and usually mild Common and more severe Phenomena of occlusion, rust or damage may prevent the correct identification of one or more characters, as they may
partially or completely hide
characters from the registration Control of the environment Controlled (toll) Little control (exterior) A controlled environment that limits angles, speeds, camera-to-vehicle spacing, lighting and environmental phenomena (e.g. rain or fog) allows faster and more efficient processing Skewness and rotation of license plate characters Uniform between vehicles and between the characters of the license plate Varies depending on hull position and curvature A large variation of the skew between the characters of the same
registration may prevent the calculation of a slope angle that satisfies all the characters
Table 1 – Comparison between some of the characteristics of car and boat registrations
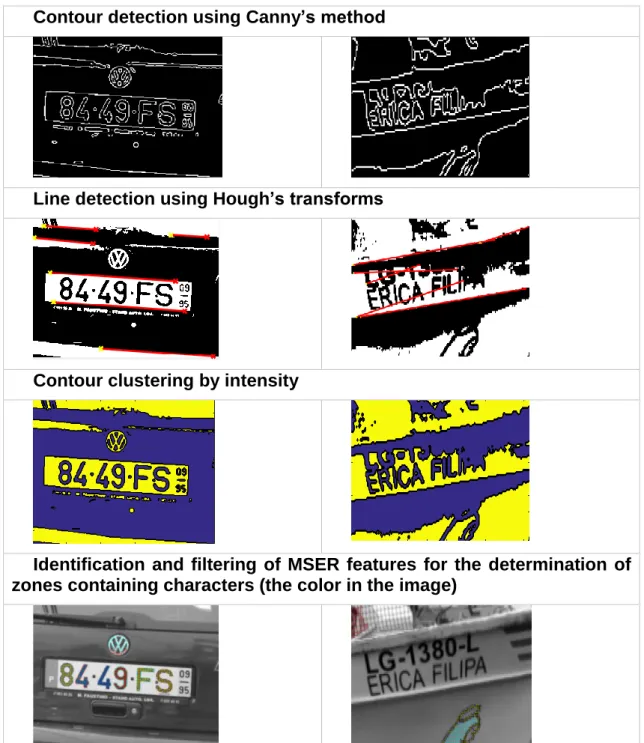
Table 2 shows examples of car registrations and vessel registrations, as well as their representation after a thresholding operation using the Otsu method (Otsu, 1979), using 16 bins. In Table 3 are other common methods for license plate detection using pixel-based detection. Starting from the thresholding operation, it is possible to observe that some of the letters of the boat registration are not detached from the shade caused by the hull. Note the presence of the well-defined bounding box on the car registration plate and the corresponding line detection (Table 3, line 2). From the orientation of the detected lines it is possible to calculate the skew of the image. In the image of the vessel, even with the unusual edges around the characters, it is possible to notice the noise caused by shadows and the curvature of the hull, making it difficult to determine the skew using these lines. This problem is compounded by the fact that the letters of the vessel can still be painted with a light coloured on a dark background. This lead, in addition to determining the colours of the letters, to the inversion of the colours of the binary image. After identifying and filtering MSER features on both images, it is now possible to obtain the car registration letters along with the car symbol.
Original Binary Image
Contour detection using Canny’s method
Line detection using Hough’s transforms
Contour clustering by intensity
Identification and filtering of MSER features for the determination of zones containing characters (the color in the image)
Table 3 – Application of common algorithms in the license plate recognition to a registration of a vessel
Vessel Detection Module
For the detection of passage of vessels, we chose simpler approaches, so as to allow rapid action by the software. In other words, it is intended to take high-quality photography when the vessel is navigating in front of the camera, so the processing delay is a variable in consideration. The chosen approach should be lightweight in order to allow the camera to be activated at the right time. In this way, the pixel-based detection approach is the most appropriate since the processing times are considerably lower and because a greater number of false positives are preferred. The false positives can later be eliminated in the other modules. A greater number of false positives is preferred to missed vessels because the failure to identify a moving vessel compromises the performance of the entire system. Figure 15 describes how the field of view of the cameras is positioned.
Figure 15 – Field of view of the context camera (1) and Field of view of the photographic camera (2)
The field of view of the photographic camera is represented by the number 2 and a darker colour. This representation is the area that is captured in the photograph. The field of view of the context camera is marked by the number 1 and represented in a light colour. This is the area where it is determined if there is a passing vessel. This translates in little space and time to detect the vessel in time to take the photograph when the vessel is passing in the conjoint field of view. The direction in which the vessel is moving is also a parameter to obtain. There were two alternatives considered: object tracking or register if the movement was detected in the left or right side of the field of view.
The test consisted at first in videos gathered from the internet, in a second phase blender animation. In this animation obstacles and weather changes could be manipulated (e.g. undulation or fog) as well as camera angles providing a
2
good and extent test case scenario. Lastly the system was tested in field. Below are described the most successful approaches:
Kalman filter
Kalman filters are one of the most robust and fault-tolerance solutions in a wide range of applications (Moeslund, T. B., Hilton, A., Kruger, V., & Sigal, L. (2011). In image processing, it is very commonly used to detect and track changes in a video feed, i.e., moving objects. The kalman filter is always adjusting to the current conditions, which make it very sensible to small changes in almost static environments and less sensitive to small changes when the environment is dynamic. This adaptability makes the kalman filter an ideal method for tracking. Using a simple thresholding of the areas with detected movement work can be used most of the times to eliminate high sensibility detections. When a moving vessel approaches, a big area pops up, triggering the system to take a photograph, and using the center of the detected blob, it can be used to track the vessel location. From all the algorithms tested, using a kalman filter is one of the approaches with higher performance and reduced complexity, using libraries such as OPENCV. The downside of this method is the need to keep a series of mask images, which using a C++ DLL is a computer intensive task, since a DLL call cannot store objects, forcing the objects to be constantly passed from the calling program to the DLL. This minimizes its performance critically to the point where some of the vessels were lost, due to the limited size of the field of view of the context camera.
Figure 16 – Example of the kalman filter aplied to a simulation made in blender (left) and a video (right).
MOG Background subtraction
This approach is similar to the kalman filter technique, mainly due to the image subtraction eliminating most of the background of the image. There are several image subtraction techniques, including different version of the MOG background subtraction, depending on the desired sensibility. In this approach, a mask image is created, able to store the similarities of the provided images. This mask works similar to a stack or queue, where a parameter defines the maximum number of images it holds. The greater the number of images stored the more accurate it becomes. And for about 500 images stored in the mask, the algorithm’s performance is accurate enough to detect big moving objects, i.e., passing vessels. Since this solution is very similar to the kalman filter, both the
performance and downsides are the same. The need to keep the masked image, and constantly pass it to the managed code limits its efficiency, making it lose some of passing vessels, due to the processing delay.
Pixel-based detection
Tweaking the image using certain image processing functions is a quick and valid way to segment a moving object. While other methods tend to adapt to the circumstances, pixel-based detection must be done carefully because it is easier to adapt a method for very specific cases. Several approaches were tried, all based on pixel-based principles, most of which didn’t achieved the desired performance. Unlike with the kalman filter and the background subtraction, these approaches took in consideration the method is used by a DLL, which means no objects can be stored in memory, and must be as fast as possible. Some of the approaches track the vessel, while other rely on the origin of the trigger (rather if it was triggered on the left or right side of the field of view) or comparing the coordinates of the biggest contour. Below are presented some of the most relevant implemented/tested approaches:
First approach:
Input: two successive frames
Output: Ratio between number of white pixels and total pixels 1. Image subtraction;
2. Grayscale conversion; 3. Binary thresholding; 4. Pixel counting; 5. System trigger.
Performance: It was given an adjustable threshold parameter, still no perfect value was found. That is if the value was too low, it captured a lot of false positives (e.g. waves), and for higher values some of the smaller fishing boats were undetected. There was no way to tell which direction the vessel moved besides the origin of the trigger (left or right-side).
Second approach:
Input: two successive frames
Output: Ratio between number of white pixels and total pixels; coordinates of biggest contour; 1. Grayscale conversion; 2. Image subtraction; 3. Intensity thresholding; 4. Gaussian blur; 5. Binary thresholding;
6. Contour detection;
7. Store coordinates of the biggest contour; 8. Pixel counting;
9. System trigger.
Performance: It was able to track the vessel, but a perfect threshold value was still difficult to find, and as a result, some vessels weren’t captured and there was a notable number of false positives.
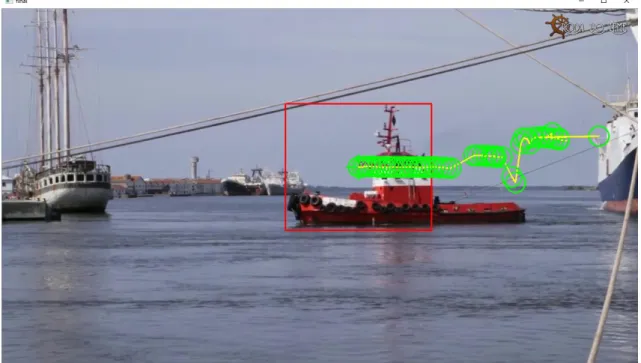
Figure 17 – Output displayed after running the algorithm on a video. In green are represented the centroids of the object for each frame processed, and yellow, to join the centroids, the estimated path covered by the object.
Figure 18 – Graphic representation of the location of the centroids of the previous image. In the x-axis are represented the processed frames and in the y-axis the difference between the positions in the XX y-axis of the centroids, from one frame to the next.
Third approach:
Input: two successive frames
Output: Ratio between number of white pixels and total pixels; coordinates of biggest contour;
1. Gaussian blur;
2. Image subtraction (in RGB); 3. Grayscale conversion; 4. Contour detection;
5. Store coordinates of the biggest contour;
a. Optionally, comparing the shape of the contour with the previous contour - improves accuracy when the contour that defines the object is stable, but worsens if there are differences in the contour
6. Pixel counting; 7. System trigger.
Performance: It was able to track the vessel and had a better overall performance. But attending to the limited space of the field of view of the cameras this approach couldn’t be implemented in the final version of the system.
-150 -100 -50 0 50 100 150 0 10 20 30 40 50 60
Figure 19 – Output presented after the execution of the 3rd approach in the same video.
Figure 20 – Graphical representation of the differences of the coordinates of the centroids calculated using the 3rd approach. A notable improvement can be noted comparing to previous approaches.
Forth approach:
Input: one frame, a background image and 3 regions of interest, 2 denoting the zones from which the vessels can appear and one to detect the color of the water;
Output: Ratio between number of white pixels and total pixels; coordinates of biggest contour; -300 -200 -100 0 100 200 300 0 10 20 30 40 50 60