www.jped.com.br
ORIGINAL
ARTICLE
Adolescents’
healthy
lifestyle
夽
Adilson
Marques
a,b,c,∗,
Nuno
Loureiro
c,d,
Bruno
Avelar-Rosa
e,f,
Ana
Naia
e,g,
Margarida
Gaspar
de
Matos
c,eaUniversidadedeLisboa,FaculdadedeMotricidadeHumana,CentroInterdisciplinardoEstudodaPerformanceHumana,Lisbon, Portugal
bUniversidadeNovadeLisboa,EscolaNacionaldeSaúdePública,CentrodeInvestigac¸ãoemSaúdePública,Lisbon,Portugal cUniversidadedeLisboa,FaculdadedeMedicina,InstitutodeSaúdeAmbiental,Lisbon,Portugal
dInstitutoPolitécnicodeBeja,EscolaSuperiordeEducac¸ão,Beja,Portugal eUniversidadedeLisboa,FaculdadedeMotricidadeHumana,Lisbon,Portugal fUniversitatdeGirona,Girona,Spain
gUniversidadedeLisboa,FaculdadedeArquitetura,CentrodeInvestigac¸ãoemArquitetura,UrbanismoeDesign(CIAUD),Lisbon, Portugal
Received5July2018;accepted4September2018 Availableonline28October2018
KEYWORDS Health; Healthbehaviorin school-agedchildren; Physicalactivity; Sedentarybehavior; Alcoholdrink; Tobacco Abstract
Objective: Usingawideandrepresentativesampleofadolescentsfrom37countries,thisstudy aimedtoanalyzehowagechangesadolescents’healthylifestyle.
Methods: Thestudyincluded148,839adolescentswhoparticipatedintheHealthBehaviorin School-agedChildren2010survey.Acompositescoreofahealthylifestylewascreatedusing thecombination ofdailyphysicalactivity,daily fruitandvegetableconsumption,<2hdaily onscreen-basedbehaviors,abstinencefromalcohol,andabstinencefromtobaccoproducts. Healthylifestylemeasureswerebasedonself-report.
Results: 4.7%ofboysand4.4%ofgirlsaged11years,3%ofboysand2%ofgirlsaged13years, and1.5%ofboysand0.8%ofgirlsaged15scoredperfectlyonthehealthylifestylescore.As ageincreased,theprevalenceofadolescentswithahealthylifestyledecreased.In37countries andregions,theprevalenceofhealthybehaviorsdecreasedlinearlybetweenearlyadolescence andtheageof15years.
Conclusions: In general,adolescentsdonothaveahealthylifestyle.Resultsfromthisstudy highlightthatthereisstillmuchworktobedoneinpromotinghealthylifestylesandtoraise awarenessamongadolescentsofthepotentialrisktotheirhealthstatus.
©2018SociedadeBrasileiradePediatria.PublishedbyElsevierEditoraLtda.Thisisanopen accessarticleundertheCCBY-NC-NDlicense(http://creativecommons.org/licenses/by-nc-nd/ 4.0/).
夽 Pleasecitethisarticleas:MarquesA,LoureiroN,Avelar-RosaB,NaiaA,MatosMG.Adolescents’healthylifestyle.JPediatr(RioJ). 2020;96:217---24.
∗Correspondingauthor.
E-mail:[email protected](A.Marques).
https://doi.org/10.1016/j.jped.2018.09.002
0021-7557/©2018SociedadeBrasileiradePediatria.PublishedbyElsevierEditoraLtda.ThisisanopenaccessarticleundertheCCBY-NC-ND license(http://creativecommons.org/licenses/by-nc-nd/4.0/).
218 MarquesAetal. PALAVRAS-CHAVE Saúde; Comportamento relacionadoàsaúde emescolares; Atividadefísica; Comportamento sedentário; Bebidaalcoólica; Tabaco
Estilodevidasaudáveldosadolescentes
Resumo
Objetivo: Comousodeumaamostraamplaerepresentativadeadolescentesde37 países, analisarcomoaidademudaoestilodevidasaudáveldosadolescentes.
Métodos: Participaram 148.839 adolescentes provenientes da pesquisa Health Behavior in School-aged Children, de 2010. Foi elaborado um escore composto de um estilo de vida saudável,comacombinac¸ãodeatividadefísicadiária,consumo diáriodefrutas evegetais, menosdeduashorasdiáriasdecomportamentosedentáriobaseadoemtempodetela, abstinên-ciadeálcooleabstinênciadeprodutosdetabaco.Asmedidasdoestilodevidasaudávelforam baseadasemautorrelato.
Resultados: Obtiveramumescoreperfeitonoestilodevidasaudável4,7%dosmeninose4,4% dasmeninasde11anos,3%dosmeninose2%dasmeninasde13anose1,5%dosmeninose0,8% dasmeninasde15anos.Comoaumentodaidade,aprevalênciadeadolescentescomestilo devidasaudáveldiminuiu.Em37paíseseregiões,aprevalênciadecomportamentossaudáveis diminuiulinearmenteentreoiníciodaadolescênciaeos15anos.
Conclusões: Emgeral,osadolescentesnãotêmumestilodevidasaudável.Osresultadosdeste estudo destacam que ainda há muito trabalho a ser feito na promoc¸ão de estilos de vida saudáveisenaconscientizac¸ãodosadolescentessobreosriscospotenciaisparaoseuestado desaúde.
©2018SociedadeBrasileiradePediatria.PublicadoporElsevierEditoraLtda.Este ´eumartigo OpenAccesssobumalicenc¸aCCBY-NC-ND(http://creativecommons.org/licenses/by-nc-nd/4. 0/).
Introduction
Adolescencemightbecriticalforlaterhealthanddisease,1 becausethereissomeevidencestatingthathabitsacquired inthisperiodmaytrackintoadulthood.Forinstance,alcohol habitsduringadolescenceincrease thelikelihoodofheavy consumptioninadulthood,2aswellasfoodconsumptionin adolescenceisapredictorofintakeinadulthood.3Forthis reason,severalchronicdiseasesmayhavetheirorigin,and diseaseprogression,duringadolescence.1
To improveadolescents’health, itis importantto pro-motehealthy behaviorsat an earlyage, especiallyduring adolescence.Healthybehaviorsareadeterminantofhealth; positivechangescanhave animpactontheoverallhealth outcomes.4 The main behaviors associated with adoles-cents’healtharephysicalactivity,lesstimeengagingwith multi-media, healthy diet, and absence of alcohol and tobaccoconsumption,4---6aswellascaffeine/stimulantuse, sleepdeprivation,druguse,condomlesssex,andunhealthy relationships.7 Duringthe transition into adolescenceand throughoutit,thereisanincreaseindesiringnovelty,along withthecourageandcuriositytoexperimentwithnewand oftenunhealthybehaviors.8
Sinceadolescenceisacriticaltimetoestablishthe foun-dationsofaperson’shealth,1,2itisimportanttounderstand thebehavioralpracticeduringthetransitionfromearlyto late adolescence. Studies on adolescents’ healthy habits havefocusedontherelationshipbetweenindividual behav-iorsandtheiroutcomeonhealth.9,10 Attemptstocombine severalhealth behaviorstocreatea solutiontoexpressa healthylifestylearesparse.11Suchmeasurecouldbe impor-tanttothe publichealth policyby influencingthe wayin which programs set up to promote healthy lifestyles are developed.Thus,thereisaneedtounderstandhowhealthy behaviors,andahealthylifestyle,changeduringthisstage
oflife.Therefore,usingawideandrepresentativesampleof adolescentsfrom37countriesandregions,thisstudyaimed toexaminetheassociationbetweenageandchangesin self-reportedprevalenceofhealthybehaviorsinadolescents.
Methods
Proceduresandparticipants
Datawasextractedfromtheinternationalsurveydatabase HealthBehaviorinSchool-agedChildren(HBSC)2010, avail-ableathttp://www.uib.no/en/hbscdata.TheHBSCsurvey is conducted every four years in several European and Northern American countries, in representative school-basedsamples.12Itexamineshealthbehaviorsandlifestyles among adolescents from grades 6, 8, and 10, aged 11, 13, and 15 years, respectively. In each country, adoles-centsarerecruitedfromschoolsrandomlyselectedfroma liststratifiedby regions.The proceduresofthe HBSC sur-veyaredevelopedthroughan internationallystandardized researchprotocol,inordertoallowcross-cultural compar-isons.Themethodsandinstrumentdescriptioncanbefound elsewhere.12 The survey was conducted and approved in accordance withthe ethicalguidelines fromethical com-mittees fromeach country. Forinstance, in Portugal, the researchwasconductedinaccordancewithboththeEthical Committeeofthe OportoMedicalSchoolandtheNational DataProtectionSystem.Awritteninformedconsentto par-ticipatewasrequiredfromparentsorlegalguardians,and adolescentsprovidedtheirassent.Participationwas anony-mousandtherewerenoincentivesforparticipation.
ThenumberofadolescentsparticipatingintheHBSC2010 survey was213,594 (105,099 boys and 108,496 girls). For thepresentstudy,theselectedadolescentswerethosewho
reported physical activity levels, screen-based sedentary behaviors,eatingfruitsandvegetables,involvementin alco-holconsumption andtobaccouse,andbeingaged11, 13, and15yearsold(i.e.,theage-gradeequivalentforgrades 6,8,and10).Thefinal samplecomprised148,839 adoles-cents(71,415boysand77,424girls).Thefinalsampledidnot differinsexdistribution,age,andhealthbehaviorsfromall adolescentsparticipatingintheHBSC2010,andfromthose whowerenotincludedintheanalysis.
Measures
Socio-demographiccharacteristics
Adolescents reportedtheir age,gender,numberof people in their household, and number of siblings. Furthermore, thefamilyaffluencescalewasusedtoassesssocioeconomic status.Adolescentswereaskedaboutfamilycarownership, whethertheyhadabedroomforthemselves,whetherthey traveledonholidays,andthenumberofcomputersathome. Subsequently, acomposite score wascalculatedbased on responsestothesefouritems,andathree-pointscalewas obtained:low(0---2),middle(3---5),andhigh(6---9).
Healthylifestylebehaviorsandhealthylifestyle
compositescore
Adolescentswereaskedtoreportthenumberofdaysthey werephysicallyactiveforatotalofatleast60minperdayin thelastsevendays.Priortoanswer,adolescentswere pro-videdwithadefinitionof physicalactivity,13 accompanied byexamplesofsomeagerelevantactivities.Answerswere givenonan8-point scale(0=noneto7=daily).Responses weredichotomizedinto≤sixtimesorseventimesperweek, accordingtothephysicalactivityguidelines.13 Adolescents wereaskedtoindicatethecustomarytime(hoursperday) that they spend watching television, playing videogames, and using the computer. Screen-based behavior was cal-culated by the sumof these behaviors. The screen-based behaviorstimewasdichotomizedinto≥2hand<2hdaily.14 Adolescents wereaskedtoreportthefrequency thatthey consumedfruitsandvegetables.Theoptionswere‘‘never,’’ ‘‘lessthanonceaweek,’’‘‘onceaweek,’’‘‘two-fourdaysa week,’’‘‘five-sixdaysaweek,’’‘‘onceaday,’’and‘‘several timeseveryday.’’Theitemsweredichotomizedinto‘‘less thandaily’’and‘‘daily,’’becausethedailyconsumptionof fruitsandvegetablesdailyis animportant healthy behav-iorinschool-agedchildren.15,16Adolescentswereaskedhow oftentheyconsumealcohol (e.g.,beer,wine, liquor).For eachoption,theanswerchoiceswere:‘‘never,’’‘‘rarely,’’ ‘‘every month,’’ ‘‘every week,’’ and ‘‘every day.’’ Alco-hol ingestion is damaging for the adolescents’ health,17 andtheguidelinesregardingalcoholconsumptionfor ado-lescents recommends abstinence.18 Thus, responses were dichotomized into drinking (regardless of the frequency) andnever drinking.Tobaccouse wasmeasured byasking, ‘‘Howoftendoyou smoketobaccoatpresent?’’ Response optionswere‘‘everyday,’’‘‘atleastonceaweek,butnot everyday,’’ ‘‘lessthan onceaweek,’’or ‘‘never’’.Since thereisnothresholdofsafetyforsmoking,responseswere recodedintocurrentsmoker(regularlyorsometimes),and non-smoker.
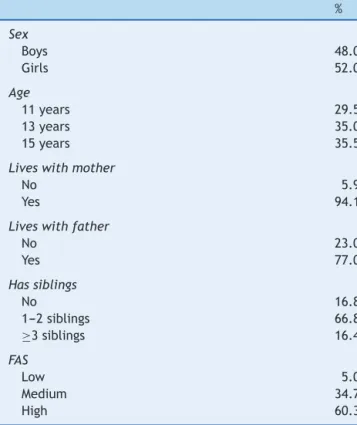
Table1 Participants’characteristics(n=148,839). % Sex Boys 48.0 Girls 52.0 Age 11years 29.5 13years 35.0 15years 35.5
Liveswithmother
No 5.9
Yes 94.1
Liveswithfather
No 23.0 Yes 77.0 Hassiblings No 16.8 1---2siblings 66.8 ≥3siblings 16.4 FAS Low 5.0 Medium 34.7 High 60.3
FAS,familyaffluencescale.
Moststudies of adolescent health have focused onthe relationshipbetweenaspecifichealthoutcomeandagiven behavior.9,10However,studiesthatcombinedseveralhealth behaviorsinanattempttocreateameasurethatexpresses ahealthy lifestyle aresparse.11 Sucha measure couldbe important to public health policy, influencing the way in which programs to promote healthy lifestyles are devel-oped.Accordingly,bycombiningallthesehealthybehaviors, ahealthylifestylecompositescorewascreated.Onepoint wasassignedforeachofthefollowinghealthylifestyle cat-egories:(a)dailyphysicalactivity,(b)dailyconsumptionof fruitsandvegetables,(c)spending<2dailyhoursin screen-basedsedentarybehaviors,(d)neverdrinking,and(e)never smoking.Thehealthylifestylescorerangedfrom0to5,with atotalscoreof5healthybehaviorsrepresentingahealthy lifestyle.
Dataanalysis
Fortheentiresample,descriptivestatisticswerecalculated (means, standard deviation, and percentages). Estimates and95%confidenceintervalswerereportedfor the preva-lence of healthy lifestyle behaviors, and for the number of behaviors criteria met. Moreover, the mean number of behaviors reported was also calculated. This informa-tion was stratified by age (11, 13, and 15 years). The chi-squaredtestfortrendsandANCOVAwereusedtoanalyze therelationshipbetweenadolescents’age,healthylifestyle behaviors,andnumberofbehaviorsreported.Analyseswere stratifiedbygender.Statisticalanalysiswasperformedusing SPSS24.Thesignificancelevelwassetatp<0.05.
220 MarquesAetal.
Results
The characteristics of the sample data are presented in
Table 1. Most of the adolescents lived withtheir mother (94.1%),77%livedwiththeirfatherathome,andmorethan 80%hadsiblings.Only5%wereclassifiedashavingalower socioeconomicstatus,while the remainingwereclassified asmedium(34.7%)orhigh(60.3%)socioeconomicstatus.
Table 2 presents the prevalence of healthy lifestyle behaviors. Among boys, screen time less than 2h/day (12.8%, 95% CI: 11.7, 14.0), eating fruit and vegetables everyday(16.2%,95%CI:15.1,17.3),andpracticeof phys-icalactivityeveryday(18.9%,95%CI:17.8,20.0)werethe least prevalenthealthy behaviorsat the age of 15 years. Inturn,theprevalenceofboyswhodidnotconsume alco-hol(89.1.5%;95%CI:88.6,89.6)anddidnotsmoke(97.3%; 95%CI: 97.1,97.5) washigherat age 11. The prevalence of all healthy behaviors significantly decreased withage, andthedecreasing trend wasmorepronouncedregarding alcohol consumption (−43.5%;95% CI: −44.1,−42.8)and smoking (−21.6%; 95% CI: −22.1, −21.0) than regarding physicalactivity,screentimelessthan2h/day,andeating fruitsorvegetableseveryday.Only4.7%(95%CI:3.4,6.0) ofboys aged11years hada healthylifestyle.The figures areevensmaller at 13 years(3.0%; 95% CI:1.8, 4.2)and 15years(1.5%;95%CI:0.3,2.7).Thisdecreasepresenteda significanttrend(−3.3%;95%CI:−3.6,−2.9).
Amonggirls,practiceofphysicalactivityeverydaywas the least prevalent healthy behavior (9.4%, 95% CI: 8.3, 10.6), followed by screen time less than 2h/day (18.7%, 95%CI:17.6,19.8),andeatingfruitandvegetablesevery day(22.6%,95%CI:21.5,23.6)attheageof15.Morethan 90%of11yearsgirlsdidnotconsumealcohol(93.0%;95%CI: 92.6.93.3)anddidnotsmoke(98.8%;95%CI:98.7,99.0)at theageof11years.However,thisprevalencedecreasesby morethan43%for noalcoholconsumption andmorethan 20%for notsmoking. Only 4.4% (95%CI: 3.2, 5.7)of girls aged11yearshadahealthylifestyle.Thefiguresdecrease to2%(95%CI:0.8,3.2)at13years,andtolessthan1%at15 years.This decreasepresented asignificanttrend(−1.5%; 95%CI:−1.7,−1.3).
Themeanofhealthybehaviorsbycountry,stratifiedby age,ispresentedinTable3.Themeanofhealthybehaviors decreasedsignificantlyinall countriesfromage11toage 15.
Discussion
Thisstudy aimedtoexaminetheassociation betweenage andchangesinself-reportedprevalence ofhealthy behav-iors in adolescents. As age increased, the prevalence of adolescentswitha healthy lifestyledecreased. Only 4.7% ofboys and4.4% ofgirls aged11 years,3.0%of boysand 2.0%of girls aged13years,and 1.5%of boysand0.8% of girlsaged15scoredperfectlyonthehealthylifestylescore. Sinceahealthylifestylehasapositiveimpactonhealthand isessentialtopreventearlyonsetofchronicdiseases,4these resultsshowthatmostadolescentsareatrisk.Thechoices inregardstohealthduringadolescencemayjeopardizetheir futurehealth.
Concerningphysicalactivity,astrongdecreaseinits prac-ticewasobservedfrom11to15yearsofage.Allcountries and regions were similarin showing a decrease of physi-calactivity by age. The physical activity decreaseby age was also documented in previous studies using objective measuresofphysical activity.19,20 Asadolescentsage,they gainmoreindependenceandareexposedtoother environ-mentsandinfluences(e.g.,schoolandpeers).Furthermore, thecostofactivitiesalsoinfluencesthedecreaseof phys-ical activity with age. Physical activity during childhood is mostlyinformal.However,adolescentstend topractice formal physical activity, which has associated economic costs (e.g., membership, purchase of equipment). Thus, amongsocioeconomicallydisadvantagedadolescents,there arelessopportunities;naturally,thenumberofparticipants decreaseswithage.
In line with previous studies,21,22 screen time behav-ior increasesthroughout adolescence. This trendtendsto increasegiventhatnewmediascreentimehassignificantly increasedinrecentyears,especiallyaftersmartphonesand similarportabledevicessuchastabletsgainedover50% mar-ket saturation amongadolescents.23 This findingprobably reflects tworealities for adolescents:increased academic demands and a higher need for social interaction. Nowa-days,manyscreenelectroniccomponentsmightbeusedas tools to help students with homework and diverse school content.22
The decrease in the consumption of fruits and veg-etables in adolescence has been observed,24 and age is considered a determinant factor in this intake.25 The decreasing trend of fruit and vegetable consumption begins inchildhoodandcontinuesintoyoungadulthood.26 From early to mid-adolescence, this decreasing trajec-tory stands out from multiple changes in lifestyle, and both physical and environmental aspects that take place in adolescence, such as peer influence or availability in schools.25 Thegreaterfreedominfoodchoiceexperienced by adolescentsandthelevel ofsupportfor fruitand veg-etable consumption during this phase might explain the decrease in fruit and vegetable consumption throughout adolescence.24
Concerning alcohol and tobacco use, these behaviors tend to be clustered; trajectories of the consumption of these substances are linked.27 As age increases, the con-sumption of alcohol and use of tobacco also increases. Among the healthy behaviors, these presented a bigger decrease with age. The same trend had been previously observed,27 meaningthatthetransitionfromearly adoles-cence to mid-adolescence is a critical period for alcohol consumptionandtobaccouse.
Thegeneraldecreaseintheprevalenceofhealthy behav-iorswithage shows thatadolescentshave a lifestylethat harms their health and jeopardizes it in the future. This was clearly demonstrated in the present study, in which less than 2% at the age of 15 had a healthy lifestyle. As demonstrated, adolescents become more independent with age; they start to have different interests, suffer markedinfluencefrompeers,andspendmoretimeatschool withoutparentsupervision.Thus,interventionsareneeded to reverse the increase in the prevalence of unhealthy lifestyles. Schools are a gateway to provide adolescents with skills to manage and improve their lifestyle.28
Vir-Adolescents’ lifestyle 221 11years(n=21,138) %(95%CI) 13years(n=24,816) %(95%CI) 15years(n=25,461) %(95%CI)
pb Differencebetween15and11
years(95%CI) Boys
Healthylifestylebehavior
Physicalactivityeveryday 26.6(25.4,27.7) 23.9(22.8,25.0) 18.9(17.8,20.0) <0.001 −7.7 (−8.4,−6.9) Screentime<2h/day 24.7(23.5,25.9) 16.1(15.0,17.2) 12.8(11.7,14.0) <0.001 −11.9 (−12.6,−11.2) Eatsfruits/vegetabledaily 22.5(21.3,23.7) 19.1(18.0,20.2) 16.2(15.1,17.3) <0.001 −6.3 (−7.0,−5.6) Doesnotconsumealcohol 89.1(88.6,89.5) 76.9(76.3,77.5) 55.3(54.4,56.1) <0.001 −33.8 (−34.6,−33.1)
Doesnotsmoke 97.3(97.1,97.5) 91.8(91.4,92.2) 76.7(76.1,77.3) <0.001 −20.6 (−21.2,−20.1)
Numberofbehaviorsreported
None 0.4(−1.0,1.7) 1.7(0.5,3.0) 6.4(5.2,7.6) <0.001 6.0(5.7,6.3) 1behavior 3.9(2.6,5.2) 8.9(7.7,10.1) 19.6(18.5,20.7) <0.001 15.7(15.2,16.3) 2behaviors 27.9(26.7,29.0) 30.9(29.9,32.0) 33.4(32.4,34.4) <0.001 5.6(4.7,6.4) 3behaviors 42.9(41.9,43.9) 39.9(38.9,40.9) 29.6(28.5,30.6) <0.001 −13.3 (−14.2,−12.5) 4behaviors 20.2(19.0,21.4) 15.6(14.4,16.7) 9.5(8.3,10.7) <0.001 −10.7 (−11.3,−10.0) 5behaviorsa 4.7(3.4,6.0) 3.0(1.8,4.2) 1.5(0.3,2.7) <0.001 −3.3 (−3.6,−2.9)
Mean(95%CI) Mean(95%CI) Mean(95%CI) pc Mean(95%CI)
Allbehaviors
Meanofbehaviorreported 2.6(2.6,2.6) 2.3(2.3,2.3) 1.8(1.8,1.8) <0.001 −0.8 (−0.8,−0.8)
11years(n=22,788) %(95%CI) 13years(n=27,207) %(95%CI) 15years(n=27,429) %(95%CI) pb Differencebetween 15and11years(95% CI) Girls
Healthylifestylebehavior
Physicalactivityeveryday 18.2(17.0,19.4) 12.9(11.8,14.0) 9.4(8.3,10.6) <0.001 −8.8(−9.4,−8.2)
Screentime<2h/day 33.3(32.3,34.4) 20.6(19.5,21.6) 18.7(17.6,19.8) <0.001 −14.6(−15.4,−13.9)
Eatsfruits/vegetabledaily 29.3(28.2,30.4) 23.8(22.8,24.9) 22.6(21.5,23.6) <0.001 −6.7(−7.5,−5.9)
Doesnotconsumealcohol 93.0(92.6,93.3) 76.8(76.2,77.4) 49.5(48.7,50.3) <0.001 −43.5(−44.1,−42.8)
Doesnotsmoke 98.8(98.7,99.0) 92.1(91.8,92.4) 77.3(76.7,77.8) <0.001 −21.6(−22.1,−21.0)
Numberofbehaviorsreported
None 0.2(−1.1,1.5) 2.4(1.2,3.6) 8.7(7.6,9.9) <0.001 8.6(8.2,8.9) 1behavior 2.8(1.5,4.0) 10.3(9.2,11.5) 23.1(22.1,24.1) <0.001 20.4(19.8,20.9) 2behaviors 29.0(27.9,30.1) 34.6(33.6,35.5) 34.0(33.0,35.0) <0.001 5.0(4.2,5.8) 3behaviors 44.1(43.1,45.1) 37.5(36.5,38.4) 26.1(25.0,27.1) <0.001 −18.0(−18.9,−17.2) 4behaviors 19.6(18.4,20.8) 13.2(12.1,14.4) 7.2(6.1,8.4) <0.001 −12.4(−13.0,−11.8) 5behaviors 4.4(3.2,5.7) 2.0(0.8,3.2) 0.8(−0.3,2.0) <0.001 −1.5(−1.7,−1.3)
Mean(95%CI) Mean(95%CI) Mean(95%CI) pc Mean(95%CI)
Allbehaviors
Meanofbehaviorreported 2.7(2.7,2.7) 2.3(2.3,2.3) 1.8(1.8,1.8) <0.001 −0.9(−0.9,−0.9)
CI,confidenceinterval.
a Adolescentswithahealthylifestyle. b Testedbychi-squaredtestfortrend.
222 MarquesAetal.
Table3 MeanofhealthybehaviorsineachHBSCcountries.
Countries Total Boys
Mean(95%CI)
Girls
Mean(95%CI)
11years 13years 15years 11years 13years 15years Ireland 3,222 3.0(2.9,3.1) 2.6(2.6,2.7) 2.2(2.2,2.3) 3.0(2.9,3.1) 2.6(2.5,2.7) 2.0(1.9,2.1) Macedonia 3,073 2.9(2.8,2.9) 2.5(2.5,2.6) 2.2(2.1,2.2) 3.0(2.9,3.1) 2.5(2.5,2.6) 2.3(2.3,2.4) Switzerland 5,435 3.0(3.0,3.1) 2.6(2.5,2.6) 1.9(1.8,2.0) 3.2(3.1,3.2) 2.7(2.6,2.7) 2.1(2.0,2.2) UnitedStates 4,951 2.8(2.8,2.9) 2.6(2.6,2.7) 2.3(2.2,2.4) 2.9(2.9,3.0) 2.5(2.5,2.6) 2.2(2.1,2.2) Luxembourg 3,029 3.0(2.9,3.1) 2.6(2.5,2.7) 2.0(1.9,2.1) 2.9(2.8,3.0) 2.6(2.5,2.6) 2.1(2.0,2.2) Belgiuma 3,266 2.9(2.8,3.0) 2.4(2.3,2.5) 2.0(1.9,2.1) 2.8(2.8,2.9) 2.4(2.4,2.5) 1.9(1.8,2.0) Israel 3,026 2.7(2.6,2.7) 2.4(2.3,2.5) 2.0(1.9,2.1) 2.7(2.6,2.7) 2.5(2.4,2.5) 2.3(2.2,2.3) Iceland 9,301 2.7(2.6,2.7) 2.3(2.3,2.4) 2.0(1.9,2.0) 2.9(2.8,2.9) 2.5(2.5,2.5) 2.0(2.0,2.1) Canada 11,672 2.6(2.6,2.7) 2.4(2.4,2.4) 2.0(2.0,2.1) 2.8(2.8,2.9) 2.3(2.2,2.3) 1.9(1.9,1.9) France 4,771 2.7(2.6,2.8) 2.3(2.3,2.4) 1.9(1.8,1.9) 2.8(2.7,2.8) 2.4(2.3,2.4) 2.0(1.9,2.0) Austria 3,778 2.9(2.8,3.0) 2.5(2.4,2.5) 1.6(1.5,1.6) 3.1(3.0,3.1) 2.4(2.3,2.5) 1.5(1.4,1.6) Spain 3,919 2.8(2.7,2.9) 2.3(2.2,2.3) 1.9(1.8,1.9) 2.8(2.7,2.9) 2.3(2.2,2.3) 1.7(1.6,1.8) Germany 3,871 2.8(2.7,2.8) 2.3(2.2,2.3) 1.6(1.5,1.7) 2.9(2.8,3.0) 2.4(2.3,2.5) 1.7(1.6,1.8) Romania 3,678 2.6(2.5,2.7) 2.2(2.1,2.3) 1.7(1.7,1.8) 2.7(2.6,2.8) 2.3(2.3,2.4) 2.0(1.9,2.0) Slovakia 3,813 2.5(2.5,2.6) 2.3(2.2,2.3) 1.9(1.8,1.9) 2.6(2.6,2.7) 2.2(2.1,2.3) 1.9(1.8,1.9) Belgiumb 3,257 2.6(2.6,2.7) 2.3(2.2,2.4) 1.6(1.6,1.7) 2.7(2.6,2.8) 2.4(2.3,2.5) 1.7(1.6,1.8) Portugal 3,349 2.6(2.5,2.6) 2.3(2.2,2.3) 1.7(1.7,1.8) 2.6(2.6,2.7) 2.2(2.1,2.2) 1.9(1.8,2.0) England 2,243 2.6(2.5,2.7) 2.3(2.2,2.4) 1.9(1.8,2.0) 2.7(2.6,2.8) 2.2(2.1,2.2) 1.7(1.6,1.8) Poland 3,229 2.5(2.4,2.6) 2.1(2.1,2.2) 1.9(1.8,2.0) 2.6(2.6,2.7) 2.2(2.2,2.3) 1.8(1.8,1.9) Ukraine 3,858 2.5(2.5,2.6) 2.2(2.1,2.3) 1.8(1.7,1.9) 2.7(2.6,2.8) 2.2(2.1,2.3) 1.7(1.7,1.8) Slovenia 4,337 2.6(2.5,2.6) 2.1(2.1,2.2) 1.6(1.5,1.7) 2.7(2.6,2.8) 2.3(2.2,2.3) 1.8(1.7,1.9) Sweden 5,423 2.5(2.4,2.5) 2.2(2.1,2.2) 1.8(1.7,1.8) 2.7(2.6,2.7) 2.1(2.1,2.2) 1.7(1.6,1.8) Hungary 4,151 2.6(2.5,2.7) 2.1(2.0,2.2) 1.6(1.6,1.7) 2.8(2.7,2.8) 2.2(2.1,2.3) 1.6(1.5,1.7) Russia 4,371 2.3(2.3,2.4) 2.2(2.1,2.3) 1.9(1.8,2.0) 2.4(2.3,2.4) 2.1(2.1,2.2) 1.9(1.8,1.9) CzechRepublic 3,815 2.5(2.4,2.6) 2.2(2.1,2.2) 1.7(1.6,1.7) 2.8(2.7,2.8) 2.0(2.0,2.1) 1.6(1.5,1.7) Netherlands 3,675 2.5(2.4,2.6) 2.2(2.1,2.3) 1.6(1.5,1.7) 2.7(2.6,2.7) 2.2(2.1,2.2) 1.5(1.4,1.6) Denmark 2,876 2.5(2.5,2.6) 2.1(2.0,2.2) 1.5(1.4,1.6) 2.7(2.7,2.8) 2.2(2.1,2.2) 1.5(1.4,1.6) Greece 3,610 2.5(2.4,2.5) 2.1(2.0,2.2) 1.6(1.6,1.7) 2.6(2.5,2.6) 2.1(2.0,2.1) 1.6(1.5,1.7) Scotland 5,480 2.5(2.4,2.5) 2.1(2.0,2.1) 1.7(1.7,1.8) 2.6(2.6,2.7) 2.0(1.9,2.0) 1.6(1.5,1.6) Greenland 575 2.6(2.4,2.8) 2.1(1.9,2.3) 1.4(1.2,1.7) 2.6(2.5,2.8) 2.0(1.8,2.2) 1.3(1.0,1.5) Italy 4,058 2.3(2.2,2.3) 2.0(1.9,2.0) 1.5(1.5,1.6) 2.6(2.5,2.6) 2.0(2.0,2.1) 1.6(1.5,1.6) Croatia 5,510 2.4(2.3,2.4) 2.1(2.0,2.1) 1.5(1.4,1.5) 2.6(2.5,2.6) 2.0(2.0,2.1) 1.4(1.3,1.4) Wales 3,208 2.4(2.3,2.5) 2.0(2.0,2.1) 1.7(1.6,1.8) 2.5(2.4,2.5) 1.8(1.7,1.9) 1.5(1.4,1.6) Estonia 2,805 2.3(2.2,2.4) 1.9(1.8,2.0) 1.4(1.3,1.5) 2.4(2.3,2.5) 1.7(1.6,1.8) 1.3(1.3,1.4) Latvia 3,318 2.3(2.2,2.3) 1.8(1.7,1.9) 1.3(1.3,1.4) 2.3(2.3,2.4) 1.8(1.7,1.9) 1.2(1.1,1.3) Finlandc 3,103 2.4(2.3,2.5) 1.8(1.7,1.8) 2.3(2.2,2.3) 1.8(1.7,1.9) Norwayc 1,783 2.3(2.2,2.4) 1.7(1.6,1.8) 2.3(2.2,2.4) 1.7(1.6,1.8)
CI,confidenceinterval. aFrench.
b Flemish.
c Therewerenodataforadolescentsaged11years.Thecomparisonwasmadebetweenthoseaged15and13years.
DifferencesamongagesweretestedbyANCOVA.Analyseswereadjustedforlivingwithmother,livingwithfather,havingbrothersor sistersandfamilyaffluencescale.
Inallcountries,significantdifferencesofmeanofbehaviorreportedamongageswereobserved(p<0.001). Countriesweresortedbythegeneralmeanofhealthybehaviorsreported.
tually all adolescents attend school, spending much time there;inschools,theyaresubjectedtothetransmissionof knowledgethatcanbeusedtoimprovetheirhealth.There is evidence that school-based single-component or multi-componentinterventionscanimproveshort-andlong-term adolescents’ healthy behaviors.24,25,28 Therefore, a large numberof adolescentscouldbenefitfromthese interven-tions.
Thisstudy hasstrengthsand limitationsthat shouldbe acknowledged. One strong point is that the findings are fromaninternationalstudycomprising42countrieswiththe samestandardizedinstruments,whichallowscomparisons. Anoteworthystrengthisthefactthatonly5%ofthe parti-cipantshavelowfamilyaffluencescale.Thisgiveshopeto generalizethefindings,becausethereisnotmuchvariation among the adolescents’ socioeconomic status. The HBSC
database contains numerous missing values. Over 40,000 adolescentsdidnotreportthehealthybehaviorsandwere excluded fromthe data analysis,because it wasnot pos-sible to create a healthy lifestyle composite score based onthefivehealthybehaviors.Datacollectionwasbasedon self-reportedinformation,whichissubjecttobias. Further-more,eatingfruitsor vegetablesdailydoesnot meanthe adolescentsnecessarilyconsumed therecommended serv-ings. It would be important to accurately measure fruit andvegetableconsumptiontodeterminewhetheritmeets theguidelines.15Lastly,thecross-sectionaldesignprecludes acausalinference for the relationshipbetween a healthy lifestyleandage.
Resultsfromthisstudyhighlightthefactthatthereisstill muchworktobedonetopromotehealthylifestylesandto raiseawarenessamongadolescentsofthepotential bene-fitstotheirhealthstatus.Giventhatitknownthathealth behaviorsaresetduringthisdevelopmentalperiod, under-standinghowbest topromote healthylifestyles is stillof crucialimportanceduringthislifephase.Itisalsoimportant tohighlight thatthelowerprevalenceof adolescentswith a healthy lifestyle appears to corroborate that unhealthy behaviorstendtocluster.29Schoolsalsocanimprove adoles-cents’lifestylethroughknowledge.Itisimportanttoteach adolescentsthephysicalguidelines,13 thehealthproblems associatedwithtimeinscreen-basedbehaviors,30 the rec-ommendationfor theamount oftimethatcanbedevoted tothesebehaviors,14thehabitsofhealthyeating,the rec-ommendeddaily consumption offruit andvegetables,15,16 andthebenefitsofabstinencefromalcoholconsumption18 and tobacco usage. Knowledge may not be sufficient to improvetheadolescents’lifestyles, buthavingknowledge putintopracticecouldbeastepclosertoraisingawareness oftheimportanceofhealthybehaviors,withtheintentthat theyoungergenerationmaymakeeducateddecisionsabout theirhealth.
Conflicts
of
interest
Theauthorsdeclarenoconflictsofinterest.
References
1.VinerRM,RossD,HardyR,KuhD,PowerC,JohnsonA,etal. Lifecourseepidemiology:recognisingtheimportanceof ado-lescence.JEpidemiolCommunityHealth.2015;69:719---20. 2.Wennberg P, Andersson T, Bohman M. Associations between
differentaspectsofalcoholhabitsinadolescence,early adult-hood,andearlymiddleage:aprospectivelongitudinalstudy ofarepresentativecohortofmenandwomen.PsycholAddict Behav.2000;14:303---7.
3.LakeAA,MathersJC, Rugg-GunnAJ,AdamsonAJ. Longitudi-nalchangeinfoodhabitsbetweenadolescence(11---12years) andadulthood(32---33years):theASH30Study.JPublicHealth. 2006;28:10---6.
4.RaynerM,WickramasingheK,WilliamsJ,McCollK,MendisS. Anintroductiontopreventionofnon-communicablediseases. Oxford:OxfordUniversityPress;2017.
5.BrownsonRC,RemingtonPL,WegnerMV.Chronicdisease epi-demiologyandcontrol.Washington,DC:AmericanPublicHealth Association;2010.
6.MarquesA,CalmeiroL,LoureiroN,FrasquilhoD,deMatosMG. Healthcomplaintsamongadolescents:associationswithmore
screen-based behaviors and lessphysical activity. JAdolesc. 2015;44:150---7.
7.WorldHealth Organization(WHO).Growingup unequal: gen-derandsocioeconomicdifferencesinyoungpeople’shealthand well-being.In:HealthBehaviorinSchool-agedChildren(HBSC) study:internationalreportfromthe2013/2014survey. Copen-hagen:WHO;2016.
8.Miles DR,vanden Bree MB,Gupman AE, Newlin DB, Glantz MD,Pickens RW.Atwinstudyonsensationseeking, risk tak-ingbehaviorandmarijuanause.DrugAlcoholDepend.2001;62: 57---68.
9.Faught EL, Gleddie D, Storey KE, Davison CM, Veugelers PJ. Healthy lifestyle behaviors are positively and indepen-dently associated with academic achievement: an analysis of self-reported data from a nationally representative sam-ple of Canadian early adolescents. PLOS ONE. 2017;12: e0181938.
10.MurosJJ,SalvadorPerezF,ZuritaOrtegaF,GamezSanchezVM, KnoxE.Theassociationbetweenhealthylifestylebehaviorsand health-relatedqualityoflifeamongadolescents.JPediatr(Rio J).2017;93:406---12.
11.Kelly SA, Melnyk BM, Jacobson DL, O’Haver JA. Corre-lates among healthy lifestyle cognitive beliefs, healthy lifestyle choices, social support, and healthy behaviors in adolescents: implications for behavioral change strate-gies and future research. J Pediatr Health Care. 2011;25: 216---23.
12.CurrieC,ZanottiC,MorganA,CurrieD,deLoozeM,Roberts C,etal.Socialdeterminantsofhealthandwell-beingamong youngpeople:HealthBehaviorinSchool-AgedChildren(HBSC) study:internationalreportfromthe2009/2010survey(Health PolicyforChildrenandAdolescents,no.6).Copenhagen:WHO RegionalOfficeforEurope;2012.
13.WorldHealthOrganization(WHO).Globalrecommendationson physicalactivityforhealth.Geneva:WHO;2010.
14.AmericanAcademyofPediatrics,CommitteeonPublic Educa-tion. AmericanAcademyofPediatrics:children,adolescents, andtelevision.Pediatrics.2001;107:423---6.
15.AgudoA.Measuringintakeoffruitandvegetables.Kobe,Japan: WorldHealthOrganization;2005.
16.World Health Organization (WHO). Global action plan for the prevention and control of noncommunicable diseases 2013---2020.Geneva:WHO;2013.
17.EwingSW,SakhardandeA,BlakemoreSJ.Theeffectofalcohol consumptionontheadolescentbrain:asystematicreviewof MRIandfMRIstudiesofalcohol-usingyouth.NeuroimageClin. 2014;5:420---37.
18.DonaldsonL.Guidanceontheconsumptionofalcoholby chil-drenandyoungpeople.UnitedKingdom:DepartmentofHealth; 2009.
19.Baptista F, Santos DA, Silva AM, Mota J, Santos R, Vale S, et al. Prevalence of the Portuguese population attaining sufficient physical activity. Med Sci Sports Exerc. 2012;44: 466---73.
20.Cooper AR, Goodman A, Page AS, Sherar LB, Esliger DW, van Sluijs EM, et al. Objectively measured physical activ-ityand sedentarytimein youth:theInternational Children’s Accelerometry Database (ICAD). Int J Behav Nutr Phys Act. 2015;12:113.
21.Sigmund E, Badura P, Sigmundová D, Voráˇcová J, Zacpal J, KalmanM,etal.Trendsandcorrelatesofoverweight/obesity inCzechadolescentsinrelationtofamilysocioeconomicstatus overa12-year studyperiod(2002---2014). BMCPublicHealth. 2018;18:122.
22.DumithSC,GarciaLM,daSilvaKS,MenezesAM,HallalPC. Pre-dictorsandhealthconsequencesofscreen-timechangeduring
224 MarquesAetal.
adolescence---1993Pelotas(Brazil)Birthcohortstudy.JAdolesc Health.2012;51:S16---21.
23.PiwekL,JoinsonA.Whatdotheysnapchatabout?’’Patterns ofuseintime-limitedinstantmessagingservice.ComputHum Behav.2016;54:358---67.
24.AlbaniV,ButlerLT,TraillWB,KennedyOB.Fruitandvegetable intake:changewithageacrosschildhoodandadolescence.Br JNutr.2017;117:759---65.
25.Krolner R, Rasmussen M, Brug J, Klepp KI, Wind M, Due P. Determinants of fruit and vegetable consumption among children and adolescents: a review of the literature. Part II: qualitative studies. Int J Behav Nutr Phys Act. 2011;8: 112.
26.Demory-LuceD,MoralesM,NicklasT,BaranowskiT,Zakeri I, BerensonG.Changesinfoodgroupconsumptionpatternsfrom childhoodtoyoungadulthood:theBogalusaHeartStudy.JAm DietAssoc.2004;104:1684---91.
27.NelsonSE,VanRyzinMJ,DishionTJ.Alcohol,marijuana,and tobaccousetrajectoriesfromage12to24years:demographic correlatesandyoungadultsubstanceuseproblems.Dev Psy-chopathol.2015;27:253---77.
28.Melnyk BM, Jacobson D, Kelly S, Belyea M, Shaibi G, Small L, et al. Promoting healthy lifestyles in high school adoles-cents:arandomizedcontrolledtrial.AmJPrevMed.2013;45: 407---15.
29.HaS,ChoiHR,LeeYH.Clusteringoffourmajorlifestylerisk factorsamongKoreanadultswithmetabolicsyndrome.PLOS ONE.2017;12:e0174567.
30.ChinapawMJ,Proper KI,BrugJ, vanMechelenW, Singh AS. Relationshipbetweenyoung peoples’sedentarybehaviorand biomedicalhealthindicators:asystematicreviewof prospec-tivestudies.ObesRev.2011;12:e621---32.