Tematic maps for irrigation of the watermelon crop in
Piaui state
José Roberto de Oliveira1
Francisco Edinaldo Pinto Mousinho2 Aderson Soares de Andrade Júnior3 Kleiton Rocha Saraiva4
Francisco das Chagas de Andrade Porto Nunes5
Abstract
In semi-arid regions, inadequate management of irrigation in watermelon crops greatly increases yield losses. As a result, we sought to reg ionalize irrigation slides necessary for watermelon cultivation in the State of Piauí, considering different sowing times and soils with different water retention capacities. Irrigation slides were determined by the crop water balance, considering a historical series of fifteen years, originating from daily pluviometric precipitation records in 165 sites of this region. The reference evapotranspiration (ET0) and the respective crude irrigation slides were estimated on a daily scale for each site. Then, the crude irrigation slides were spatialized to the entire target region through a routine performed in Excel and later using the SPRING software, depending on the available water capacity in the soil and the date of sowing. Seeding dates with the need for minor irrigation slides for watermelon cultivation in Piauí were January 1st, February 1st and March 1st and in relation to sowing dates, the largest irrigation slides were verified on August 1st, September 1st and October 1st. Regionalized irrigation sheets varied according to the available water capacity in the soil and date of planting.
Keywords: Citrullus lanatus. Water balance. Simulation. Planning.
Introduction
The production of watermelon Citrulus lanatus in Brazil is approximately 2.3 million tons of the fruit and an average yield of 22
ton ha
-1, prominently in the northeast region of the country, witha production of around 663.458 tons and an average yield of 18
ton ha
-1. The Brazilian State ofPiauí occupies the fifth place in terms of production in relation to the other states of the region, with 57.187 tons and average yield of around 24.5
ton ha
-1, especially, in the municipalities of Barras,Jatobá do Piauí, Parnaíba and Campo Maior, which together produced approximately 20 thousand tons of the fruit (IBGE, 2018).
Watermelon yield depends on several factors, especially cultivation, fertilization, climatic factors and the proper application of irrigation depths during the crop cycle (FILGUEIRA, 2008). According to
1 Instituto Federal do Piauí (IFPI). Campus Avançado José de Freitas, mestre em Agronomia. [email protected]. José de Freitas (PI), 64110-000.
2 Colégio Técnico de Teresina (CTT), professor doutor, Universidade Federal do Piauí. [email protected].
3 Empresa Brasileira de Pesquisa Agropecuária – Embrapa Meio Norte, doutor em Irrigação e Drenagem. [email protected]. 4 Instituto Federal do Piauí (IFPI), Campus Campo Maior. Doutor em Engenharia Agrícola. [email protected].
this author, water requirements differ along the watermelon crop cycle, being greater at the beginning of branching and intensifying from the fruiting stage until the beginning of fruit ripening.
According to Oliveira (2014), the use of irrigation blades is not yet a practice of the Piaui producers, what is done necessary to ensure the fulfillment of the water requirement of the watermelon at different stages of plant development. Saraiva et al. (2013) corroborated this fact in their study on irrigated watermelon crops in the State of Ceará, Brazil, and found that during the crop cycle the sprinklers at times spray excessive water while at other times the water supply is deficient.
The existing studies that determine spatialization of irrigation depths for watermelon crops in Piauí State, Brazil, are still not satisfactory, since the work developed so far has been carried out only in the municipalities of Teresina and Parnaíba (ANDRADE JÚNIOR, 2000). Studies like those are crucial if one considers the economic importance of the watermelon crop in this State.
According to Mousinho et al. (2003) and Azevedo et al. (2005), irrigation levels significantly influence watermelon crop yields. Ferreira (2012) reinforced that in a field study carried out in Teresina, Piauí State, where maximum yields were obtained by applying irrigation depths of 223.9 and 212.4 mm, respectively, for cultivars Crimson Sweet (34,642.97
kg ha
-1) and Shadow (25,453.55 kgha
-1).In a study carried out in the micro-region of Teresina and along the coast of Piauí State, Andrade Júnior (2000) estimated, by simulation, gross depths demanded for watermelon crops. In the municipality of Teresina, he found depths oscillating between 24.3 mm, in the month of March, and 357.9 mm in August; and, in the municipality of Parnaíba, the depth intervals oscillated between 82.6 mm, in March, and 464,8 mm in September.
It is worth stressing that there has been a lack of technical and scientific data on irrigation depth determination and management practices for watermelon crop to meet the demands of irrigated areas in different regions, and under various soil conditions in semiarid Brazilian regions. Hence, in this paper we regionalize the gross irrigation depths needed for watermelon crop in Piauí State, Brazil, by taking into account several sowing dates and soils with different available water capacities.
Material and methods
According to the Köppen classification, the State of Piauí, Brazil, has three climatic types: Aw, Aw’ and BSh. The Aw type occurs in the south-central and south-west Piauí, with hot and humid characteristics and summer rains, with the rainy season occurring from November to March, at which the months of December, January and February are the ones with the highest rainfall levels, and June, July and August are the driest months. In that region, the average annual rainfall ranges from 1,000 to 1,400 mm. The type ‘Aw’, hot and humid with summer and autumn rains, occurs in the north of the State, with the rainy season in the region occurring from January to May, and February, March and April are the months with the highest rainfall levels, and August, September and October are the driest ones. The average annual rainfall ranges from 1,000 to 1,800 mm.
The BSh type, semi-arid, occurs in the southeast of the State, characterized by a short rainy season in the summer between the months of December and April. In this region, the average annual rainfall varies from 400 to 800 mm, with January, February and March being the driest quarter, and July, August and September being the driest and hottest months of the year (MEDEIROS, 1996).
According to climatological data of the region, available by Atmospheric Sciences Center of Universidade Federal de Campina Grande, the average annual air humidity varies from 85.0%, in the north-central part of the Piaui State, to 55.0% in the most southeast region, a semi-arid one.
Sunshine duration exceeds 3,200 hours per year in some places, and the annual average temperature varies from 24.1 ºC to 27.8 ºC.
The Piauí State has a great variability of soil types, mainly Latosols, Neosols, Argisols, Nitosols and Luvisols (EMBRAPA, 2006). These types of soils show characteristics of medium to low natural fertility and great variability of water holding capacity, inherent to their different granulometric compositions. However, these soils have a great agricultural potential given its physico-chemical and topographic characteristics.
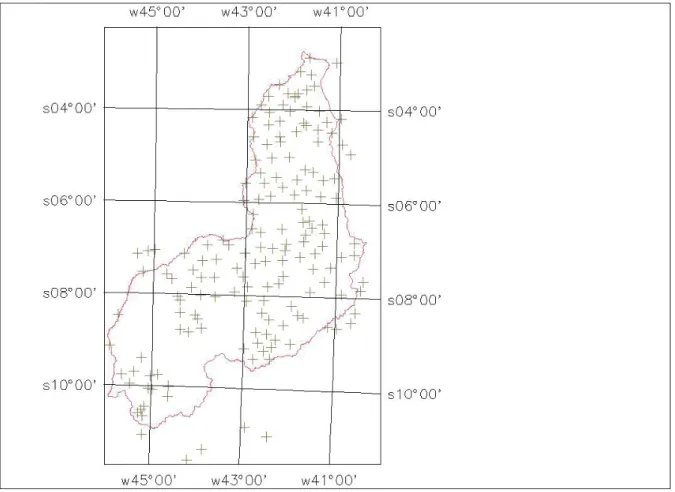
The data used in the present study came from daily rainfall records obtained from pluviometric stations of Sudene (Superintendency for the Development of the Northeast, Brazil) and INMET (Brazilian National Institute of Meteorology), installed in 165 sites. Of those, 145 are located in Piauí State, and the others are in the neighboring States (FIGURE 1).
Figure 1 – Geographic location of the pluviometric stations from where daily rainfall data were obtained, with emphasis on the limits of the Piauí State, Brazil.
Source: Elaborated by the authors (2014).
Reference evapotranspiration (ET0) was estimated on a daily basis for all sites, using the method of Thornthwaite (1948). Since no data on annual average air temperature were available for all sites, they were estimated using the equations proposed by Lima and Ribeiro (1998), who suggested estimating the monthly average air temperature for the Piauí State by basing the equations on the
latitude, longitude and altitude of the site. Using these equations, the average air temperatures by site were obtained for each month of the year, thus estimating the monthly values of ET0. The daily values for each site were obtained by dividing the monthly ET0 values by the number of days of the respective month. Because there were no significant alterations in the daily values of ET0 from one year to the next, and for the purposes of performing daily water balances, their values were considered equal for all years of the rainfall recorded history.
The reference evapotranspiration (ET0) and the respective gross irrigation depths were estimated on a daily scale for each location. Then, the raw irrigation depths were spatialized for the entire target region through a routine performed in Excel and later using the software SPRING 5.1.2 (SANTOS et al., 2010), according to the available water capacity in the soil and the date of sowing.
The water balances were performed based on the cycle equal to 65 days for all the sowing times considered. This period of 65 days goes from seedling emergence to fruit physiological maturity (ANDRADE JÚNIOR et al., 2007) for the edaphoclimatic conditions of the State, depending on the variety. However, considering that seedling emergence occurs 5 days after sowing, regardless of the time of the year, the complete cycle of watermelon was considered to be 70 days, from the sowing date until the physiological maturation of the fruits for all the sites of the State and the sowing times simulated (MOUSINHO et al., 2008). Twelve different sowing dates were used as the basis of calculation, with the first day of each month adopted as the standard date, and considering as cultivation areas only those under irrigation.
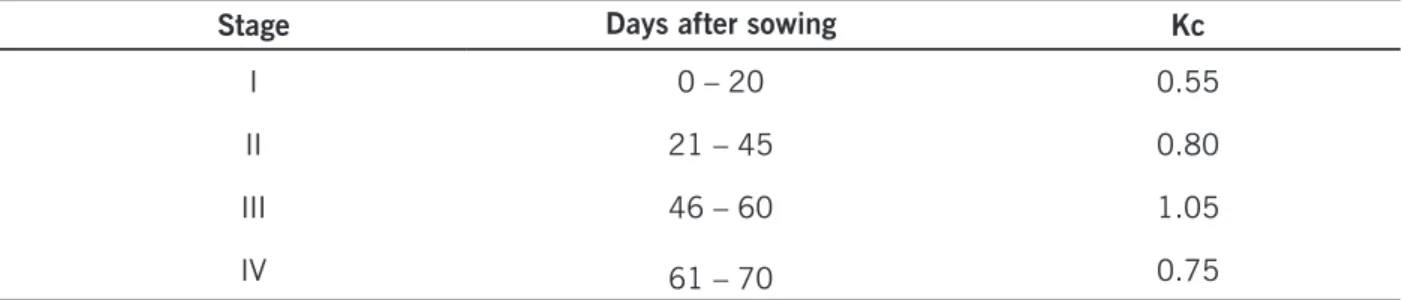
The crop coefficient (Kc) values in their different stages of development, used to estimate the maximum evapotranspiration (ETm), were based on research carried out under similar soil and climatic conditions (BEZERRA; OLIVEIRA, 1999), using as a basis the values recommended by Doorenbos and Pruitt (1997), Doorenbos and Kassam (2000) and Ferreira (2012). The developmental stages of the crop were defined according to recommendations by Doorenbos and Kassam (2000), and they were based on local research, as follows: I- establishment (from emergence until 10.0% of soil cover); II - vegetative development (from 10.0% of soil cover until the beginning of flowering); III - flowering and fruiting (from the beginning of flowering until the beginning of maturation); and IV - maturation (from the beginning of ripening to harvest). The Kc values for each developmental stage of the crop and the duration thereof are shown in Table 1.
Table 1 - Duration intervals of the developmental stages and crop coefficients (Kc) for each watermelon developmental stage.
Stage Days after sowing Kc
I 0 – 20 0.55
II 21 – 45 0.80
III 46 – 60 1.05
IV 61 – 70 0.75
Source: Elaborated by the authors (2014).
Water balances were performed for situations that were representative of the holding capacity of most soils in the region, given the great variability of soil types in the Piauí State, especially about the great difference in the water available capacity (AWC).
The AWC of the soil is defined as the maximum amount of water the soil can store along its profile, and the following expression was used as the basis of calculation:
"AWC"=(θFC – θPWP) Z (1)
at which:
AWC - available water capacity of the soil, L; θFC - soil moisture in field capacity, L3 L-3;
θPWP - soil moisture at the permanent wilting point, L3 L-3; Z - effective depth of the root system, L.
Even though there was AWC variation throughout the crop cycle due to the growth of the root system until reaching the effective depth, and to the physical characteristics of the soil in the different depths, in the present study, the AWC values were assumed constant throughout the crop cycle; that is, equal to 0.3 m (CARVALHO, 1999). Three AWC values were used for the water balances: 20, 40 and 60 mm (EMBRAPA, 2003). This values did represent, respectively, soils with lower, medium and high water holding capacity.
The crop water balances (CWB) were determined on a daily basis during the watermelon cycle taking into consideration irrigated crops, using the method proposed by Thornthwaite and Mather (1955) and described by Pereira et al. (2002). The CWB values were performed for each year of the rainfall recorded history and for each of the 165 sites under study, on each of the twelve sowing dates and for the three AWC values used. For this procedure, a computational routine was developed in the programming language Visual Basic 6.0 (macros) linked to the spreadsheet software Excel, added to the possibility of performing simulations using the Monte Carlo method.
As not all rainfall at a given site becomes available to the plants, for the purposes of determining the CWB values, effective daily rainfall was estimated through a fixed percentage of the total daily rainfall. The fixed percentage method is defined as the effective rainfall with a respective exceedance probability to the applied percentage, as described by Sampaio et al. (2000). In this way, the percentage of 75.0% was used according to recommendations by Doorenbos and Pruitt (1997), using AWC as the effective rainfall limit value, as proposed by Embrapa (2003):
ERi=TRi if TRi ≤ AWC (2)
ERi=0,75 TRi if TRi > AWC (3)
at which:
ERi - effective rainfall occurred on day i, L; TRi - total precipitation occurred on day i, L.
To determine the water balances, a variable irrigation was considered, using an irrigation depth to raise the water storage level in the soil according to the field capacity, always irrigating the plants before they reached the wilting point. As mentioned by Pereira et al. (2002), this point represents a
percentage of the AWC called “readily available water” (RAW), that is, the percentage of water that can be extracted from the soil, when at its maximum storage and without causing a water deficit to the crop, expressed as follows:
RAW = f AWC (4)
at which:
RAW - readily available water, L;
f - fraction of water depletion in the soil, dimensionless.
Thus, in determining the crop water balance, irrigation was performed when the RAW had been consumed. Fraction f varies with the type of crop and its water requirements at each developmental stage and, therefore, it is variable during the crop cycle. However, for practical purposes, fixed values were adopted. In the present study, the f value was set as 0.5, according to recommendations by Doorenbos e Kassam (2000).
As for the irrigated crops, and in order to estimate gross irrigation depths, for the simulations it was decided that irrigation would take place by conventional spraying, with the system efficiency being fixed at 75%. This efficiency value was used because it is a value that, in the scope of farms, can be easily obtained with the proper management of the system.
Crop water balances (CWB) were then performed for each site, combining the twelve sowing dates and the three soil available water capacities (AWC), regarding the irrigated crops. As a result of the daily water balance throughout the watermelon cycle at each site, the maximum evapotranspiration (ME) and the actual evapotranspiration (AE) of the crops were obtained for the different sowing dates and AWC data. In addition, the values of gross irrigation depth required were obtained for the irrigated crops, in which, because there was no water deficit in the soil, the actual value was equal to the maximum evapotranspiration (MOUSINHO et al., 2008).
Before the depth simulations, the adherence Kolmogorov-Smirvov test was performed at 5% significance level, for the series of gross depths obtained in the different crop water balances. After confirming the probability distribution fitting to the series of data, the parameters of this distribution, mean and standard deviation, were used to carry out one thousand simulations using the Monte Carlo method, thus obtaining one thousand depth values for the combinations of sowing dates and AWC values for irrigated watermelon crops (MOUSINHO et al., 2008).
Results and discussion
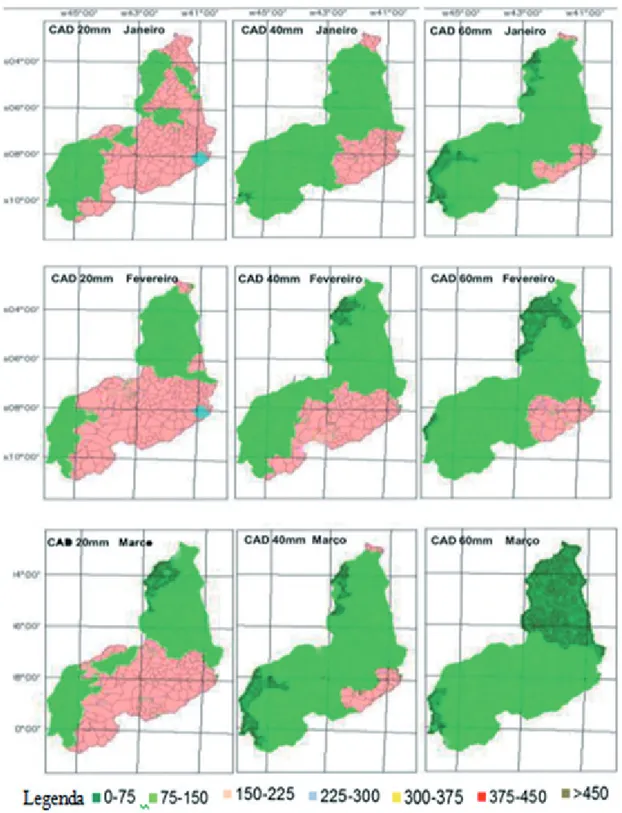
Thematic maps of simulated irrigation depths for watermelon crops in the State of Piauí, Brazil, for the different adopted AWC values and sowing dates are displayed in Figures 2 to 5. The gross irrigation depths for the watermelon cycle showed great variation in relation to the sowing dates. On the sowing dates of January 1st, February 1st and March 1st, regardless of the AWC, the classes of
Figure 2 - Gross irrigation depths (mm) for watermelon crops in the Piauí State, Brazil, with sowing taking place from January 1st to March 1st and with different soil available water capacities.
Source: Elaborated by the authors (2014).
Andrade Júnior (2000), working with data simulation to obtain irrigation depths for watermelon crops in the micro-regions of Teresina and Parnaíba, observed for the first sites depths that oscillated
around 24.3 mm, with sowing taking place in March; in other sites the depths for the same sowing date oscillated around 82.6 mm. Both results are depth intervals similar to those observed in the present study for the sowing date of March 1st for all adopted AWC values (20, 40 and 60 mm).
The situations of lower water supply requirements for watermelon cropping corresponded to the sowing dates from January 1st to March 1st, due to higher rainfall levels in those months in the Piauí State. That is, it is the highest rainfall season mainly affecting in the northern region of the State (MEDEIROS, 1996).
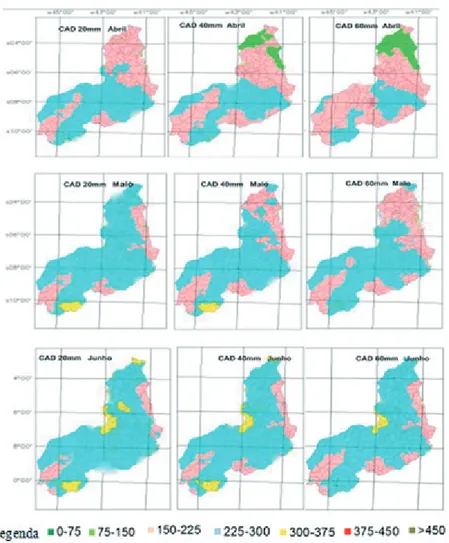
From the sowing date of April 1st, the demand for irrigation increased with the appearance of the
class intervals of gross irrigation depths that oscillated between 225 and 300 mm, mainly from the south center to the south of the State. With the sowing delayed to May 1st, there is a predominance of depth intervals between 225 and 300 mm for all values of AWC. This class interval increased the coverage area in the State when sowing was delayed to June 1st (FIGURE 3). According to Oliveira and Silva (2009), the thematic maps (water supply and demand) generated serve as a guide to set the best sowing dates for crops.
Figure 3 - Gross irrigation depths (mm) for watermelon crops in the Piauí State, Brazil, with sowing taking place from April 1st to June 1st and with different soil available water capacities.
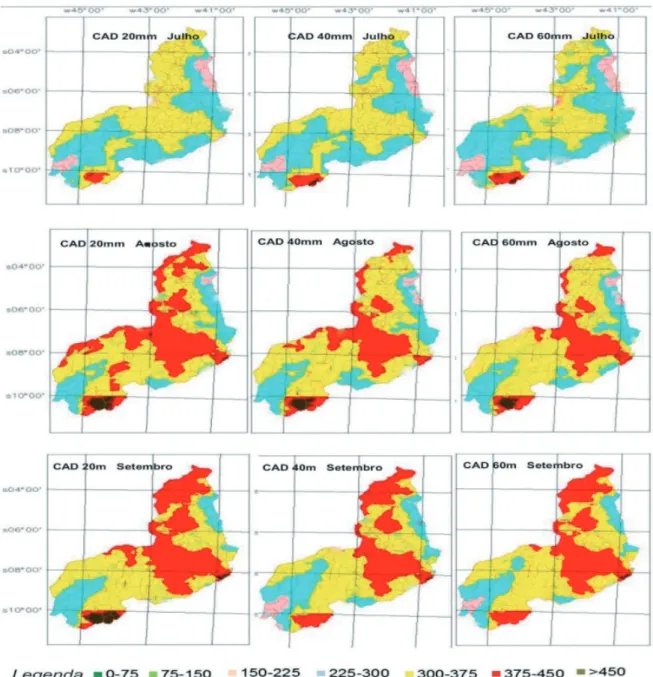
When sowing took place on July 1st, the classes of depths between 300 and 375 mm increased their area of coverage from the center to the north of the State, and there were small areas with irrigation demand higher than 375 mm in the south (FIGURE 4).
Figure 4 - Gross irrigation depths (mm) for watermelon crops in the Piaui State, Brazil, with sowing taking place from July 1st to September 1st and with different soil available water capacities.
Source: Elaborated by the authors (2014).
The classes of depths between 150 and 225 mm practically disappeared when the sowing date was August 1st. The classes of depths between 375 and 450 mm increased its area of coverage,
month of August, with values around 357.9 mm in the micro-region of Teresina, and 464.8 mm in the micro-region of Parnaíba, in the same Piauí State.
When sowing took place on September 1st, the classes of depths between 375 and 450
mm occurred in the north center and increased its area of coverage in the north of the State. This corroborates the result obtained by Rossato (2001), in which, for the same sowing dates (August 1st to September 1st), the soils showed the lowest amounts of accumulated water, thus increasing the amount of water to be applied to the soil for watermelon crops.
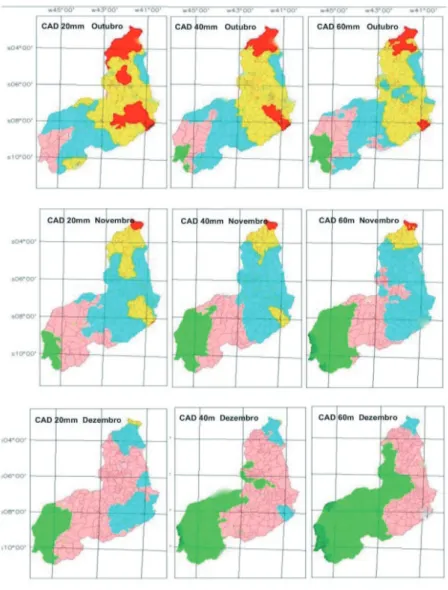
When sowing took place on October 1st, the classes of depths between 375 and 450mm
decreased in occurrence, occurring only in the north and northeast of the State. This is in accordance with the values recommended by Doorenbos and Kassam (2000), who suggest depths ranging from 400 to 600 mm for a complete cycle of watermelon crops (FIGURE 5).
Figure 5 - Gross irrigation depths (mm) for watermelon crops in the Piauí State, Brazil, with sowing taking place from October 1st to December 1st and with different soil available water capacities.
When sowing was delayed to November 1st, the depths between 75 and 150 mm covered the
southern region of the Piauí State, decreasing in occurrence those between 300 and 375 mm that were restricted to the north. In addition, the depths between 375 and 450 mm were encompassed practically the northern end with small coverage area.
When the sowing date was December 1st, the classes of depths between 75 and 150 mm
occurred from the south to the north center of the State. The area of coverage of depths between 150 and 225 mm ranged from the center north to the north of the State. In turn, small coverage areas were associated with depths in the interval between 225 and 300 mm, that occurred only in the northern region of Piauí State.
Conclusions
The sowing dates with the need for smaller irrigation sheets for the cultivation of watermelon throughout the State of Piaui and in all CAD situations are January 1st, February 1st and March 1st, and the sowing dates in need of Major irrigation sheets are August 1st, September 1st and October 1st.
The regionalized irrigation blanks varied according to the capacity of water available in the soil - CAD and date of planting.
Mapas temáticos para irrigação da cultura de
melancia no estado do Piauí
Resumo
Em regiões semiáriadas, o manejo inadequado da irrigação na cultura da melancia aumenta consideravelmente as perdas de produtividade. Em razão disso buscou-se regionalizar lâminas de irrigação necessárias para o cultivo da melancia no Estado do Piauí, considerando diversas épocas de semeadura e solos com diferentes capacidades de retenção de água. As lâminas de irrigação foram determinadas pelo balanço hídrico de cultivo, considerando uma série histórica de quinze anos, proveniente de registros diários de precipitação pluviométrica em 165 locais dessa região. A evapotranspiração de referência (ET0) e as respectivas lâminas brutas de irrigação foram estimadas em escala diária, para cada local. Em seguida, as lâminas brutas de irrigação foram espacializadas para toda região alvo por meio de uma rotina realizada no Excel e posteriormente utilizando o software SPRING 5.1.2, em função da capacidade de água disponível no solo e da data de semeadura. As datas de semeadura com a necessidade de lâminas de irrigação menores para o cultivo de melancia no Piauí foram 1º de janeiro, 1º de fevereiro e 1º de março e, em relação às datas de semeadura, as maiores lâminas de irrigação foram verificadas em 1º de agosto, 1º de setembro e 1º de outubro. Os lençóis de irrigação regionalizados variaram de acordo com a capacidade de água disponível no solo e a data de plantio.
References
ANDRADE JÚNIOR, A. S de. Viabilidade da irrigação, sob risco climático e econômico, nas microrregiões de Teresina e Litoral Piauiense. Tese apresentada à Escola Superior de Agricultura “Luiz de Queiroz”, Universidade de São Paulo – 2000.
AZEVEDO, B. M.; BASTOS, F. G. C.; VIANA, T. V. A.; RÊGO, J. L.; D’ÁVILA, J. H. T. Efeitos de níveis de irrigação na cultura da melancia. Revista Ciência Agronômica, Fortaleza, CE, v. 36, n. 1, p. 9-15, 2005.
BEZERRA, F. M. L.; OLIVEIRA, C. H. L. Evapotranspiração máxima e coeficiente de cultura nos estádios fenológicos da melancia irrigada. Revista Brasileira de Engenharia Agrícola e Ambiental, Campina Grande, v. 3, n. 2, p. 173-177, 1999.
CARVALHO, R. N. de. Cultivo da melancia para a agricultura familiar. Brasília, EMBRAPA -SPI, 1999. 127 p.
DOORENBOS, J.; KASSAM, A. H. Efeito da água no rendimento das culturas. Campina Grande, Universidade Federal da Paraíba, 2000. 221 p. (Estudos FAO: Irrigação e drenagem, n° 33, tradução Gheyi, H. R. e outros. Universidade Federal da Paraíba, Campina Grande, 2000).
DOOREMBOS, J.; PRUITT, W. O. Necessidade hídrica das culturas. Trad. de GHEYI, H.R.; METRI, J. E. C.; DAMASCENO, F. A. V. Damasceno. Campina Grande: UFPB, 1997. p. 47-72: Escolha do coeficiente de cultivo: Kc. (Estudos FAO: Irrigação e Drenagem, 24).
EMBRAPA - EMPRESA BRASILEIRA DE PESQUISA AGROPECUÁRIA. Centro Nacional de Pesquisa de Solos (Rio de Janeiro, RJ). Sistema Brasileiro de Classificação dos Solos. Brasília, 2006.
EMBRAPA - EMPRESA BRASILEIRA DE PESQUISA AGROPECUÁRIA. Soluções tecnológicas. Metodologia para estimativa da precipitação efetiva em áreas agrícolas. Embrapa Cerrados. Planaltina-DF, 2003.
FERREIRA, V. M. Coeficiente de cultura e lâmina ótima de irrigação para a melancia, na microrregião de Teresina-PI. 2012. Tese (Doutorado). Universidade Estadual Paulista.
FILGUEIRA, F. A. R. Novo Manual de Olericultura – Agrotecnologia moderna na produção e comercialização de hortaliças. 3. ed. Viçosa: Universidade Federal de Viçosa, 2008.
IBGE–INSTITUTO BRASILEIRO DE GEOGRAFIA E ESTATÍSTICA-2018. Disponível em: <http://sidra. ibge.gov.br/bda/tabela/listabl.asp>. Acesso em: 06 jun. 2019.
LIMA, M. G. de; RIBEIRO, V. Q. Equações de estimativa da temperatura do ar para o Estado do Piauí. Revista Brasileira de Agrometeorologia, Santa Maria, v. 6, n. 2, p. 221-227, 1998.
MEDEIROS, R. M. de. Isoietas médias mensais e anuais do Estado do Piauí. Teresina: Secretaria de Agricultura e Abastecimento e Irrigação, Departamento de Hidrometeorologia, 1996, 24 p.
MOUSINHO, F. E. P.; COSTA, R. N. T.; SOUZA, F.; GOMES FILHO, R. R. Função de resposta da melancia à aplicação de água e nitrogênio para as condições edafoclimáticas de Fortaleza, CE. Revista Irriga, Botucatu-SP, v. 8, n. 3, p. 264-272, 2003.
MOUSINHO, F. E. P.; ANDRADE JÚNIOR, A. S.; FRIZZONE, J. A. Viabilidade econômica do cultivo irrigado do feijão-caupi no Estado do Piauí. Acta Scientiarum Agronomy, Maringá-PR, v. 30, n. 1, p.139-145, 2008.
OLIVEIRA, L. F. C.; SILVA, M. A. S. Regionalização da lâmina suplementar de irrigação e época de semeadura do milho no estado de Goiás e Distrito Federal. Biosciense Journal, Uberlândia, v. 25, n. 4, p. 43-52, July/Aug. 2009.
OLIVEIRA, J. R. Espacialização das lâminas de irrigação para a cultura da melancia no estado do
Piauí. Dissertação de Mestrado. Universidade Federal do Piauí – UFPI. Teresina-PI. 84f. 2014. PEREIRA, A. R.; ANGELOCCI, L. R. SENTELHAS.; P. C. Agrometeorologia: Fundamentos e Aplicações Práticas. Agropecuária-Guaíba, 478 p., 2002.
RODRIGUES, B. H. N.; ATHAYDE SOBRINHO, C.; BASTOS, E. A.; MELO, F. de B; CARDOSO, M. J.; SILVA, P. H. S. da; DUARTE, R. L. R. A cultura da melancia/Embrapa Meio-Norte – 2. ed. rev. Amp. Brasília: Embrapa Informação Tecnológica, 2007. 85 p. il. (Coleção Plantar, 57).
ROSSATO, L. Estimativa da capacidade de armazenamento de água no solo do Brasil. São José dos Campos–SP. INPE, 2001.
SAMPAIO, S. C.; CORREA, M. M.; VILAS BOAS, M. A.; OLIVEIRA, L. F. C. de. Estudo da precipitação efetiva para o município de Lavras, MG. Revista Brasileira de Engenharia Agrícola e Ambiental, Campina Grande-PB. v. 4, n. 2, p. 210-213, 2000.
SANTOS, A. R.; PELUZIO, T. M. O.; SAITO, N. S. Spring 5.1.2 Passo a Passo: Aplicações Práticas. Alegre, ES: CAUFES, 2010. v.1, 153p.
SARAIVA, K. R.; BEZERRA, F. M. L.; SOUZA, F.; CAMBOIM NETO, L. F. Aplicação do “ISAREG” no manejo da irrigação na cultura da melancia no Baixo Acaraú, Ceará. Revista Ciência Agronômica, Fortaleza-CE. v. 44, n. 1, p. 53-60, 2013.
Received: April 3, 2019 Accepted: June 7, 2019