__________________________________________________________________________________________ 59
OPERATIONAL PERFORMANCE OF A TRANSFUSIONAL AGENCY: EVIDENCE OF A PUBLIC HEALTH CARE INSTITUTION FROM THE NORTHEAST OF
BRAZIL
Fábia Michelle Rodrigues de Araújo Callado
HUOC/Universidade de Pernambuco E-mail: fabiamrac@yahoo.com.br
Antônio André Cunha Callado
Universidade Federal Rural de Pernambuco E-mail: andrecallado@yahoo.com.br
Andréa Maria de Lima
HUOC/Universidade de Pernambuco E-mail: andreadelima@terra.com.br
ABSTRACT
The increase of the populations, expansion of human longevity, changes in the epidemiology of societies and the importance of technological advances resulting from greater understanding of the physiology, pathology and the health care treatments in most medical areas have broadened the possibilities of increasingly complex procedures with consequently greater demand for blood and transfusional agencies play a relevant role in it. Providing blood products for medical care procedures has become a major concern among health care institutions and the improvement of performance of transfusional agency is a relevant current issue. This paper aims to analyze the operational performance of a public transfusional agency of a public health care institution from the northeast of Brazil. Data regarding medical procedures, demand for blood, blood supply, and blood use from January to November of 2014 were gathered. Descriptive statistics was used to set up a database and hypothesis tests were used to analyze the significance of operational improvement from the managerial practices implemented. The results present high rates of operational efficiency. The results also indicate the managerial practices have improved the efficiency. In addition, results indicate that the metrics used were able to assist the decision making process of blood supply from the transfusional agency in this public health care institution. Contribute to the improvement of managerial practices regarding transfusional agency from the perspective of performance measurement. Further studies may amplify the understanding of this relevant health care issue.
Keywords: Performance measurement. Performance of Health Institutions. Performance of transfusional agency.
1. INTRODUCTION
Until a few decades ago, hospital organizations were administered as charity institutions, but nowadays they are seeking to improve management by implementing modern management methods (SOUZA, SOUZA & CRUZ, 2011; MARTINS ET AL., 2012).
__________________________________________________________________________________________ 60
Due to flawed management processes or inefficiency of processes and services, many stakeholders such as government, patients, health insurance companies, lenders and society in general, hospital organizations have been forced to seek mechanisms that are able to contribute to the improvement of their performance, including the identification of qualified managers able to conduct activities in an increasingly efficient manner (SOUZA, SOUZA & CRUZ, 2011; ALASTICO & TOLEDO, 2012; GUIMARÃES & COSTA, 2005).
Over the last twenty years, the public sector has been asked to improve performance of services provided to society, demonstrate greater transparency, and disclose results obtained in performance assessment processes, which has contributed to the improvement of their processes, (BIAZZI, MUSCAT & BIAZZI, 2009) including optimization of public administration in order to make it more efficient (BARBIERI & HORTALE, 2005).
In this quest for better levels of efficiency and modernization of public administration, performance management has been considered as an alternative capable of providing monitoring tools at various organizational levels (ODELINA & SANTOS, 2007). Performance evaluation in the public sector should consider efficiency, effectiveness and economy as evaluation dimensions (GRATERON, 1999).
The implementation of performance measurement criteria in the context of public administration involves relevant issues, among them the adoption of indicators derived from operational aspects (SILVA & DRUMOND, 2004).
The stimulus for continuous performance assessment operational processes within public administration is associated with the identification of objectives, goals and achievement of forecasted results (GRATERON, 1999; SILVA & DRUMOND, 2004; PERSON & KUROBA, 2014).
The increasing demand for health services, rising hospital costs and resource constraints have generated greater interest regarding performance measurements (CAMPBELL, ROLAND & BUETON, 2000).
The management principles used in public hospital organizations differs greatly from those of private management organizations. The growing global concern in the search for higher levels of efficiency and effectiveness in public resource management has required specific and detailed information on aspects that are not addressed in traditional financial reports which are insufficient and inappropriate to serve this purpose (GRATERON, 1999).
Hospital organizations exercise their operations through internal processes that have great complexity and interdependence (SOUZA, SOUZA & CRUZ, 2011; GUIMARÃES & COSTA, 2005) and have specificities pertaining to their management processes (ABDALA, 2006).
Among the auxiliary management tools used in public hospital organizations, the implementation of management controls from the adoption of performance indicators, at the same time require the development of managerial routines aimed at increasing efficiency (SOUZA ET AL., 2009).
The number of hospital organizations that adopt performance indicators within their everyday management practices is very small and the importance of these hospital management instruments within the planning and implementation of performance measurement systems of health services needs to be fully understood by their managers (MALIK & TELES, 2001).
Hospital organizations, like any other type of company, seek to create and develop performance indicators in order to improve the management of their operations (RAMOS & MIYAKE, 2010), due to the reason that performance evaluation is one of the major concerns for these organizations (SOUZA ET AL., 2009).
__________________________________________________________________________________________ 61
1991). Even in countries such as the United States, previous studies suggest that the practice of performance measurement and monitoring processes in organizations working in the health sector is poorly developed (LOEB, 2004; WILLIAMS ET AL, 2005).
One of the limitations relating to the implementation of performance indicators as a management tool is associated with ignorance of its purpose. The use of management information generated by performance measurement systems can provide much greater control of operations and the improvement of disclosure (GODOY ET AL, 2013).
Studies suggest that there is a growing awareness of the importance of using indicators designed for the purpose of improving the performance of a hospital's internal processes (RAMOS & MIYAKE, 2010).
The difficulties related to measuring the performance of activities within hospitals, especially those that act as educational institutions in health care, are significant (GODOY ET AL, 2013). The aim of this paper is to analyze the operational performance of a transfusional agency of a hospital from a public university located in the northeast region of Brazil.
2. PERFORMANCE MEASUREMENT OF PROCESS IN HEALTHCARE ORGANIZATIONS
Performance expresses a term derived as a perception of a network of collectively shared meanings within a given social context (MISOZKY & VIEIRA, 2011; LEVI, WILLIAMS, 2004).
Performance indicators can be defined as measurable parameters that provide relevant information about a particular phenomenon (ALASTICO & TOLEDO, 2012). Performance indicators can also be defined as numerical references with data that generate information about a phenomenon that can be useful to the decision-making process (GODOY ET AL, 2013).
Performance indicators are basic tools for organizational management that serve to describe the current situation of a particular process to assist the process of decision-making in the analysis of results, planning for future actions and identifying trends (VIEIRA, DETONI & BRAUM, 2006).
Starting from the composition of the operational process, performance indicators can be understood as simple indicators or composite indicators. Simple indicators are generally self-explanatory, they immediately describe a particular aspect of the hospital organizational reality or have a relationship between actions or situations, are excellent in conducting sectoral assessments, and in assessing compliance of pre-established goals.
Composite indicators are those that represent, in a synthetic way, a number of aspects of the reality of hospital organizations, grouping several simple indicators into a single number by establishing some form of relationship between them, either considering them equally or setting different relative importance among them (VIEIRA, DETONI & BRAUN, 2006).
The performance evaluation methods of hospital organizations can be classified into two separate strands (ALASTICO & TOLEDO, 2012). The first refers to the management approach that can take on the following forms:
Social Legitimacy; Internal Processes; and Human Relations.
__________________________________________________________________________________________ 62
the types of performance indicators used:
Financial indicators; Operational Indicators; and Service Quality Indicators.
The selection criteria for choosing particular performance indicators to be used by managers should be associated with what they plan to assess, as well as to whom this information will be available to (GODOY ET AL, 2013).
To meet management objectives derived from operational controls and in measuring the performance indicators used, the indicators used should have the following characteristics: Accuracy; Reliability; Relevance; Simplicity; Validity; Sensitivity; Cost-effectiveness; Availability; and
Comparability (VIEIRA, DETONI & BRAUM, 2006).
The managerial analysis of performance consists of the generation and accumulation of information in order to generate a database with historical series of actual achieved results that are critical to the assessment of the evolution of performance based comparisons (GODOY ET AL, 2013; ALASTICO & TOLEDO, 2012).
Starting from the generation of systematic information on performance, considered indicators can be evaluated using the following distinct parameters:
Analysis of historical data trends Comparative analysis of Benchmarking Combined analysis
The first analysis parameter is the calculation and management of the historical evolution of the results obtained through the use of selected performance indicators. This historical planning has the purpose of providing a comparison of trends.
The performance measurement in health care organizations should consider results of the processes, activities and individuals that allow data collection capable of generating information that can be compared with established standards (WHO, 2003).
The proposal of new performance indicators for hospital organizations should consider the following desirable qualities (PERSON & KUROBA, 2014):
What is the prospect of the indicator you want to reflect? What health care aspects will be assessed?
What is the available evidence?
The importance of performance indicators of hospital organizations can be attributed to the importance of evaluating the results through the measurement of management
__________________________________________________________________________________________ 63
efficiency and effectiveness, and the proper use of resources (AZEVEDO, 1993) and that the knowledge generated from the use performance indicators can influence various organizational levels and areas (SHAW, 2003).
Health sector organizations can be seen as systemic organizations that work through a set of interrelated activities that consume resources and produce goods and services through processes (GODOY ET AL, 2013). As organizations function predominantly as service providers, healthcare organizations operate through internal processes that have significant complexity and interdependence (SOUZA ET AL. 2009).
These health organizations play a fundamental role in society pertaining to the care of people, however, the search for information and the ability to evaluate and improve operational processes is not an easy task (PERSON & KUROBA, 2014).
The process can be defined as a set of activities performed for achieving a particular purpose operating from the following hierarchy of operations:
Processes;
Sub-processes; Activities; and
Tasks (RAMOS & MIYAKE, 2010).
Processes include activities related to the use of resources through quantitative and qualitative aspects, and results and their consequences on the promotion of health of individuals (DONABEDIAN, 1982).
The internal processes of hospital organizations should be measured and monitored by the analysis of efficiency, effectiveness and results in efforts to reduce errors and improve services to society (Ramos & MIYAKE, 2010). Efficiency indicates how the process uses or converts its resources, while effectiveness indicates how the process achieves its objectives, and results indicate how the process serves its clients (IBRAHIM, 2001).
To understand the functioning of a process with the aim of seeking to improve it, the identification of the adoption of appropriate performance indicators is necessary in order to illustrate the main aspects, as well as the interactions between the various stages of the process (BIAZZI, MUSCAT & BIAZZI, 2009). Among the various hospital management tools, process indicators are measures concerning an activity that can be used to monitor performance, and serve to improve the decision-making process (MARTINS ET Al, 2012; GODOY ET AL, 2013).
3. METHODOLOGY
This research was conducted in a hospital health organization linked to a public university located in northeastern Brazil.
To achieve the goal proposed for this research, we considered five performance indicators for the internal process of meeting the demands for surgical blood products in a hospital organization, namely:
Number of requests made - This performance indicator is intended to identify the frequency of demands for blood products in performing surgeries recorded in the transfusion agency;
Demand for blood components - This performance indicator is intended to quantify the average volume of blood products demanded for holding surgeries;
Meeting the requests made - This performance indicator is intended to identify the success rate of the transfusion agency referring to meeting the demands of blood
__________________________________________________________________________________________ 64
products for surgeries;
Effective use of blood components - This performance indicator is intended to identify the average volume of blood products effectively used from the analysis of the specifics of the surgery;
Effective Optimal use of blood components - This performance indicator is intended to quantify the average volume of blood components spared.
These indicators were prepared by the management of the transfusion agency in order to increase the efficiency of internal processes associated with the provision of blood products for surgical procedures.
The procedures adopted for the collection of data necessary for the operation of this research were eminently documented based on the data analysis of 1328 requests and use of blood transfusion records in the agency's public university hospital organization investigated from January to December 2014 derived surgical procedures distributed between 8 groups of different surgical procedures. For the analysis of the results, two different techniques of performance indicators analysis were used:
Descriptive statistics;
Kruskal-Wallis test.
4. RESULTS
Considering the proposed objective, as well as the methodological procedures adopted for the implementation of this research, the data collected was organized considering both the month and the groups of surgical procedures, in pursuit of performance measurement indicators adoption to improve the operational processes. Initially, the data was organized using descriptive statistics. Frequency distributions of the number of requests for blood products by group of surgical procedures have been identified. The results are shown in Table 1.
Table 1: Frequency distribution of the number of requests made considering the different surgery groups
Groups Jan Feb Mar Apr May June July Aug Sept Oct Nov Dec Total
Group A 24 41 39 42 41 28 43 35 51 42 40 22 448 Group B 20 43 29 36 39 34 48 40 53 49 35 27 453 Group C 15 9 12 10 19 11 17 11 22 22 11 6 165 Group D 4 9 9 7 8 4 9 8 10 10 5 6 89 Group E 8 19 19 20 20 12 20 21 21 22 19 12 213 Group F 3 2 3 2 2 5 1 5 3 4 2 3 35 Group G 4 2 2 2 2 2 3 6 2 3 1 29 Group H 2 6 1 1 3 1 1 15 Total 78 127 119 119 132 94 140 124 169 152 116 77 1447
The results show that four groups of surgical procedures have been responsible for carrying out almost 90% of blood products requests in 2014 (groups A, B, C and E). The other groups were responsible for a much smaller volume of surgical procedures, particularly groups G and H, which did not record requests every month of the year. This result indicates the presence of an operating hierarchy of importance between the different groups of surgical procedures and more detailed analyses of their specificities have justified managerial
__________________________________________________________________________________________ 65
foundation.
Continuing in the analysis of the results, the average volumes of blood products demanded considering the groups of surgical procedures were calculated. The results are shown in Table 2.
Table 2: Average volumes of blood products demanded considering the different groups of surgeries (units)
Overall
Groups Jan Feb Mar Apr May June July Aug Sept Oct Nov Dec mean
Group A 2,47 2,41 2,25 2,76 2,51 2,50 2,46 2,45 2,68 2,90 2,47 2,72 2,55 Group B 2,52 2,49 2,34 2,02 2,58 2,17 2,33 2,15 2,24 2,16 2,14 2,40 2,30 Group C 2,86 2,66 2,75 2,80 3,00 2,90 2,82 2,90 2,59 2,45 2,90 2,83 2,79 Group D 3,50 2,77 3,00 2,71 3,00 2,50 3,11 3,25 2,10 3,40 2,60 2,50 2,87 Group E 3,62 2,00 2,47 2,25 2,42 2,00 2,65 2,30 2,23 2,45 2,63 2,83 2,49 Group F 2,33 2,00 2,00 2,50 2,00 3,80 5,00 4,40 3,00 2,00 3,50 3,00 2,96 Group G 2,25 2,50 2,00 0,00 2,00 3,50 2,00 2,00 2,00 2,00 2,00 2,02 Group H 2,50 3,33 2,00 2,00 2,33 3,00 3,00 2,59 Overall mean 2,79 2,42 2,52 2,15 2,44 2,65 3,12 2,68 2,40 2,55 2,66 2,61 2,57
The results in the table shown above indicate that the average volumes of blood components demanded did not present a defined standard in any of the groups of specific surgical procedures, indicating the possible presence of specific factors resulting from each of the individual modes of operations, making the adoption of standardized management procedure processes difficult in meeting demands. Among the groups of surgical procedures responsible for the highest number of blood component surgical procedure requests in 2014, group B had the lowest overall average volumes (2.3 units), while the procedures for group C presented the highest (2.79 units). Additionally, a significant result worth noting is the demands requested by the surgical procedures of group F had the highest overall average volume of blood products units per procedure (2.96 units).
To illustrate the variability of demand for blood products between the various groups of surgical procedures, the same values were arranged in Figure 1.
Figure 1: Average volumes of blood products demanded considering the different surgery groups
__________________________________________________________________________________________ 66
These results confirm the relevance of more detailed analysis of specific surgical procedures with regard to the technical guidance of future demands.
Subsequently, the data relating to average volumes of blood products actually used in relation to/considering the surgical procedures groups were organized. The results are shown in Table 3.
Table 3: Average volumes of blood products effectively used considering the different groups of surgeries (units)
Overall
Groups Jan Feb Mar Apr May June July Aug Sept Oct Nov Dec mean
Group A 0,17 0,29 0,10 0,11 0,21 0,10 0,20 0,14 0,19 0,19 0,10 0,22 0,17 Group B 0,26 0,06 0,17 0,11 0,15 0,11 0,06 0,05 0,09 0,00 0,11 0,07 0,10 Group C 0,00 0,00 0,00 0,20 0,00 0,27 0,00 0,18 0,09 0,00 0,09 0,00 0,07 Group D 0,50 0,22 0,00 0,14 0,12 0,00 0,33 0,25 0,00 0,00 0,00 0,00 0,13 Group E 0,00 0,10 0,05 0,45 0,10 0,00 0,45 0,00 0,00 0,00 0,10 0,16 0,12 Group F 0,00 0,00 0,00 0,00 0,00 0,00 0,00 0,00 0,00 0,00 0,00 0,00 0,00 Group G 0,50 0,00 0,00 0,00 0,50 0,00 0,00 0,00 0,00 0,00 0,00 0,09 Group H 0,00 0,00 0,00 0,00 0,00 0,00 0,00 0,00 Overall mean 0,20 0,08 0,04 0,14 0,14 0,08 0,15 0,08 0,05 0,02 0,05 0,06 0,08
The results confirm that higher relative importance of the four groups of surgical procedures account for the largest proportion of requests for blood products for the performance of surgical procedures in 2014 (groups A, B, C and E).
The effective optimization of the use of blood products considering the different groups of surgical procedures analyzed were estimated. The results are shown in Table 4.
Table 4: Optimal use of blood products for surgery groups (%)
Overall Groups Jan Feb Mar Apr May June July Aug Sept Oct Nov Dec mean Group A 93,12 87,97 95,56 96,01 91,63 96,00 91,87 94,29 92,91 93,45 95,95 91,91 93,39 Group B 89,68 97,59 92,74 94,55 94,19 94,93 97,42 97,67 95,98 100 94,86 97,08 95,50 Group C 100 100 100 92,86 100 90,69 100 93,79 96,53 100 96,90 100 97,52 Group D 85,71 92,06 100 94,83 96,00 100 89,39 92,31 100 100 100 100 95,47 Group E 100 95,00 97,98 80,00 95,87 100 83,02 100 100 100 96,20 94,35 95,28 Group F 100 100 100 100 100 100 100 100 100 100 100 100 100 Group G 77,78 100 100 0,00 75,00 100 100 100 100 100 100 95,51 Group H 100 100 100 100 100 100 100 100
The data shows that optimizing the use of blood products obtained significant results, considering the demanded volumes and the actual volumes used, confirming that the adoption of adequate analysis procedures of blood products requested according to the specificities of surgical procedures was responsible for the increase in the effectiveness of the operational process in question.
Finally, the data relating to the four groups with the most relevant surgical procedures was used for the operation of a hypothesis test in search of statistical significance of the differences found between these four groups through the Kruskal-Wallis test (p = 0.05).
__________________________________________________________________________________________ 67
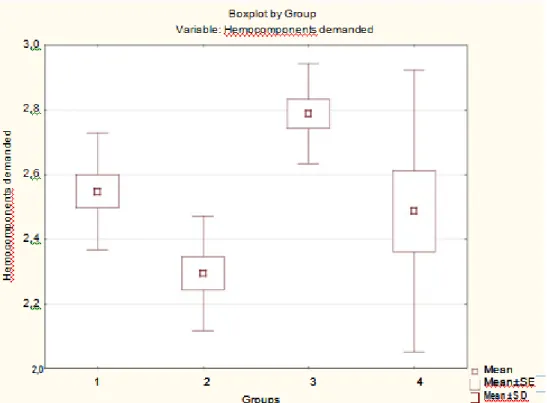
Firstly, the average volumes of blood products demanded by the surgical procedures groups were considered. The results are shown in Figure 2.
Figure 2: Average volumes of blood products demanded by groups A, B, C and E (units) Note 1: 1 - Group A; 2 - Group B; 3 - Group C;
4 - Group E. Note 2 : p=0,01.
The results in Figure 2 demonstrate that the differences observed in the average volumes of blood components demanded among groups of surgical procedures A, B, C and E are statistically significant. Group B has the lowest average volume of blood components, while group C has the highest.
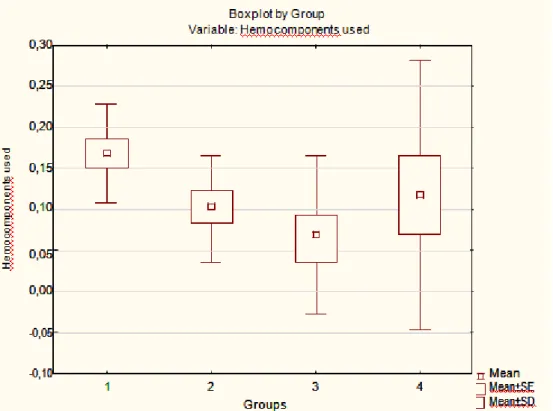
The same statistical procedures were adopted considering the average volumes of blood products actually used in demanded surgical procedures, by group. The results are shown in Figure 3.
__________________________________________________________________________________________ 68 Figure 3: Average volumes of blood products effectively used by groups A, B, C e E (units)
Note 1: 1 - Group A; 2 - Group B; 3 - Group C; 4 - Group E. Note 2 : p=0,03.
The results indicate that once again, the differences are statistically significant. It can be observed that the surgical procedures used for group A used average volumes of blood products superior to other tested groups and the procedures for group C consumed the lowest average volumes of blood components.
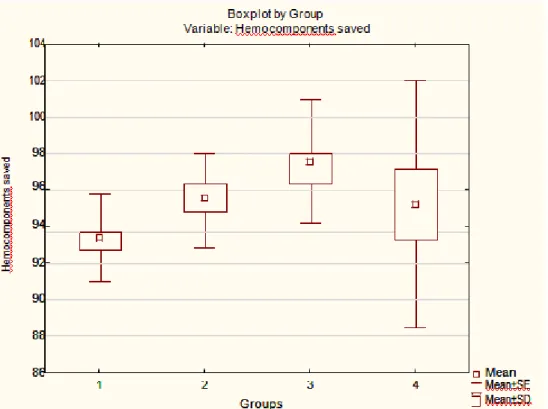
Finally, the same statistical procedures were operationalized considering the average volume of blood components spared. The results are shown in Figure 4.
__________________________________________________________________________________________ 69 Figure 4: Average volumes of blood products effectively spared by groups A, B, C and E (units)
Note 1: 1 - Group A; 2 - Group B; 3 - Group C; 4 - Group E. Note 2 : p=0,03.
The differences in spared volumes also showed statistically significance. The results show that higher optimization levels were observed in the surgical procedures of group C, while the results obtained in relation to group A surgical procedures were the lowest.
5. CONCLUSIONS
The aim of this paper was to analyze the operational performance of a public transfusional agency of a hospital from a public university located in the northeast region of Brazil. Data from 1328 regarding both request and use of blood products recorded from January to December 2014 distributed among eight different groups of surgical procedures were analyzed.
Descriptive statistics showed that four groups were responsible for almost 90% of all surgical procedures carried out during that period of time. It was also observed that the mean amount of demand for blood components as well as the mean amount of blood products used varied throughout the period in all groups of surgical procedures analyzed. The transfusional agency provided blood products to all requests registered. The results also demonstrated that the evaluation performed on in each demand for blood products was able to increase the efficacy of the process.
The statistical test performed provided evidence supporting the presence of statistically significant differences between the four most relevant groups, demonstrating that this approach was more suitable for this operational process rather than standard order of blood products.
__________________________________________________________________________________________ 70
of any kind of comparison with previously published results. Further studies should be performed in order to provide a better understanding about the nature of the operational process from transfusional agencies to surgery departments providing key aspects behind the relationships between them. Although these results are statistically significant, they are not sufficient to meet a large portion of questions arising from them.
REFERENCES
Abdala, E.C. (2006, outubro). A gestão orientada por processos: um estudo de caso em uma organização hospitalar brasileira. Anais do Congresso Brasileiro de Sistemas, Ribeirão Preto, SP, Brasil, 2.
Alastico, G.P.; Toledo, J.C. de. (2012, outubro). Desempenho hospitalar: revisão bibliográfica sobre perspectivas e gestão. Anais do Encontro Nacional de Engenharia de Produção, Bento Gonçalves, RS, Brasil, 32.
Azevedo, A.C. (1993). Indicadores de qualidade e produtividade em serviços de saúde.
Revista Indicadores de Qualidade e Produtividade, 1 (1), 49-54.
______________. (1991). Avaliação de desempenho de serviços de saúde. Revista de Saúde
Pública, 25 (1), 64-71.
Barbieri, A.R.; Hortale, V.A. (2005). Desempenho gerencial em serviços públicos de saúde: estudo de caso em Mato Grosso do Sul, Brasil. Caderno de Saúde Pública, 21 (5), 1349-1356.
Biazzi, M.R. De; Muscat, A.R.N.; Biazzi, J.L. de. (2009, outubro). Aperfeiçoamento de processo e melhoria de desempenho no setor público brasileiro. Anais do Encontro
Nacional de Engenharia de Produção, Salvador, BA, Brasil, 29.
Campbell, S.M.; Roland, M.O.; Bueton, S.A. (2000). Defining quality of care. Social Science
& Medicine, 51 (11), pp. 1611-1625.
Donabedian, A. (1982). The criteria and standards of quality. Ann Arbor, Mich. Health
Administration Press (Series: Explorations in quality assessment and monitoring, v. 5).
Ibrahim, J.E. (2001). Quality in health care: outcomes. Best Practices & Research Clinical
Anaesthesiology, 15 (4), 589-605.
Godoy, L.P.; Perufo, L.D.; Rodrigues, M.K.; Wegner, R. da S. (2013, outubro). O monitoramento e controle dos processos de saúde através de indicadores de qualidade.
Anais do Encontro Nacional de Engenharia de Produção, Salvador, BA, Brasil, 33.
Grateron, I.R.G. (1999). Auditoria de gestão: utilização de indicadores de gestão no setor público. Cadernos de Estudo, FIPECAFI, 21, 1-18.
Guimarães, V.M.; Costa, M.A. (2005). Fixação de padrões na atividade hospitalar. Revista de
Administração, 4, (2), 1-14.
Levi, P.E.; Willians, J.R. (2004). The social context of performance appraisal: a review and framework for the future. Journal of Management, 30 (6), 881-905.
Loeb, J.M. (2004). The current state of performance measurement in health care. International
Journal for Quality in Health Care, 16 (1), i5-i9.
Malik, A.M.; Tees, J.P. (2001). Hospitais e programas de qualidade no Estado de São Paulo,
Revista de Administração de Empresas, 41 (3), 51-59.
Martins, C.; Amorim, M.C.S.; Cunha, E.N. da; Ferraz, M.R. (2012). Comissões hospitalares: a produção de indicadores de gestão hospitalar. Revista de Gestão em Sistemas de Saúde, 1 (1), 97-107.
Misoczky, M.C.; Vieira, M.M.F. (2001). Desempenho e qualidade no campo das organizações: uma reflexão sobre significados. Revista de Administração Pública, 35 (5), 163-177.
__________________________________________________________________________________________ 71
Odelina, C.C.; Santos, P.R.G. dos. Avaliação de desempenho individual na administração pública federal: aspectos intervenientes no processo e nos resultados. Revista Economia e
Gestão, 7 (15), 10-30.
Pessoa, T.R.; Kuroba, D.S. (2014). Gerenciamento de indicadores de desempenho em organizações hospitalares: em busca da maximização de resultados. Caderno Saúde e
Desenvolvimento, 3 (2), 37-48.
Ramos, A.W.; Miyake, D.I. (2010). Desenvolvendo indicadores de produtividade e qualidade em hospitais: uma proposta de método. Produto & Produção, 11 (2), 67-84.
Shaw, C. (2003). Evaluating accreditation. International Journal for Quality in Health Care, 15 (6), 455-456.
Silva, I.L.; Drumond, R.B. (2004, julho). A necessidade da utilização de sistema de custos e de indicadores de desempenho na administração pública. Anais do Congresso USP de Controladoria e Contabilidade, São Paulo, SP, 9.
Souza, N.C. de; Souza, A.A. de; Cruz, N.G. da. (2011, outubro). Sistema de controle interno em organizações hospitalares. Anais do Encontro Nacional de Engenharia de Produção, Belo Horizonte, MG, Brasil, 31.
Souza, A.A. De; Guerra, M.; Lara, C.O.; Gonide, P.L.R.; Pereira, C.M.; Freitas, D.A. (2009). Controle de gestão em organizações hospitalares. Revista de Gestão/USP, 16 (3), 15-29. Vieira, D.K.; Detoni, D.J.; Braum, L.M. dos S. (2006, outubro). Indicadores de qualidade em
uma unidade hospitalar. Anais do Simpósio de Excelência em Gestão e Tecnologia, Rezende, RJ, Brasil, 3.
Williams, S.C.; Schmaltz, S.P.; Morton, D.J.; Kosss, R.G.; Loeb, J.M. (2005). Quality of care in U.S. Hospitals as reflected by standardized measures, 2002-2004. The New England
Journal of Medicine, 353 (3), 255-264.
World Health Organization. (2003). Measuring hospital performance in improve the quality of care in Europe: a need for classifying the concepts and defining the main dimensions.