A Work Project, presented as part of the requirements for the Award of a Masters Degree in Management from the Faculdade de Economia da Universidade Nova de Lisboa.
ACCESSING THE DETERMINANTS OF BEHAVIORAL INTENTION TO ADOPT FINTECH SERVICES AMONG THE MILLENNIAL GENERATION
FILIPE AUGUSTO BARROS RAMOS - 2741
A Project carried out with the supervision of: Luis F. Martinez
Abstract
The purpose of this study is to assess the determinants of behavioral intention to adopt financial technology services among the millennial generation using the Unified Theory of Acceptance and Use of Technology, one of the most recognized and developed theories of behavioral intention and technology acceptance. An online survey collected the data (N=165) to test the practicality of the model which was analyzed with structured equation modeling practices using the Partially Least Squares estimation. Additionally, multi-group analysis studied the impact of different education levels, the moderator variable in the model. Results show that, from all three variables applied, performance expectancy has the highest impact on behavioral intention to use Fintech followed by one’s perception of own financial literacy. In contrast, effort expectancy presented a poor direct effect and differences between bachelor and master students revealed to be not significant.
Keywords: UTAUT; Fintech Adoption; Financial Technology; Millennials
Acknowledgments
I would like to express my warmest and sincere gratitude to all who contributed for the conclusion of this work project. From my family for believing in me and always supporting my decisions, to my friends who gave me motivation to work harder while offering constructive criticism about the project, to Universidade Nova de Lisboa for offering useful learning tools and the opportunity to develop my competences and finally, to my supervisor for guiding my work-project with valuable insights.
Introduction
“Learning and innovation go hand in hand. The arrogance of success is to think that what you did yesterday will be sufficient for tomorrow”
- William Pollard
Traditional banking is becoming less and less attractive for the next generations and the development of financial technology-led companies offering more tailored services is disrupting one industry that has seen small changes as far as innovation is concerned. With the worldwide financial crisis still carved in our society and the increased regulation and supervision on the banking industry, new players in the financial industry are taking advantage of technology to modernize financial services in a time where customers are losing trust on the stability and performance of traditional banks.
These new market entrants operate under the term FinTechs, which is a “dynamic segment at the intersection of the financial services and technology sectors” (PwC, 2016) where technology-led companies innovate products and services provided by the traditional financial services industry, generally offering alternative ways of access to customer segments who are being poorly served.
Financial technology innovation can include advances in transactional operations such as payments and exchanges or intertemporal operations like investment, insurance or borrowing. Examples of Fintech products are stock trading apps and websites, peer to peer lending platforms that compete with traditional loans, consequently, lowering interest rates, programmed
algorithms for portfolio management, all-in-one personal finance management and even budgeting tools.
Worldwide investment in Fintech has grown exponentially reaching $22bn in 2015, an overall growth of 75% ($12,6bn in 2014), resulting in more than $50bn funded to almost 2500 companies since the beginning of this financial revolution in 2008 (Skan, Dickerson, & Gagliardi, 2016). Given last years flow of investment, it is likely that this industry will continue to grow and spread its innovation among its business lines as more funds are absorbed by the technology sector.
But what is the future of Fintech and the traditional banking industry? Will Fintech fully replace banking services or complement them? What do customers think about these new players? Will next generations continue to adopt new technologies in such a complex industry? The answers depend on the development of next generations and how tech-savvy they are becoming.
With the millennial generation already representing around one third of the world’s population (U.S Census Bureau, 2016), surpassing baby boomers, their impact on the economy is creating new trends of economic interactions. Being a generation of digital natives, they are 2.5 times more likely to be an early adapter of technology than other generations and 24% of millennials state that technology use is what makes their generation unique. Such facts show completely different set of characteristics and behavioral attitudes in perhaps one the most educated generation that has ever existed. Comparing to other generations, millennials have different priorities such as entering the housing market in a later stage of life, preference for access to products instead of possession and of extreme importance, they are used to access more
and more price comparisons and product information due to the increased supply of products and services in almost every industry (Goldman Sachs, 2016)
In a transition period between studies and employment, many start receiving their first salary while others are reaching their prime working and spending years. Important life decisions are made during this timeframe so it’s of key importance for successful organizations to proceed with focused plans to introduce next-generation offerings. According to Capgemini report on Fintech, generation Y and tech-savvy customers demonstrate less willingness to be loyal to a firm if their expectations are not met, thus lack of investment in innovation will eventually dissuade the most lucrative customer segments. (Capgemini, 2016)
Furthermore, economic expectations and decisions, as research seems to show (Lusardi & Mitchell, 2014), are clearly related to financial knowledge and behavior, as higher literacy is beneficial for savvier saving, better management and planning for greater wealth accumulation. This causality has led many customers to seek for better financial tools and information to boost economic returns and consequently, improve one’s life quality. However, overall worldwide levels of financial literacy are relatively low among adults, showing significant room for improvement. Modern societies, despite showing higher financial inclusion, i.e., “the process of promoting affordable, timely and adequate access to a wide range of regulated financial products and services” (Atkiinson, A.; Messy, 2013), still lack basic financial awareness and education that promote weak economic well-being and social inclusion, resulting in poor rational decisions.
From this context, understanding how Millennials will approach and deal with new technologies in the financial industry was the starting point of this research. Will they continue to follow traditional banking services due to their convenience or will the generation Y seek to
gain financial knowledge to better edge their positions and profit from rational financial decisions with nontraditional firms? This work project seeks to understand this questions by accessing the impact of three determinants of financial technology adoption to help create visualization of a new and digitalized financial world.
Next, it will be firstly presented the theoretical background needed to understand the hypothesis of the research question followed by the practical part where the statistical analysis of a survey data will offer some insights on the adoption of financial technology. The first part will introduce the concept of technology and its evolution throughout history. It will also expose the main theories of technology usage and adoption and how they have evolved through the years in past studies. The second part presents the research method used and its methodology, explaining what was the sphere of study taking into account the direction of this work project. Finally, the results will discuss the impact of the main determinants on financial technology adoption, in theory and practice, while offering some insights for financial players in the market who want to take advantage of this new financial era. It will also state limitations and possible future research questions for anyone who might want to pursue further studies about this topic.
Literature Review
Evolution of technology is one of the causes of the rise of digital modern societies and worldwide communications as we know them. As Read Bain defines "technology includes all tools, machines, utensils, weapons, instruments, housing, clothing, communicating and transporting devices and the skills by which we produce and use them." (Bain, 1937). We then consider technology , along with society, language and religion, as a pillar of evolution of culture (Christiansen et all., 2016), therefore, understanding the history of technology requires unfolding the history of the
human population and theories of evolutions. Hence, one cannot study generational differences without mentioning technology adoption.
One consequence of different vertically transmitted traits between generations is the blockage of exchanged information and ideas, thus leading to increased innovation and diffusion of technology (Spolaore & Wacziarg, 2011), at a cost of lower adoption rates for older generations with different characteristics and behaviors, making future generations more tech-savvy and more tech-dependent. As a consequence, research on technology acceptance and use has been contributing to the success of organizations assessing the necessities towards future challenges and innovations that will transform our society and the way we live, as the world’s future consumers.
Unified Theory of Acceptance and Use of Technology
The Unified theory of acceptance and use of technology (UTAUT) is a technology adoption model that compiles eight existing models from previous scholars who applied theories from psychological, behavioral and social sciences (e.g.(Davis, 1989), into explaining intention to adopt and use technology, like the Theory of Reasoned Action or the Technology Acceptance Model, among others. (Morris et al., 2003)
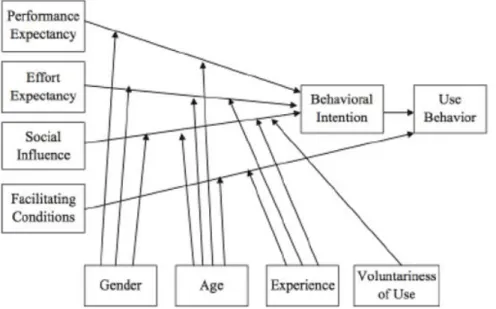
As can be observed in figure 3 of the Appendix, the UTAUT comprises the four main determinants of use and intention (Performance Expectancy, Effort Expectancy, Social Influence, and Facilitating Conditions) along with four moderators of key relationships (age, gender, experience and voluntariness). This theory explains around 77% of the variance of behavioral intention to use a technology while only counting for 52% of the variance of actual technology use (Morris et al., 2003), values that can be considered one of the most established predictors of research on information systems. However, the author itself claims that the theory is reaching its limits to explain individual
acceptance and usage of technology, thus future and more complex advances in such a mature research will only dissuade scholars from the main objective. Fact explained by the lower predictive power of UTAUT2 (Venkatesh et all., 2016), where additional constructs were added, dropping explained variance of behavioral intention to 74%.
Nevertheless, there is a wide range of industries and businesses where it can still be applied, with many studies focusing a specific range of technology, such as Liao et all (2004) studied the adoption of web-based learning environment among students; the acceptance of biometrics (Lancelot Miltgen et all., 2013) or even the use of NFC mobile payments in hotels (Morosan & DeFranco, 2016).
Researchers’ interest on the financial industry has been growing significantly over the past years and studying the extent to which consumers are willing to use technology in financial decisions will provide good insights for managers of financial and non-financial institutions to adapt their business models accordingly. Newly created technologies and innovative information systems are changing customer behaviors and financial interactions as research demonstrates, ranging from social media and mobile applications (Workman (2014), online shopping acceptance (Lian et all., 2014) to mobile banking (Oliveira et all, 2016). Regarding literature on financial innovation, there’s a wide spectrum of topics going from its impacts on different economies, as Throsten, Tao, Chen and Frank have concluded that effects of this innovation have higher impacts on larger and more mature security markets (Beck et all., 2016) or the linkage between finance and real-life needs as a cause of financial technology diffusion and growth (Chen, 2016).
In contrast, financial literacy studies have mainly focused the improvement of consumer’s decision making (Hilgert et all., 2003) or its impact on the quality of financial industry outcomes (Mcdaniel, 2002). In the event of its integration with technology adoption, previous studies
demonstrate that financial knowledge surges as a consequence of technology development (Fernandes, 2005) rather than a cause of technology adoption.
To conclude, the evident lack of investigation on this topic offers great opportunities for future research, thus, providing motivation to guide this research towards the development of financial literacy and technology adoption theories.
Model and Hypothesis
The model used in this work project is classified as an extension of a part of the UTAUT since it only includes part of the original structure combined with an additional construct (Venkatesh et al., 2016). To explain Behavioral Intention to use financial technology (BI), only two constructs were used as the baseline model: Performance Expectancy (PE) – which is described as the extent to which a person believes that using the system will increase performance and improve the outcome of an activity (Venkatesh et al., 2012); and Effort Expectancy (EE) - referring to the degree of ease associated with the use of the system and the comfort one gets with increased usage of it (Venkatesh et al., 2012)
Financial Literacy (FL) – i.e. knowledge and skills to manage financial resources for effective decision making of financial matters- was the added constructed. As Paiella shows, “the willingness to declare one’s expectations depends on perceived knowledge or confidence” (Paiella, 2016). Hence, perceived financial literacy is considered to have a direct impact on EE and both mediating and direct effect on BI.
Only one moderator was used in the relationships that explain BI. This categorical moderator studies the difference between levels of education of millennials and its significance.
Since one of the research goals is prediction and development of existing theory (Jöreskog et all., 1982) and taking into consideration the non-normal distribution characteristics of our data (Hair et
all., 2012), the partial least square structural equation modelling (PLS-SEM) method will be applied to estimate casual-effect relations between independent and dependent variables. This method is consisted by the combination of the measurement model with the structural model. The former can be defined as the part of the model that examines the relationship between the constructs and their observed instruments while the latter is defined as the relationship between latent variables. The main objective of PLS is to maximize the explained variance in the dependent constructs by minimizing the error of the latent variables and assess the quality of the data through the measurement model characteristics SPSS and SmartPLS software were used to run estimates on the model. (Hair et all., 2011). The model is structured as follows:
Figure 1 - Model configuration Fonte: SmartPLS with modifications
Each latent variable (represented as a circle) has a scale, i.e., a set of four observed indicators with their own specific loading. PE and FL represent exogenous constructs while EE and
- - - Measurement Model /outer model
. . . Structural Model / inner model
Education
H3.1+
H1+
H2+
BI are endogenous constructs. The path model shows the connections of the variables based on theory and logic to visually display the hypotheses that will be tested:
H1 - Performance expectancy positively influences behavioral intention to use Fintech services/products.
H2 - Effort Expectancy positively influences the behavioral intention to use Fintech services.
H3.1 - Financial Literacy positively influences Effort Expectancy.
H3.2 - Financial literacy positively influences behavioral intention to use Fintech services.
Structural Equation Modelling cannot be used to verify causality between variables, thus, for the purposes of this work project the direction of causalities is an assumption of the model, implying correlation between constructs.
Methodology
A web-based survey was designed and constructed using the Qualtrics Survey software, which provides a good distribution and analyses tool for questionnaires providing a set of data for forward statistical analysis.
The survey can be divided in two parts: the first was focused on understanding the actual usage of Fintech of the respondents while the second part evaluates the respondents’ agreement on topics based on previous studies on behavioral intention to use a technology. To rate the degree to which respondents agree or disagree with a statement, a five point Likert scale from “Strongly Disagree” to “Strongly Agree” was used in each item of the model. As can be observed in table 5 of the Appendix, for PE, EE and BI the statements were adapted from previous research of Venkatesh et al. (2003) while for FL was self-developed.
Focusing the millennial generation, this survey targeted people born between 1980 to 2000 (age in 2016 between 16 and 36) from my personal network and was distri buted through social media to roughly 375 persons. A total of 200 respondents answered the survey, corresponding to a 53% response rate. Before testing the information, data quality preprocessing and exploration methods were applied to clean the data with noisy, inconsistent or missing information to improve the quality of the conclusions. 16 observations had missing data, specifically the outcome (dependent) variable, so they were ignor ed. Additionally, 19 more were removed due to the lack of more than two items of each construct resulting in 165 valid answers. Regarding missing values on three observations, qualitative variables were filled with the correspondent median while for quantitative variables the average was used. The rule of thumb for this type of study specifies a minimum sample size as 10 times the largest number of predictors for any dependent variable in the model (Gefen et all., 2011), thus, by this assumption we can validate the statistical power of the sample size. The following table presents the demographic variables regarding the data used:
Table 1 - Demographic information of the survey Fonte: Self-developed
Demographic variables Frequency (N) Percentage (%)
Gender Male 91 55% Female 74 45% Total: 165 100% Age [16 - 20] 5 3% [21 - 25] 130 79% [26 - 30] 28 17% [31 - 35] 2 1% Total: 165 100% Education
High School or less 12 7%
Bachelor 61 37%
Master 91 55%
PhD 1 1%
Employment Status Student 81 49% Worker 68 41% Unemployed 11 7% Other 5 3% Total: 165 100% Estimated model
In order to improve the prediction ability of the model and present robust results, several statistical analyses were performed regarding reliability and validity assessment. As for reliability concerns (Peter et all., 1986), the consistency of the survey used is translated by a reliability coefficient that measures the characteristics of a relationship between variables. On other hand, validity studies the extent to which the model is truly measuring what is intended to measure (Borsboom et al. 2004). Considering that we are using adapted variables from previous research, this type of analysis will help to assess the usefulness and suitability of this model. For this purpose, it will be presented a confirmatory factor analysis for the measurement models in order to test for internal consistency reliability, indicator reliability, convergent validity and discriminant validity. Cronbach’s Alpha and Composite reliability are the coefficients that test reliability and should be higher than 0.7, an accepted level of reliability, where values under 0.4 should be disregarded as they represent poor scale constructions. Regarding indicator reliability, more than 50% of each indicator’s variance should be accounted for by the construct it is connect with, thus each indicator’s outer variance should be higher than 0.7. Furthermore, to confirm convergent validity, i.e., the degree to which measures of constructs are related to each other, the mean value of the squared loadings of all indicators associated with the construct should be higher than 0.5. This average variance extracted (AVE) confirms that each construct accounts for 50% of the indicator’s variance. Lastly, discriminant validity assesses stronger affiliations of a refletive
construct with its own indicators in comparison with other constructs, following the Fornell-Larcker criterion that the square root of AVE must be greater than the correlation of the specific construct with all other constructs of the structural model.
With regard to the structural model, a multicollinearity test was firstly measured to evaluate the correlation between the independent variables followed by the bootstrapping sampling method to conclude about the significance and effects of the hypothesis.
Collinearity was examined through the inner variance inflation factors (VIF), which measures how much the variance of the estimated constructs is increased due to multicollinearity issues, being the accepted threshold values bellow 5. Estimated path coefficients, also known as standardized regression weights, represent the relationship between variables with its value ranging between -1 and 1, representative of negative or positive relations. Regarding significance, bootstrapping of 5000 samples was used to calculate empirical t values, which are considered to be significant above 1.96 at a 95% confident level.
Data Analysis and Results
Out of the 165 participants, 52 confirmed that they use or have used Fintech services in the last year, corresponding to an adoption rate of 31%. Such a high rate clearly shows the increasingly fast spread of this technology, considering the early years of its inception. Adopters use in average two Fintech services being the most common reason for its usage simplicity and practicality. Others explained their interest in such technology with the possibility to access different products and services or because there is a better online experience and functionality. As for frequency of use almost half of the sample stated to use the technology once every month, and one fourth of it uses
once a week. Finally, money transfer/payments service is the category that the respondents mostly use the technology for, followed by savings and investments.
On the contrary, 63% non-users of Fintech were not aware of the existence of such technology, 22% didn’t have a need to use the service while 7% don’t understand how they work.
On a first run through the estimation of the model, two indicators of financial literacy (FL3 and FL4) showed poor outer loadings and AVE due to a weak relation with their respective latent variable, thus, these were disregarded in the final model, contributing to better results, as can be observed:
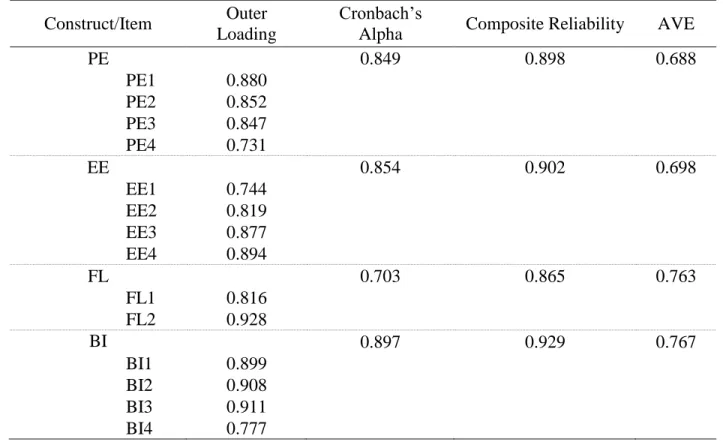
The estimation by SmartPLS shows in table 2 that Cronbach’s alfa and Composite Reliability coefficients are above 0.70 therefore, overall reliability of the constructs is validated.
Table 2 - Statistical analysis of the measurement model Source: SmartPLS
Construct/Item Outer Loading
Cronbach’s
Alpha Composite Reliability AVE
PE 0.849 0.898 0.688 PE1 0.880 PE2 0.852 PE3 0.847 PE4 0.731 EE 0.854 0.902 0.698 EE1 0.744 EE2 0.819 EE3 0.877 EE4 0.894 FL 0.703 0.865 0.763 FL1 0.816 FL2 0.928 BI 0.897 0.929 0.767 BI1 0.899 BI2 0.908 BI3 0.911 BI4 0.777
Regarding indicator reliability, all item’s outer loadings present values higher than 0.7 thus confirming this requirement. It is also possible to infer good convergent validity as all AVE values in the table are higher than 0.5. Moreover, table 3 corroborates discriminant validity with the Fornell-Larcker criterion described above, showing that the square root of AVE (diagonal values) are higher that the latent variables correlation (non-diagonal values).
Table 3 - Discriminant Validity confirmation Source: SmartPLS
Fornell-Larcker Criterion
Construct BI EE FL PE
BI 0.876
FL 0.607 0.608 0.874
PE 0.674 0.689 0.491 0.83
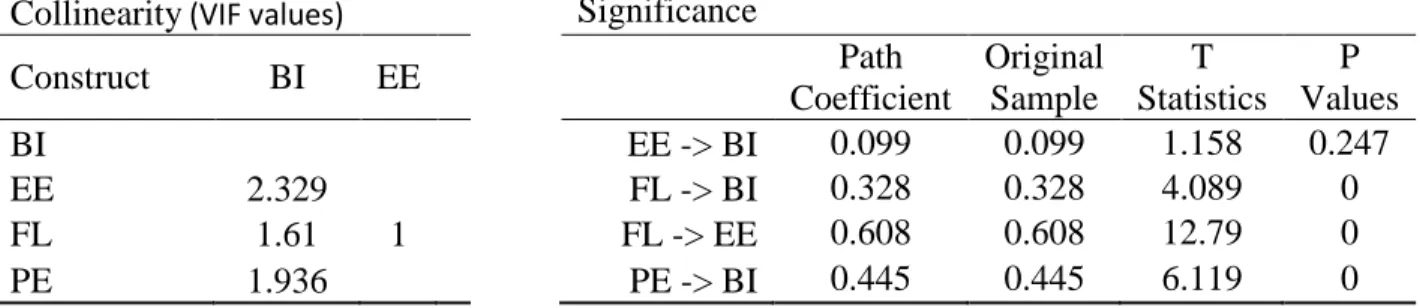
Concerning the analysis to the structural model, all VIF values observed in table X are below 5, which represents no collinearity problems with the variables.
The bootstrapping method estimated the parameters’ significances by drawing random samples with replacement from the original sample. This method revealed that all path coefficients are higher than 0, therefore, all variables have a positive impact on the respective endogenous variable they have a relation with.
Table 4 and Table 5 - Correlation analysis and statistical significance of hypothesis Source: SmartPLS
Collinearity (VIF values) Significance
Construct BI EE Path Coefficient Original Sample T Statistics P Values BI EE -> BI 0.099 0.099 1.158 0.247 EE 2.329 FL -> BI 0.328 0.328 4.089 0 FL 1.61 1 FL -> EE 0.608 0.608 12.79 0 PE 1.936 PE -> BI 0.445 0.445 6.119 0
Of the significant variables (p-value < 0.05), performance expectancy is the primary driver of behavioral intention to adopt financial technology (β = 0.445), followed by financial literacy (β = 0.328). Only Effort Expectancy revealed to be, unexpectedly, non-significant, notwithstanding being strongly predicted by financial literacy (β = 0.608).
Moreover, as can be observed in figure X the established coefficient of determination (R2) inside the latent variables represent the amount of variance of the endogenous variables explained by all the exogenous constructs link to it. In one hand financial literacy explains 36.9% of the variance of effort expectancy while only showing a moderate prediction of 55.9% of the variance of behavioral intention to adopt financial technology.
A multi-group analysis (MGA) was performed to incorporate the moderator variable in this model by running the previous estimation for the subsamples of each education level. The differences between bachelor and master students can be observed in figure 4 and 5 and table 6 of the Appendix through the comparison of each PLS model for each category. Financial literacy impact on effort expectancy shows a significant difference (0.193, p value = 0,016) but is not considered to be a finding since EE was not considered significant in the general model. In short, MGA revealed that educational differences are not significant between millennials, regarding intention to use Fintech, despite showing a higher impact on behavioral intention of financial literacy for master students (as observed in the thicker arrow in the model).
Conclusion
This study aimed to assess the determinants of behavioral intention to adopt Fintech among millennials. It found that performance expectancy and financial literacy had a significant positive impact on behavioral intention to adopt Fintech, thus, confirming hypothesis H1, H3.1, while also confirming H3.2 with the significant impact of financial literacy on effort expectancy. However, the hypothesis H2 regarding the impact of effort expectancy, could not be confirmed.
One of the main objectives of this work project, in addition to validating the Unified Theory of Adoption and Use of Technology in another context, is to address and signalize the importance of financial literacy in this disrupting industry. Indeed, one perception of its own financial knowledge will critically impact the adoption of financial technologies. Along with studies of lack of financial literacy in today’s society mentioned above, this study tries to emphasize the relationship between knowledge and expected financial outcome, consequently impacting how customers embrace these type of innovations in daily economic transactions.
As a suggestion, this research implies the need for Fintech companies to instruct their customers and develop learning programs to stimulate demand for better and more advanced financial products, and in a similar way, to alert the millennial generation for the importance of financial knowledge in rational finance decisions. Concerning traditional banking, it’s imperative to have a new vision of financial markets, either by integrating their business model with Fintech companies to improve a specific segment or to develop a long term scenario plan to better prepare the organization for future generational uncertainties.
Despite the validation of key model characteristics of good predictability power, this study isn’t exempt of limitations. The observed instruments of the financial literacy variable infer one’s perception about own financial knowledge, therefore, a practical study where the sample is exposed to financial tests can further assess accurate financial knowledge. Additionally, the data combined the results of users and non-users of Fintech, instead of focusing on each group, due to the small size of observations collected, consequently, limiting the predictability of the non-parametric test used. As the respondents were mainly from my personal network, there is a risk of biased results since the sample is generally composed by master students within the age interval of 21 to 25 years old, not reflecting the entire millennial age range defined in the beginning of this paper. Regarding Likert scales in this type of research, respondents may avoid using extreme responses or may answer in a more favorable light of acceptable views therefore creating a tendency of inaccurate results. In addition to the suggested forthcoming studies with different statistical assumptions, future researchers can test the model in different contexts, such as multi-generational differences, or intra-generational differences with moderation variables like age, gender or work experience. One can also apply this theory for a specific financial technology or expand it to other industries that require specific knowledge.
Appendix
Figure 3 - UTAUT Model Source: ResearchGate
Table 5 - Indicators of the constructs used in the survey Source: Self-developed
Indicators:
Performance Expectancy
PE1 - Fintech services are useful to carry out my tasks
PE2 - Using Fintech services enables me to conduct tasks more quickly
PE3 - Using Fintech services would save me time for other activities I prefer doing PE4 - I think that using Fintech services would improve my performance
Effort Expectancy
EE1 - My interaction with Fintech services would be clear and understandable EE2 - It would be easy for me to become skillful at using Fintech services EE3 - Learning how to use financial technology is easy for me
EE4 - I would find Fintech services easy to use
Financial Literacy
FL 1 - I have basic or near to zero knowledge of key financial concepts FL 2 - I have the knowledge necessary to use Fintech services
FL 3 - I intend to learn more about personal finance in the future FL 4 - I make appropriate decisions about personal finance on my own
Behavioral Intention to Use
BI1 - I intend to continue using Fintech
BI2 - I predict I would use more Fintech in the next months BI3 - I plan to use Fintech in the next months
Figure 4 and 5 - PLS models for Bachelor and Master Students, accordingly. Source: SmartPLS
Table 6 Path coefficient and p-values of multi-group analysis between Bachelor and Master students Source: SmartPLS
Path Coefficients-difference p-Value(Master vs Bachelor)
EE -> BI 0.14 0.786
FL -> BI 0.056 0.625
FL -> EE 0.193 0.016
References
Atkiinson, A.; Messy, F. (2013). PROMOTING FINANCIAL INCLUSION THROUGH FINANCIAL EDUCATION.pdf. OECD Publishing, 34(34), 1–53.
Beck, T., Chen, T., Lin, C., & Song, F. M. (2016). Financial innovation: The bright and the dark sides. Journal of Banking and Finance, 72, 25–51.
Borsboom, D., G. J. Mellenberg, and J. van Heerden (2004). The Concept of Validity, Psychological Review, 111(4), 1061-1071.
Capgemini. 2016.: World FinTech Report 2017. Retrieved from:
https://www.capgemini.com/sites/default/files/en/2016/10/world_fintech_report_2017.pdf (accessed December 25, 2016)
Chen, L. (2016). From Fintech to Finlife: the case of Fintech Development in China. China Economic Journal, 9(3), 225–239.
Christiansen, M. H., Giuliano, P., Jel, D., Ernst, T., & Forum, S. (2016). Review of Cultural Evolution: Society, Technology, Language, and Religion. Journal of Economic Literature, 54, 522–533.
Davis, F. D. (1989). Perceived Usefulness, Perceived Ease of Use, and User Acceptance of Information Technology. MIS Quarterly, 13(3), 319–340.
Fernandes, A. (2005). Knowledge , Technology Adoption and Financial Innovation. Business, (June).
Gefen, D., Rigdon, E. E., & Straub, D. (2011). An Update and Extension to SEM Guidelines for Administrative and Social Science Research. MIS Quarterly, 35(2), iii-A7.
Goldmansachs. 2016.:Millennials Coming of age. Retrieved from
http://www.goldmansachs.com/our-thinking/pages/millennials/ (accessed December 26, 2016)
Hair, J. F., Ringle, C. M., & Sarstedt, M. (2011). PLS-SEM: Indeed a Silver Bullet. The Journal of Marketing Theory and Practice, 19(2), 139–152.
Hair, J. F., Sarstedt, M., Ringle, C. M., & Mena, J. A. (2012). An assessment of the use of partial least squares structural equation modeling in marketing research. Journal of the Academy of Marketing Science, 40(3), 414–433.
Hilgert, M. A., Hogarth, J. M., & Beverly, S. G. (2003). Household Financial Management: The Connection between Knowledge and Behavior. Federal Reserve Bulletin, 89(7), 309–22. Retrieved from http://www.ucd.ie/t4cms/UCD Institute of Food and Health Research Roadmap March 10.pdf
Jöreskog, K., & Sörbom, D. (1982). Recent developments in structural equation modeling. Journal of Marketing Research, 19(4), 404–417.
Lancelot Miltgen, C., Popovič, A., & Oliveira, T. (2013). Determinants of end-user acceptance of biometrics: Integrating the “big 3” of technology acceptance with privacy context. Decision Support Systems, 56(1), 103–114.
Liao, Q., Shim, J. P., & Luo, X. (2004). Student acceptance of web-based learning environment: An empirical investigation of an undergraduate IS course. In Proceedings of the 10th Americas Conference on Information Systems (pp. 3092-3098).
and gender differences. Computers in Human Behavior, 37, 133-143.
Lusardi, A., & Mitchell, O. S. (2014). The Economic Importance of Financial Literacy: Theory and Evidence. Journal of Economic Literature, 52(1), 5–44.
Mcdaniel, L., Martin, R. D., & Maines, L. A. (2002). Quality : The Effects of Financial Expertise vs . Financial Literacy. The Accounting Review, 77(Tulving 1972), 139–167.
Morosan, C., & DeFranco, A. (2016). It’s about time: Revisiting UTAUT2 to examine consumers’ intentions to use NFC mobile payments in hotels. International Journal of Hospitality Management, 53, 17–29.
Morris, M. G. ., Hall, M., Davis, G. B. ., Davis, F. D. ., Walton, S. M., Venkatesh, V., … Davis, F. D. . (2003). User Acceptance of Information Technology: Toward a Unified. MIS Quarterly, 27(3), 425–478.
Oliveira, T., Thomas, M., Baptista, G., & Campos, F. (2016). Mobile payment: Understanding the determinants of customer adoption and intention to recommend the technology. Computers in Human Behavior, 61(2016), 404–414.
Paiella, M. (2016). Financial literacy and subjective expectations questions: A validation exercise. Research in Economics, 70(2), 360–374. http://doi.org/10.1016/j.rie.2015.11.004 Peter, J. P. and G. A. Churchill (1986). Relationships Among Research Design Choices and
Psychometric Properties of Rating Scales: A Meta Analysis, Journal of Marketing Research, 23(1), 1-10.
PwC, G. F. (2016). How FinTech is shaping Financial Services. https://www.pwc.se/sv/pdf-reports/blurred- lines-how- fintech-is-shaping-financial- services.pdf (accessed December
24, 2016)
Skan, J., Dickerson, J., & Gagliardi, L. (2016). Fintech and the evolving landscape : landing points for the industry. Accenture, 1–12. Retrieved from
www.fintechinnovationlablondon.co.uk/pdf/Fintech_Evolving_Landscape_2016.pdf Read Bain, Dec. 1937, “Technology and State Government”. American Sociological Review.
Vol. 2, No. 6 (p.860)
Spolaore, E., & Wacziarg, R. (2011). Long-Term Barriers to the International Diffusion of Innovations. NBER International Seminar on Macroeconomics (Vol. 8).
U.S. Census Bureau. 2016.: World Population by age and Sex (2015). Retrieved from: https://www.census.gov/idb/worldpopinfo.html
Venkatesh, V., Thong, J., & Xu, X. (2012). Consumer acceptance and user of information technology: Extending the unified theory of acceptance and use of technology. MIS Quarterly, 36(1), 157–178. http://doi.org/10.1111/j.1365-2729.2006.00163.x
Venkatesh, V., Thong, J. Y. L., & Xu, X. (2016). Unified theory of acceptance and use of technology: A synthesis and the road ahead. Journal of the Association for Informaiton Systems, 17(5), 328–376.
Workman, M. (2014). New media and the changing face of information technology use: The importance of task pursuit, social influence, and experience. Computers in Human Behavior, 31, 111-117.