II
ARE THERE SIGNALS OF A HOUSING BUBBLE? AN
EMPIRICAL ANALYSIS OF THE PORTUGUESE CASE
Márcia Filipa Martins Tavares
Dissertationsubmitted as partial requirement for the conferral of Master in Economics
Supervisor:
PhD. Vivaldo Manuel Pereira Mendes, Associate Professor, ISCTE Business School, Department of Economics
Co-supervisor:
PhD. Diana Elisabeta Aldea Mendes, Associate Professor, ISCTE Business School, Department of Quantitative Methods for Business and Economics
III
ARE THERE SIGNALS OF A HOUSING BUBBLE? AN
EMPIRICAL ANALYSIS OF THE PORTUGUESE CASE
IV
Acknowledgements
The presented dissertation could not be completed without the motivation and inspiration of astonishing people who stood alongside with me during the journey of my academic path.
To my magnificent parents and brother, and to all my friends a huge thank you for the unconditional love, encouragement and friendship, and for the wise endless words of confidence expressed in the dark times of this journey. Thank you for always believing in me.
To my supervisor and co-supervisor, Vivaldo Mendes and Diana Mendes, I express my gratitude for the guidance, availability and patience in supporting myself, which were indispensable for the development of this master’s final work. And thank you for all the help and the immense knowledge transmitted throughout this process which has been of great learning, both at academic and personal levels. It has been an enormous pleasure to work with you.
To one and all who have contributed, directly or indirectly, to the completion of this chapter in my academic journey I dedicate this dissertation with my sincere gratitude for their influence.
V
Abstract
Is there a housing bubble emerging in the Portuguese real estate market? Since similar questions have been raised among the popular press, and among economists and policymakers, the housing market in Portugal has becoming an extremely interesting topic to be investigated within the OECD area.
The foremost purpose of this dissertation is to evaluate whether there are bubble tendencies in the Portuguese housing market, or if the (apparently) continuous house price growth can be explained by economic fundamental factors. The first point we would like to stress is that, for the period where there is consistent and comparable data related to house prices in the OECD countries (since 1988), Portugal displays the smallest rate of growth of real house prices. Secondly, the multiple linear regression model suggests an unexpected finding: the hypothesis of an emerging housing bubble in the Portuguese market can be easily rejected.
As a matter of fact, and regardless of people's beliefs, there is no sound of an economic evidence of a boom-bust in real house prices. Portugal is not in an alarming situation and so we can throw away the idea that the country is facing a speculative momentum. Surprisingly, the increase in housing prices that have been distressing the whole Portuguese society seems to be nothing else than a typical price adjustment, which results from the large previous downward fall that house prices suffered in the aftermath of the recent sovereign debt crisis, which so dramatically affected the whole Portuguese economy.
Keywords: Housing Bubbles, Housing Market, Real Estate Prices, Macroeconomic
VI
Resumo
Existe, de facto, uma bolha imobiliária a desenvolver-se no mercado Português? Desde que questões similares têm surgido entre a comunicação social, economistas e políticos, o mercado imobiliário em Portugal tornou-se num tópico extremamente interessante de ser analisado na área da OECD.
O propósito principal desta dissertação é o de analisar se existem tendências de uma bolha no mercado imobiliário em Portugal, ou se (aparentemente) a subida contínua do preço das casas pode ser explicada for fatores económicos fundamentais. O primeiro ponto que se pretende enfatizar é que, para o período em que existem dados consistentes e comparáveis relacionados com o preço das casas para países da OECD (desde 1988), Portugal apresenta a menor taxa de crescimento do preço real das casas. Em segundo lugar, o modelo de regressão linear múltipla sugere uma descoberta inesperada: a hipótese de uma bolha imobiliária emergente no mercado português é facilmente rejeitada.
Na verdade, e independentemente da convicção das pessoas, não existe qualquer evidência de um ciclo explosivo no preço real das casas. Portugal não se encontra numa situação alarmante e podemos, portanto, suprimir a ideia de que o país está a enfrentar um momento especulativo. Surpreendentemente, o aumento do preço das casas que tem vindo a perturbar toda a sociedade não é nada mais do que um típico ajustamento de preços, resultante da grande descida do preço das casas durante a recente crise económica, que afetou drasticamente toda a economia portuguesa.
Palavras-Chave: Bolha Imobiliária, Mercado de Habitação, Preços Imobiliários, Fatores
VII
Table of Contents
Acknowledgements IV
Abstract V
Resumo VI
1. Introduction and Problem Statement 1
2. A Literature Survey 8
3. What is a Real Estate Bubble and How Can It Be Detected? 11
3.1. Importance of Housing in Economics 11
3.2. When Prices Go Over the Roof: Introduction to a Housing Bubble 13
3.2.1. Theoretical Representation of Rational Bubbles 20
3.3. The Role of Easy Credit as an Early Warning Indicator 25
3.4. Macro-Prudential Regulatory Instruments Against Real Estate Bubbles 29
4. Analytical Framework and Discussion of Results 34
4.1. Data Description 34
4.2. Comparative Analysis of the Evolution of Price-to-Rent and Price-to-Income Ratios 43
4.3. Robustness Tests 47
4.3.1. Descriptive Statistics and Correlation for The Set of Data 47
4.3.2. Unit Root, Granger Causality and Cointegration Tests 49
4.3.3. Final Model Estimation Output 51
4.3.4. Serial Correlation, Heteroscedasticity and Normality Tests 54
4.3.5. Forecasting 55
5. Concluding Remarks 58
6. References 60
VIII
List of Figures
Figure 1.1. Factors Determining House Prices 1
Figure 1.2. The Evolution of Real House Prices in Portugal 4
Figure 4.1. The Evolution of Real House Prices in OECD Countries (1988=100) 36
Figure 4.2. The Evolution of Nominal House Prices in OECD Countries (1988=100) 37
Figure 4.3. Consumer Confidence Evolution in OECD Countries (1988=100) 39
Figure 4.4. Consumer Confidence Evolution in Portugal 39
Figure 4.5. The Evolution of the Time Series of the Final Multiple Regression Model (Portugal)
41
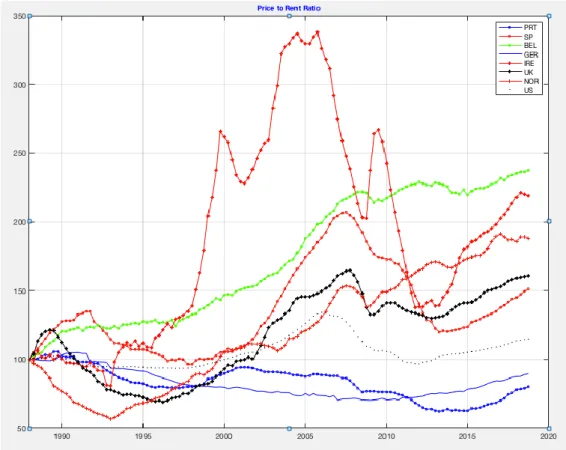
Figure 4.6. Price-to-Rent Ratio (PRR) Evolution in OECD Countries (1988=100) 44
Figure 4.7. Price-to-Income Ratio (PIR) Evolution in OECD Countries (1988=100) 46
Figure 4.8. Comparison of Real and Forecasted Values of the Dependent Variable (Portugal)
56
List of Tables
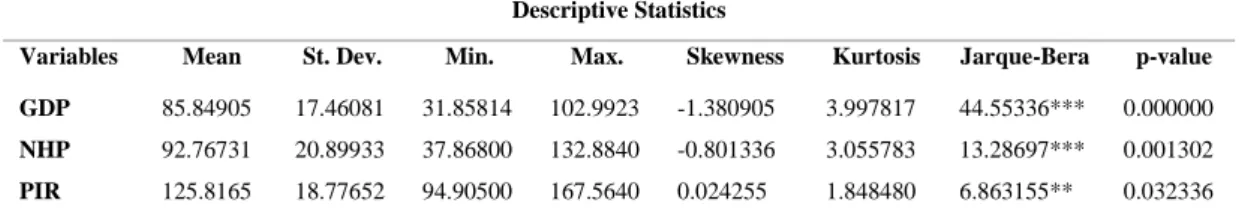
Table 4.1. Descriptive Statistics for All the Variables 48
Table 4.2. Correlation Matrix on Nominal House Prices and The Explanatory Variables
48
Table 4.3. Augmented Dickey-Fuller Test Statistics 50
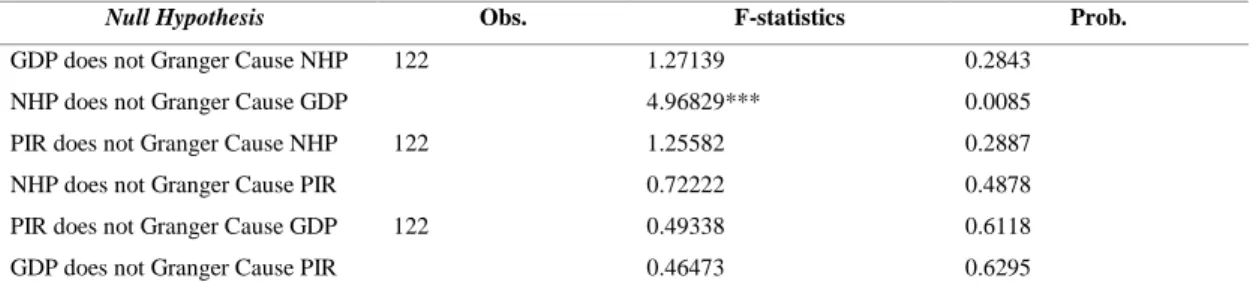
Table 4.4. The Granger Causality Test 51
Table 4.5. The Results of the Regression Model Parameter Estimates 53
Table 4.6. Breusch-Godfrey Serial Correlation LM Test 54
IX
Countries and Abbreviations
Countries
BEL Belgium GER Germany IRE Ireland NOR Norway PRT Portugal SP Spain UK United Kingdom US United StatesAbbreviations
ADF Augmented Dickey-Fuller
APEMIP Associação Profissional de Empresas de Mediação Imobiliária
BdP Banco de Portugal
BTL Buy-to-Let
CLTV Combined Loan-to-Value
DSR Debt Service Ratio
DSTI Debt Service-to-Income
DTI Debt-to-Income
ECB European Central Bank
ESRB European Systemic Risk Board
EU European Union
GDP Gross Domestic Product IMF International Monetary Fund LPS Lender Processing Services
LTI Loan-to-Income
LTV Loan-to-Value
MaPP Macro-Prudential Policies
NHP Nominal House Price
NHR Non-Habitual Resident
NPL Non-Performing Loans
ODSR Originating Debt Service Ratio
OECD Organization for Economic Co-operation and Development OLTV Originating Loan-to-Value
PDI Personal Disposable Income PIR Price-to-Income Ratio
REE Rational Expectations Equilibrium R&D Research and Development
1
1. Introduction and Problem Statement
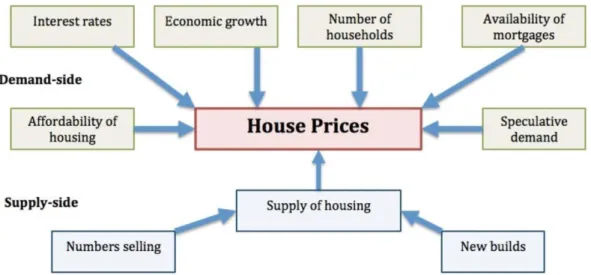
Real estate markets symbolize an integral part of today’s economy which is inevitably related to other areas and it requires the intervention of various agents from the economic activity. Housing can be considered one of the foremost assets of households’ budgets. The state of the economy, interest rates, households’ disposable income and changes in the size of the population influences the housing market. And besides these demand-side factors, house prices are also determined by the supply-side (see Figure 1.1.).
Figure 1.1. Factors Determining House Prices
Source: www.economicshelp.org
Residential real estate is a key factor of vulnerability in advanced and emerging economies likewise, such that volatility in can have far reaching consequences. As most of dwellings are purchased resorting to a mortgage, real estate has a major impact on the banking sector. Real estate assets are considered a medium-to-long term investment and so, they are affected by the outsized macroeconomic changes. Housing prices affect private consumption; hence the housing market and the consumer spending are closely associated. An increase in housing wealth will influence the expected lifetime income, leading consumption and housing prices to increase. In fact, the macroeconomic performance and financial stability are interrelated due to the many roles housing plays
2 for households, firms and financial intermediates, as a consumption good, long-term investment, store of wealth, and collateral for lending.
Furthermore, Central Banks and other international organizations, in the aftermath of the sovereign debt crisis, become concerned about the role of domestic housing markets in financial stability and the real economy (e.g., the IMF established the Global Housing Watch and the Federal Reserve Bank of Dallas created the International House Price Database)1. It is important to explore the boom-bust of prices by considering the linkages between real estate markets, financial markets and the economy. In fact, the macroeconomic development of a country depends on the real estate development. Since the Subprime crisis in the US, the European banking crisis and the third Portuguese rescue from Troika, the housing market gained a special attention and several studies have been developed around this theme. Researches in this field show that global real estate markets do not only depend on worldwide economic cycles, but a mix of global and local economic factors as affirmed by Goetzmann and Rouwenhorst (1999). Recent events prove this: at the begin, the Great Recession impacted the entire American economy; it can be confirmed today that such a market distress was felt by nearly every country in the world. The authors Goetzmann and Watcher (2001) have documented that “The recent US crash was a global crash”. Further, Janssen (2010) argues that when a developed country faces a housing bust, economic activity in other countries experience the same downturn and consequences as well via international transmission effects.
The truth is that since the 2007-08 financial crisis, with the continuous rise in housing prices, the potential burning of real estate markets is attaining attention from regulatory sectors, industry and research alike. Decision-makers are feeling apprehensive regarding the real estate business. In fact, real estate prices are once again growing strongly worldwide. This steady increase brought the risk of a real estate bubble back into the notoriety for market agents. This topic has been widely debated, both nationally and internationally, and Portugal is nowadays a country within more and more warnings about a price bubble.
1 The Global Housing Watch is a current database of house prices and ratios of valuation (house price-to-rent and house price-to-income ratios) when assessing housing markets. The IMF launched this programme to overwhelm the so-called “benign neglect” era – policymakers and regulators should consider the extremely negative effects a burst in house prices could have. Likewise, the Bank of Dallas established the International House Price Database which comprises quarterly data since 1975 regarding house prices and personal disposable income (PDI) for countries worldwide.
3 In the beginning of this study, a brief cross-country analysis was made in a way to observe and analyse the behaviour of some selected variables (such real gross domestic product, short- and long-term interest rates, real house price index, price-to-rent and price-to-income ratios, consumer confidence index, unemployment rate), then allowing to pick up the most relevant ones to include in the final statistical analysis. The concerning regarding the Portuguese housing market has been particularly strong over the last decades because recent house price growth has been rampant. Nationally, the largest cities have experienced exceptionally high house prices growth. The motivation of this empirical study is that a new problem may be emerging because of the exponential increase verified in house prices, mainly in the Portuguese market, as this is nurturing the fears of a repeat real estate bubble which were at the origin of the tremendous Global Financial crisis.
Portugal is a country that belongs to the European Union, the Euro Zone and the Schengen area, with a steady political and social environment, a strategic location with access to key markets, highly skilled labour force, competitive costs, and an excellent quality of life that offers an auspicious investment climate. Since 2009, Portugal introduced a range of tax benefits for both EU and non-EU citizens which turned the real estate market more financial lucrative. The main purpose was to encourage direct foreign investment in a way of recovering the economy from the distress after the Global Financial crisis. Since then, investors are coming from all over the world, being the Chinese culture the most significant one. According to the World Bank Group Doing Business 2018, Portugal is seen as a stable place to do business and it is ranked 29th out of 190. Hence, Lisbon is fast becoming an innovative and tech start-up hub. Noticeably, Portugal is being established as an eye-catching destination for entrepreneurs, investors and foreign research and in progress companies and nowadays is known as one of the leading EU countries for R&D and fresh technologies. The Portuguese Non-Habitual Resident (NHR) tax regime, granted for a 10 year-period, seeks to attract and retain high qualified expatriates and industries to perform high value-added activities.2 Throughout the tax regime, non-habitual residents can benefit from a flat 20% income tax rate. Further, the NHR regime is beneficial for retirees in a way they will receive their foreign income completely tax-free (including pensions). For example, British pensions can be
2Residence means having a habitual residence in Portugal or living at least 183 (consecutive or not) in any period of 12 months starting or ending in the relevant tax year.
4 paid gross, that is, without deducting both UK and Portuguese taxes. Also, the Portuguese government’s Golden Visa, which is only eligible for foreign investors from non-EU countries, helped Portugal becoming more and more popular for potential stakeholders.
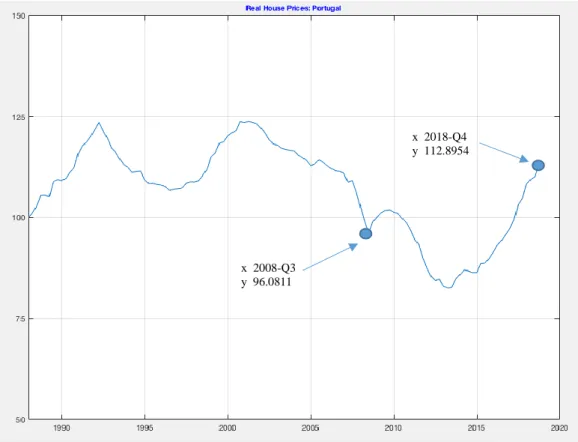
As documented by economic researches, real house prices crashed in the wake of the financial crisis in 2007-08, but from 2009 on, Portugal experienced a period of retrieval (see Figure 1.2.). After the Troika intervention, a new scenario emerged indeed: positive economic conditions encouraged credit growth and demand to go up. It was intended at restoring confidence and enabling the safeguarding of financial stability in the Portuguese economy. At that time, positive economic conditions surfaced, and housing prices suffered an upward pressure. Besides the upturn of real house prices, Portugal did not witness a property boom and bust.
Figure 1.2. The Evolution of Real House Prices in Portugal (1988=100)3
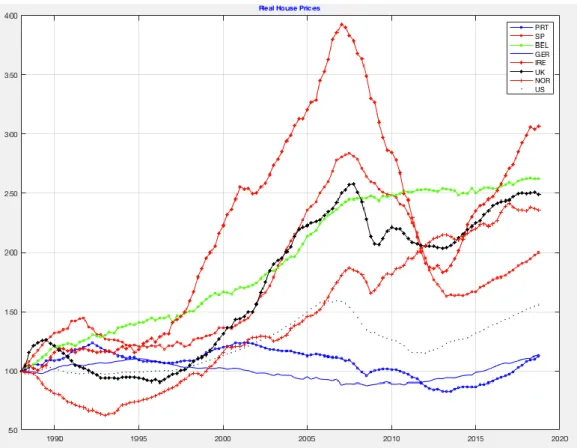
3 Note that when Portugal is compared with other OECD countries, the evolution of real house prices exhibits a “modest” behaviour. By analysing Figure 4.1., it is evident that there is no evidence of a housing bubble in Portugal.
x 2008-Q3 y 96.0811
x 2018-Q4 y 112.8954
5 This recovery has had a noteworthy impact for most of the households, as housing is of considerable importance for households generating a stream of utility for them and it constitutes the biggest asset of a household’s portfolio. The speculative and quasi-irrational prices in Portugal were becoming progressively evident because of an excess of optimism on the part of property owners and, in fact, several experts began drawing attention to the possibility of the existence of a real estate bubble. Surprisingly, the Portuguese market is characterised by one of the lowest real house prices when compared with other OECD countries. Bankers defined the steeply rising in house prices as a normal consequence of the market correcting itself following years of minimal investment. Besides, it is difficult to affirm whether a housing bubble exists or not, as the housing market is extremely complex and driven by economic conditions, as well as expectations and speculations in numerous of variables.
Based on this, a problem statement is defined: Are there signals pointing towards a housing boom and burst in the Portuguese real estate market? If not, what, in fact, supports the exponential increase in the Portuguese real house prices? Can the excessive growth in house prices in Portugal be atypical, or it can be explained by underlying fundamental economic factors? A further analysis and a better understanding of the linkage between the real estate market and the macroeconomy is of great theoretical and practical significance and thus, the major motivation of this study. It is essential to comprehend the reasons behind the property prices mispricing, at a macroeconomic horizon, and which factors deviate real house prices from their fundamental valuation.
Moreover, and as commonly believed, in periods of exponential growth of demand and a limited supply, housing prices will consequently rise, as well as rents and the risk of homelessness. Our main findings suggest that besides the suddenly rise in housing prices during the post-crisis period, mainly since 2016, policymakers and researchers recognize that in the Portuguese economy there is, in fact, a “hot demand”, but they throwaway the idea that Portugal is facing a speculative momentum. Portugal is nowadays in a manner of economic growth and urbanization. The euphoric rise in house prices comes from an increase in the demand-side that is not attended by a similar increase in the supply-side. In fact, the economic growth recovery, the attractiveness in the international market and the subsequent increase in tourism and immigration, the shortage of alternative investments, all of this combined with a developed and flexible mortgage market would be enough to drive housing prices up. Further, and according to the popular press, the assets in real estate market are few and those that already exist are not affordable
6 for most of the Portuguese families. As a matter of fact, the gap between demand and supply in the Portuguese market will continue to exist, until supply readjusts.
Although, the dominant opinion among Portuguese economists and policymakers is that there aren’t macroeconomic indicators that point towards the existence of a real estate bubble in Portugal; and they claim that the incredible increase in house prices is due to the dynamics of the fundamental factors. A Bloomberg Economics research, “These Are the Countries Most at Risk of Housing Bubbles” stated that Portugal is not in an alarming situation, although nominal house prices will remain high. And by analyzing other macroeconomic variables, such gross domestic product and house price-income ratio, the conclusion remains the same: the Portuguese market is not among the most disquieting regions in the case of a real estate bubble. Further, Kholodilin and Michelsen (2018) analyse the signs of a new housing bubble in many OECD countries by using a statistical test methodology which includes information on the price-to-rent ratio from the OECD database on housing prices. Regarding the Portuguese economy, the main conclusion is that speculative bubbles in this country are relatively rare, although the results indicate a short-term housing price bubble since 2016.
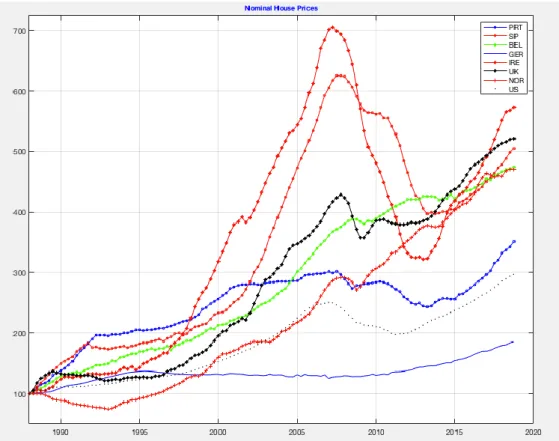
Unexpectedly, the idea of a housing bubble in Portugal is left behind. The examined macroeconomic fundamental factors (gross domestic product and price-to-income ratio) sustain the exponential increase in Portuguese’s nominal house price level over the years. The model proposed in this empirical work is intended according to the best practices in econometric applications.4
Even though, this empirical study faced some shortcomings. Short-term and long-term interest rates were supposed to be included in the final regression model, as these macroeconomic variables are crucial to investigate real estate developments. These variables have the power to reflect a household’s capability to purchase residential property and can significantly impact the cost of financing and mortgage rates, consequently affecting demand and supply in the housing market.
First and foremost, the involved spreads in the long-term interest rates refer to public debt spreads and do not reflect the mortgage credit spreads, which were the relevant ones for this analysis. Moreover, during the sovereign debt crisis, public debt ratios increased substantially in most EU countries, attaining historically high levels. According to a study carried by Amador et al. (2016), public debt unsustainability
7 widespread across the Euro Area, but it was particularly significant in countries such as Portugal. Further, historical evidence suggests that the mortgage credit spreads did not reach so high levels which, in fact, turns out the long-term interest rates time series in a skewed series with values that does not correspond to the real values practiced in real estate markets. In the late of the 80s, house prices increased abruptly because financial institutions initiated a war created by the easing in mortgage credit. Banks provided credit to all households, without even consider how risky they could be. As a matter of fact, this lessness of the credit standards distorted the effect of long-term interest rates in the Portuguese economy. Second, the challenge regarding the short-term interest rates was due to the absence of the spread term in this time series. Short-term interest rates were decreasing drastically until the Global Financial crisis and housing prices accompanied this downward fall. In the aftermath of the crisis, the rates exponentially increased, as well as house prices. In fact, interest rates suffered such a high rise because of the non-presence of mortgage credit spreads. For that reasons, interest rates were completely excluded from this empirical analysis. Unfortunately, it was not possible to gather a reliable database of the historical average of mortgage credit spreads. And it would not be trustworthy to include in the statistical investigation time series that does not correctly correspond to the real value of the interest rates within the mortgage credit spreads. The literature proposes that, both short- and long-term interest rates, and consumer confidence index should influence the dynamics of house prices. Although, these variables appear with a non-linear relationship which means that they are not statistically significant and do not influence nominal house prices in Portugal.
The outline of this dissertation is as follows: Section 2 briefly reviews the current literature regarding real estate markets and macroeconomic determinants that can lead to an abnormal behaviour of housing prices. Section 3 describes the importance of the real estate market developments in the economy; explains housing bubbles and the role of macro-prudential regulatory tools against such bubbles. Section 4 describes the selected data for the estimation of the multiple linear regression model – mainly, nominal house prices, gross domestic product and price-to-income ratio since 1988 first quarter up to 2018 last quarter; even more, the detail of the methodology used as well as the main econometric results are exhibited. Lastly, Section 5 presents the final remarks.
8
2. A Literature Survey
Housing is one of the most important markets in the industrialized economies and a source of guarantee for bank loans. As a manner of fact, banks and other financial institutions invest worryingly in residential real estate markets. Significant efforts are made to measure the level and volatility of housing values, building permits, housing starts and housing inventories (Carrillo, 2011). Further, Leung (2004) and Davis and Heathcote (2001), highlight the importance of the real estate sector. Their main findings are the following: (i) housing constitutes a substantial share of households’ expenditure and total wealth; (ii) the annual market value of property investment is larger than that for business capital investment; (iii) Housing is not just “another” consumption good, and so, changes in housing prices would imply significant household wealth effects; (iv) the market value of residential property stock is approximately equal to the average GDP.
In a brief literature review, it is evident two main strands followed by researchers: the ones that investigates the determinants of housing prices and, second, the ones that make a bridge connection between asset prices, macroeconomic developments, and economic and regulatory policies. Kennedy and Andersen (1994) explore the interaction between household saving and the housing market, noting that saving behaviours as well as the misperceptions about the future clearly have an important role in the determination of house prices. Englund and Ioannides (1997) relate the dynamics of housing prices in fifteen OECD countries and they conclude that GDP growth and interest rates exhibit a significant power. Other authors are proponents that housing prices movements not only affect the business cycle dynamics but also the financial system. Hence, Central Banks’ main goal passes through understanding this behaviour to maintain prices and financial stability. From a policy perspective, since almost all house purchases involve external financing, the cost of mortgage credit and the conditions are also noteworthy for house price dynamics. Tsatsaronis and Zhu (2004) conclude in their research that the dominance of inflation and nominal interest rates in real house prices are extraordinary. Lecat and Mésonnier (2005) research is about the relationship between house prices, financial variables and lending conditions. After an econometric analysis, the authors may conclude that short- and long-term interest rates and credit rationing impact the developments in the housing market.
9 Concerning the relationship between monetary policy and asset price oscillations a vast number of empirical studies has been developed in recent years, most of them under the label of boom-bust dynamics. Bordo and Jeanne (2002) conduct a study based on the relation between asset price movements and the potential cases for proactive and reactive monetary policy, considering that asset price reversals can have serious implications on real output. By the end of the research, they conclude that asset price booms and busts can be very costly in terms of declining output. Likewise, Borio and Lowe (2002) claim that a fast credit growth merged with an increase in asset prices and a low inflation environment leads to a period of financial instability. Detken and Smets (2004) analyse the development of monetary policy under asset price booms gathering data of 38 booms since the 1970s for 18 OECD countries. They split the sample of boom episodes into high- and low-cost booms, depending on the relative post-boom growth performance. Similarly, Detken and Alessi (2009) look at monetary policy developments and they predict high-cost asset price booms5 for 18 OECD countries since the 1970s, concluding that is possible to identify early warning indicators for individual countries. Jaeger and Schuknecht (2007) emphasis the behaviour of fiscal policy during boom-bust phases in asset prices and find out that fiscal balances tend to recover during boom phases and to deteriorate in busts. That is, the response of fiscal revenue to asset price cycles leads to public expenditure in booms and public debt in busts. The finding suggests the adoption of fiscal policy rules that assure a medium-term orientation while leaving adequate short-term fiscal flexibility. Martin, Schuknecht and Vansteenkiste (2007) analyse boom-bust episodes in asset prices in industrialized countries, claiming that financial variables explain the emergence of such episodes and have a significant power for the role of exchange rate in adjustment. Finally, the major findings of these studies are coherent with the recent study of Reinhard and Rogoff (2008), where the authors offer a broadly panoramic analysis of historical financial crises.
Other researches analyse housing prices along with equity prices to examine the question of whether the underlying credit growth result in booms and busts. According to the econometric analysis of Borio and McGuire (2004), equity price peaks tend to be followed by housing price peaks already. Further, interest rates fluctuations appear to influence real estate price dynamics, which underlines the role of monetary policy (also
5 The authors define a high-cost boom as “(…) a boom that is followed by a three-year period, in which overall real GDP growth was at least three percentage points lower than potential growth”.
10 see e.g. Detken and Smets (2004)). Gerdesmeier, Reimers and Roffia (2009) evaluate the features of money and credit indicators for detecting asset price busts, by constructing an asset price composite indicator which is house and stock market-based. The empirical analysis is based on a pooled probit-type approach to predict the best indicators which help to forecast asset price misalignments. Hence, the statistical tests show that credit aggregates, nominal long-term interest rates and investment, together with house or stock price movements, prove to be the best indicators when assessing financial crises. Moreover, it is important for Central Banks to have a deep insight regarding early warning indicators to assess financial imbalances and large asset price dynamics. Dreger and Kholodilin (2013) conclude that early warning indicators are vital tools to be used by policymakers in their attempts to detect house price bubbles and weaken their disturbing effects on the world economy. Besides, there are some studies that investigate the effects of liquidity spillovers under asset price boom-bust cycles. Adalid and Detken (2007) show empirical evidence that liquidity shocks are a driving factor for housing prices during boom episodes. In fact, during the boom periods the development of real estate prices and money growth shocks may explain the depth of post-boom downturns. Similarly, Greiber and Setzer (2007) as well as Belke, Orth and Setzer (2008) find in their study that liquidity drives housing market progresses. The evidence is that not only do real estate prices influence monetary developments but also the inverted relationship is relevant as well – the so-called “asset inflation channel”.6 In principle, liquidity growth is seem as a suitable indicator of house price inflation.
Nevertheless, Carstensen et al. (2009) study the reaction of real house prices to a monetary policy shock. To evaluate the impact of housing and mortgage market heterogeneity across countries, they divide their panel into two distinctive groups: a strong reaction group and a weak reaction group. Their main findings suggest that macroeconomic variables co-move with housing prices after a monetary policy shock. For countries that belong to the strong reaction group, the reaction of macroeconomic variables is more noticeable than for countries of the weak reaction group (the group to which Portugal belongs to).
6 As stated by Greiber and Setzer (2007), “house prices were more sensitive to an increase in aggregate demand caused by monetary expansion than consumer prices.” That is, an expansive monetary policy which provides markets with abundant liquidity may influence house prices to increase.
11 In fact, the real estate market is influenced by a wide range of factors, and so, its evolution through time must be examined from a macroeconomic perspective. A proper appraisal of the real estate sector is a foremost step for a suitable decision making.
3. What is a Real Estate Bubble and How Can It Be Detected?
Real estate prices growth is evident in emerging markets and from the perspective of financial institutions and policymakers there is a doubt of the so called “Bubble or Correction?”. It is often tough to define whether there exists a real estate bubble in the market until it eventually burst. However, there are some economic indicators and methods that may suggest symptoms of a bubble.
This chapter attempts to introduce the general notion of the term “bubble” within a real estate market and explains the commonly and lately indicators and methodologies used to detect it. A brief theoretical representation of rational bubbles is lastly explained.
3.1. Importance of Housing in Economics
The aspects of housing markets are different from most other markets (stock markets, for example), hence there are key features of housing markets that must be highlighted: the heterogeneity, once different properties have different characteristics and prices, and even for identical properties, the location will differ which leads houses to be priced differently; the purchase of such asset as housing evolves high transaction costs and a low turnover, which turns the assessment of price developments a difficult task; the conditions of sale easily fluctuate because prices mostly result from consensual negotiations within agreements on the price; the supply is considered plentiful rigid, as a result of shortage of buildable land and, even if land is available, the time needed to finish construction, obtain financing, and the time needed to assure building permits, leads the supply to be lagged; the wide variety of financing conditions which differ internationally and depends on the supervisory and regulatory framework for housing finance; last but not least, the taxation of, and financial incentives for homeownership can strongly affect settings in housing markets.
First and foremost, it is essential to define and understand the linkages between the real estate market and the macroeconomic sector. The main concern behind modelling
12 housing prices derives from the impact and severe consequences such price movements may have on the society and on the worldwide economy, and from the key evidence that a house fulfils the individuals’ basic needs (Lu, 2016) and it represent one of the fundamentals of today’s society. In fact, the housing sector contributes to the aggregate demand throughout residential investments. Private and public constructions comprise an essential portion of GDP in almost every country. This characteristic of universality gives the real estate sector a function of development indicator of a country or region.
The key point is that housing works as a multiplier driven in the economy. Housing transactions stimulate complementary industries (construction and furniture enterprises, real estate agencies and bankers). Capozza et al. (2002), for example, argued that lower construction costs have a significant role in dampening cycles. As a manner of fact, new construction is a market’s response of the exponential increase of house prices. Moreover, owning a house means higher wealth, confidence and security for homeowners which leads to an increase in investments and income spending (NACCA, 2005). Housing prices substantially disturb private consumption through a housing wealth and a collateral effect (see Dreger and Reimers (2011)); and most of the consumption expenditure is allocated to housing (see Englund et al. (2002)), which indicates that the housing market is closely linked with consumer spending. According to a study upon a panel of 14 countries and a panel of US states developed by Case, Quigley and Shiller (2001), the authors conclude that discrepancies in real estate prices have had an impact on homeowners’ consumption. In principle, the housing market seem to be more important than the stock market in prompting consumption (see also Rapach and Strauss (2006)). On the other hand, when house prices go down, houses may become worth less than their outstanding mortgage which becomes a major threat for homeowners leading to consumer spending reduction. As stated in the literature, outsized falls in asset prices could have substantial wealth effects on consumption. In line with Kahn (2008) and Chen (2012), a substantial portion of variation in housing prices can be explained by economic fundamental variables such as income, inflation, interest rates and construction costs. Although, there is also a collateral effect of house prices, once houses are most of the time used as a security for loans (see Muellbauer (2008)). In fact, when housing prices are rising, the value of the collateral is higher and higher. As of, the mortgage market turns out to be deregulated and it becomes easier and cheaper for households to borrow.
13 Last of all, housing has the strength for economic growth, employment and wealth but also has the capacity to dragging the economy down as noted in the beginning of 2007 with the Global Financial crisis and recession.
3.2. When Prices Go Over the Roof: Introduction to a Housing Bubble
The word bubble is nowadays widely used when designating the movements of housing prices but, in fact, a universally accepted method to identify boom-bust cycles does not exist. In 1988, a very well-known article regarding housing market inefficiency was published by Case and Shiller – “The Efficiency of the Market for Single Family Homes”. The article displays house price movements in four cities (Atlanta, Chicago, Dallas and San Francisco), noting that “(…) increases in prices over any year tending to be followed by increases in the subsequent year”, that is., house prices exhibited statistical significance in the short-run. Besides two decades of investigation on housing cycles, the authors never used the word bubble even once. In the succeeding year, in a Journal of
Economic Perspectives symposium on bubbles, the author Shiller started introducing the
word bubble while analysing the boom of housing prices in California. Later, Case and Shiller (2004) survey, in the article “Is There a Bubble in the Housing Market?”, the question of whether a boom in housing prices indicates a bubble and whether it is expected to burst or deflate. The authors conclude that the exponential increase in house prices does not explain the existence of a bubble at all, and that changes in fundamentals may explain much of the increase. When analysing the origin of the term “housing bubble”, the authors report the results of a Lexis-Nexis search for the usage of the term. Surprisingly, the usage of the term quickly died out after the stock market crash of 1987 and it just started being massively used in 2002. On the other hand, the term “housing boom” has appeared more often since the run-up in real estate prices in the 1980s. A brief explanation may be associated with the fact that the term “boom” designates that the upsurge in house prices may be a worthy opportunity for investors. Contrarily, the term “bubble” is usually used with a negative connotation, in a way that high price levels cannot be sustained.
Since the Great Depression, economists and policymakers are concerned about real estate bubbles, which were at the origin of the Subprime market collapse and is today considered as one of the deepest recessions ever and rapidly spread to other countries
14 worldwide. In fact, the period of the 1980s and the fall in house prices verified in many cities around the world in the early of the nineties are nowadays broadly looked back upon as an example, even a model, of a boom-bust cycle. The global house prices in the 2000s also taught us how housing market can work in the worst way. As declared by The
Economist, in July 16th, 2005, “The worldwide rise in house prices is the biggest bubble in history (…) never before have real house prices risen so fast, for so long, in so many countries. Historical evidence shows that economic instability has been associated with boom-bust cycles in the housing market (see Bordo and Jeanne (2002); Reinhart and Rogoff (2008); Crowe et al. (2011))7. And the emergence of boom and bust episodes is related to the existence of housing bubbles (Case and Shiller (2004); Mayer (2011); Shiller (2014)). Besides Case and Shiller (2004), also Zhou and Sornette (2008) analysed the quarterly average sales of new houses sold in 22 states in the US, in a way to define whether house prices have grown faster-than exponential, which the authors take as the diagnostic of a bubble. They found out that mostly Northeast and West states exhibit explicit signals of a fast-growing bubble. Shiller (2005) showed that institutional bankruptcies and worldwide recession are due to a rapid surge in real house prices. Kemme (2012) presented evidence that the Global Financial crisis in 2008 could have been predicted pursuing just the real house prices.
Furthermore, since the XVII century that bubbles have been reported, and as developed by the author Garber (1990), the three most famous ones were: The Dutch Tulip mania (1634-37), considered as the first recorded speculative bubble, the collapse of the Mississippi Company in France (1719-20) and the South Sea bubble in England (1720). Besides these cases of speculative price movements, other well-known market bubble episodes occurred after that: The Great Stock Market Crash of 1929 – the “Black Thursday” in which stock prices had climbed to seemingly irrational peaks; the massive increase of births following World War II and the consequently increase of real estate and stock prices in the late 1980s, for which Mankiw and Weil (1989) claimed that the entry of the Baby Boom Generation in the residential market was the major cause of the increase in real housing prices and demand; the more recent US Subprime market collapse of 2008, which Shiller (2008) calls for an aggressive response from the financial system, aimed to grab back households’ confidence to buy and sell homes and for greater
7 For example, Reinhart and Rogoff (2008) state “housing price cycles in the advanced economies (...) have long been known to play a central role in financial crises”
15 prosperity of the American market – basically, the housing investments epidemic were driven by an irrational agents’ enthusiasm that did not knew how to behave under speculative bubbles.
Nevertheless, fundamental questions have shown a lack of consensus among economists: What indeed causes the fluctuations in the price of speculative assets (properties, stocks, bonds, etc), especially real estate prices? How can one say that the real estate prices are in a bubble? Is there evidence to consider that a boost in house prices will be monitored by an analogous or even worse decline than the last time? Noticeably after the Great Recession, numerous of economic and financial researches develop and analyse this controversial issue. In fact, when asset prices may differ from their fundamental value and/ or when this misalignment persists over several periods of time, one may be in the presence of a bubble.
Even though there is not a clear and universal definition of real estate bubbles, we can argue that speculative bubbles refer to deviations of actual asset prices from their fundamental value because of investors’ expectations of near future gains, followed by a price correction.8 The price regime shifts in housing can be caused by various reasons, but often they are interrelated to speculation and high capital gain expectations.
Additionally, bubbles follow three distinctive phases. The first phase, known as the so-called “boom” period, refers to the former stage and starts when there is financial liberalization and lower lending standards. Such a behaviour from Central Banks and Governments lead to a credit expansion, consequently increasing real estate and stock prices. From a homebuyer perspective, during a housing price boom, homes which are normally considered expensive and unaffordable now are acceptable to be purchased because agents expect to be compensated in a near future by significant price increases. Furthermore, housing price booms cause pressure in the perceived risk associated with an investment in a home because first-time homebuyers believe that if they are not able to purchase now, they will not be capable to afford a home later. This phase of the bubble is characterised by an exponential rise in prices with the economy reaction positively. Until the point that the bubble inflates. However, prices cannot go up rapidly forever: the second phase starts, and it is characterised by the burst of the bubble, associated with a
8 See, for example, Hott and Monnin (2008) that argued that to test whether there is a housing bubble, one should address the gap between real housing price and its fundamental prices; Fundamentals represent the main determinants such as personal income, mortgage rates, housing costs and similar factors that affect housing prices.
16 drastic fall in demand and prices which could last over a long period. In principle, this phase is swifter than the first one and causes severe negative effects. Finally, in the third phase the firms and agents of the market that have borrowed to buy assets at such exuberant price, now go bankrupt. As emphasized in the case study of Pavlidis et al. (2016), empirical evidence shows that house prices and house-price-to-fundamental ratios became explosive in the US and Ireland in the first phase, between the mid-1990s and the early 2000s. The second phase, in the first half of the 2000s, is depicted by a widespread propagation and synchronized episodes of exuberance across diverse housing markets. In the third and final phase, house prices suffered a non-sustainable run-up. The previous episode of global exuberance burst in a short-period of time, before the economic contraction of the 2008-09 global recession. Researches claim that the boom in house prices that originated in the US and propagated to international housing markets was driven by ripple effects from the drop-in world interest rates experienced during the 2000s and housing bubbles (see Case and Shiller (2004)).9
Most of the time, the last phase is followed by banking crises that can have major implications for the overall stability of the economy and can last for a long-period.10 An example is the recent case of Spain in the early 2010s, where the housing bubble bursts and the consequences were felt for years on many macroeconomic indicators. Besides, historical economic episodes exhibit that the sharp increase in house prices is not itself conclusive of a bubble. It is relevant to also consider changes in fundamentals that may explain much of the increase.
By reviewing the literature, Stiglitz (1990) postulates that “if the reason that the price is high today is only because investors believe that the selling price will be high tomorrow – when “fundamental” factors do not seem to justify such a price – then a bubble exists”. It can be said that the mark of an asset bubble is irrational exuberance. In real estate market, when home prices begin rising at an appreciably high rate, optimistic investors and speculators jump in and bid the price up even more. Therefore, home prices are forced to further rise while not supported by market fundamentals and ending up at unsustainable levels. Case and Shiller (2004) defined the term bubble as “a situation in which excessive
9 Case and Shiller (2004) state that “Clearly, interest rates have fallen substantially and have contributed to the run-up in prices since 1995, at least in cities where, in our regressions, the interest rate variable was significant.”
10The authors Helbling and Terrones (2003) conclude that “Housing price busts were less frequent but lasted nearly twice as long and were associated with output losses that were twice as larger, reflecting greater effects on consumption and banking systems, which are typically heavily exposed to real estate.”
17 public expectations of future price increases cause prices to be temporarily elevated.” According to the authors, exponential rise in housing prices is sustained by the expectations of the public of future increases rather than fundamentals. For instance, Mayer (2011) presented two common definitions of bubble. One definition that better fits with some historical evidences of housing bubbles is that “bubbles represent extreme movements of house prices, during which housing prices rise rapidly, growing 20%, 30%, or even 40% per year for two or three years, and then falling just as rapidly in the following three years.” Secondly, he stated that bubbles can be detected when house prices are volatile over the cycle – if raising more than its fundamentals, then it represents the boom phase; if falling faster than its fundamentals, it suggests the bust phase. Hence, by this definition, the literature suggests housing bubbles are common. Detken and Smets (2004) and Adalid and Detken (2007) defined that an asset is in a boom stage when its market price is at least 10% above their estimated trend.11 Glaeser et al. (2008) present a model of housing bubbles with endogenous housing supply and conclude that regions with a more elastic housing supply will have fewer and shorter bubbles with smooth price increases. The data used by the authors reveal that the price climb in the 1980s occurred mostly in areas with inelastic supply. Mikhed and Zemcík (2007) combine price-rent ratios and panel data tests to construct a bubble indicator. The results show there were bubbles for the late 1980s and the early 1990s, as well as around the end of the 1990s. Nneji et al. (2013) focus their analysis on a long-run relationship between house prices and rents in the U.S. residential market from 1960 to 2009. Using a Markov regime switching model, they noticed evidence of an intrinsic bubble during the pre-1998 period only with individuals overreacting to changes in macroeconomic determinants. Additionally, Agnello and Schuknecht (2009), using a Random Effects Panel Probit model for 18 industrialized European countries and over the period 1980-2007, end up saying that the latest housing booms have been persistent and of significant magnitude. In fact, the model seems to be effective in identifying booms and busts early on. Granziera and Kozicky (2012) apply a Lucas tree model to the US housing market, where the stock price denotes to the house price and the rents equivalent to dividends that stock investors get from holding stocks, in a way to explore the contribution of expectations in the evolution of house prices and rent-price ratio.
11 According to Adalid and Detken (2007), the trend is estimated using a very smooth adjusting Hodrick-Prescott filter (=100000) which is estimated recursively (that is, only with data available at that time).
18 Interestingly, in the economic literature there are a vast number of definitions over the bubble concept. Thornton (2009) define the three basic views of bubbles believed by economists and the general public. The dominant view among the modern mainstream economists and the proponents of supply-side economics, is to reject the hypothesis of the existence of bubbles and that what is thought to be a bubble is simply the result of real factors. The second view, which is espoused by proponents of Behavioural Finance, is that bubbles occur because of psychological factors, known as “irrational exuberance”. According to Shiller (2007) findings, the speculative thinking among investors (denoted as “market psychology” by the author) plays an important role in determining house prices.12 Else, Thao (2012) find out that a strong dynamic relationship between house prices and housing market sentiment. In fact, the psychological impact of homebuyers, builders and lenders is significative in driven house prices away from fundamentals. The third view is that bubbles derive from manipulation of monetary policy and, it consists of both real and psychological changes. This last view is forward looking and enables the identification of the economic cause of bubbles which, consequently, allows policymakers to the right policy choices that would avoid bubbles in the future.
Furthermore, Levitin and Wachter (2010) argue that there are two opposite competing theories regarding the factors causing housing bubbles: “Some explanations, based on macroeconomics, posit that the bubble was caused by excessively easy monetary policy. (…) Other explanations have been demand-side explanations, meaning that the bubble was caused by excessive consumer demand for housing. (…) a supply-side phenomenon, meaning that it was caused by excessive supply of housing finance. (…) it was the result of a fundamental shift in the structure of the mortgage finance market from regulated to unregulated securitization.” As Levitin and Wachter conclude, the demand-side will contribute to assemble a bubble in real estate market, but the upward rising of house prices may also arise from large supply and effortless access to credit. That is, the proponents of demand-side theories support that bubbles are caused by increases in the consumer demand for housing; contrarily, the proponents of supply-side theories argue that bubbles are justified by increases in the supply of housing finance.
In a rational expectations’ framework, rational bubbles appear in the market when market participants have expectations about future price growths (Flood and Hodrick
12 As stated by the author, “(…) times and places with high home price increases show high expectations of future home price increases, and when the rate of price increases changes, so too do expectations of future price increases, in the same direction.”
19 (1990)). In a stock market perspective, investors are willing to invest more in stocks than is justified by the discount stream of future dividends. Further, rational bubbles follow an explosive path, which leads to asset prices to rise abruptly and to diverge from their fundamental values, consequently inducing exuberance in housing markets.
Hence, it is assumed that the settings behind rational bubbles under symmetric information are that all the agents in the market have rational expectations and they are assigned with the same information. Tirole (1982) claim that the rational expectations equilibrium (REE) occur when the participants in the market have insights about the “statistical relationship between the market price and the realized value of their trade (the “forecast function”) and use the information conveyed by the price as well as their private information to choose their demands”. It is commonly known that in a market bubble, the seller of the “bubble asset” is better off than the buyer – Pareto Efficiency. Further, the author concludes by saying that “(…) a rational trader will not enter a market where a bubble has already grown, since some traders have already realized their gains and left a negative-sum game to the other traders”. Thus, a bubble cannot exist if the initial allocation is Pareto Efficient.
The bubble process respects explosive paths, which prompts exuberance in housing markets and prices deviate from their fundamental values. Several authors have applied integration and co-integration tests to examine whether house price bubbles exist or not. For example, Hott and Monnin (2008) estimated fundamental prices on real estate markets through two alternative models. According to their findings, prices diverge significantly and for long periods from their fundamental values. In addition, in the long-run the actual prices tend to return gradually to their fundamental values.
However, the most intriguing fact about bubbles is that usually, one cannot perceive whether the price movements are due to pure speculation or not. And, of course, the literature review underlines that the optimal monetary policy is not necessarily easy to portray. As shown in Smets (1997), the optimal response will perform differently on whether asset prices are driven by improved productivity or over-optimistic expectations. Summing up, in the real world we never know when a bubble is over. It is more accurate to designate bubbles as speculative epidemics.13 Although regulatory policies
13 As stated by Shiller’s article (2013), “Bubbles Forever”, “(…) a new speculative bubble can appear anywhere if a new story about the economy appears, and if it has enough narrative strength to spark a new contagion of investor thinking”.
20 may diminish bubbles afterwards, it is challenging to control bubbles because of their social-psychological nature.
3.2.1. Theoretical Representation of Rational Bubbles
From a theoretical overview of rational bubbles, Cuthbertson (2004) is surveyed. The author analyzes the deviations of market stock prices from their fundamental values when agents are homogeneous, rational and equally informed. The study of explosive behaviour in housing markets is specified by the standard asset-pricing model, considering agents are risk neutral and have rational expectations, i.e., the price of a financial asset must be equal to the present value of discounted dividends in the future. Also, investors demand a constant (real) rate of return, 𝑟, on the asset, that is, 𝐸𝑡𝑅𝑡 = 𝑟. Concerning the authors Campbell et al. (1999), the asset-pricing model can be written as,
𝑃𝑡 = 𝛿𝐸𝑡(𝑃𝑡+1+ 𝐷𝑡+1) (1)
where 𝑃𝑡 represents the real asset price at time 𝑡, 𝐷𝑡+1 is the real dividend paid to asset’s
owner between 𝑡 and 𝑡 + 1, 𝛿 = 1 (1 + 𝑟)⁄ is the discount factor and 𝐸𝑡 is the conditional expectations operator for information at time 𝑡. Hence, the Euler equation in (1) denotes that the price today must be equal to the discounted present value of the expected fundamentals plus the resale price of housing tomorrow.
Under rational expectations and by recursively repeating forward substitution to yield, the Euler equation in (1) can be rewritten as
𝑃𝑡 = ∑ 𝛿𝑖𝐸𝑡𝐷𝑡+1 = 𝑃𝑡 𝑓 ∞
𝑖=1 (2)
where 𝑃𝑡𝑓is referred to as the fundamental price of housing due to the fact it is a function merely of economic fundamentals and the discount factor; the equation (2) is assumed that the transversality condition holds, that is, lim
𝑛→∞(𝛿 𝑛 𝐸
𝑡𝐷𝑡+𝑛)= 0. In the deficiency of this condition, there exist infinite forward solutions. Hence, the transversality condition is essential as it ensures an unique solution given by (2), which corresponds to the
21 fundamental value of the asset, 𝑃𝑡𝑓. Also, the housing price relates to its fundamental-based price, i.e., 𝑃𝑡 = 𝑃𝑡𝑓, and it is driven solely by economic fundamentals.
There is another expression behind a rational bubble which is another mathematical expression for the real asset price 𝑃𝑡 that satisfies the Euler equation in (1), namely 𝑃𝑡 = ∑ 𝛿𝑖𝐸 𝑡𝐷𝑡+1+ 𝐵𝑡 = 𝑃𝑡 𝑓 + 𝐵𝑡 ∞ 𝑖=1 (3)
where 𝑃𝑡𝑓 is the fundamental-based price of housing determined in equation (2) and 𝐵𝑡 represents a non-fundamental, the rational bubble. This equation implies that the market price, 𝑃𝑡, deviates from its fundamental value, 𝑃𝑡𝑓, by 𝐵𝑡, the amount of the rational bubble. In principle, the bubble is given by the difference between the actual price 𝑃𝑡, and the fundamental price 𝑃𝑡𝑓, as follows: 𝐵𝑡 = 𝑃𝑡− 𝑃𝑡
𝑓 .
Since the discount factor is positive, 𝛿 > 0, the bubble term, 𝐵𝑡 is expected to be explosive. Moreover, the emergence of such a bubble designs exuberance in the housing market, that is, buyers have positive expectations and expect to be counteracted through future price increases and so, resulting in a substantial deviation of the actual prices from their fundamental value, 𝑃𝑡𝑓. As Phillips, Wu and Yu (2011) assume in their model, the behaviour of the bubble component 𝐵𝑡 is explosive, reflecting the behaviour of the actual price 𝑃𝑡.
Nonetheless, in a way for (3) to satisfy (1), constraints need to be imposed on the dynamic behaviour of the bubble term, 𝐵𝑡. These constraints can be determined by supposing that equation (3) is a valid solution of (1), then restricting the dynamics of 𝐵𝑡. Consider equation (3) at time 𝑡 + 1 and take its expectations at time 𝑡,
𝐸𝑡𝑃𝑡+1= 𝐸𝑡[𝛿𝐸𝑡+1𝐷𝑡+2+ 𝛿2𝐸𝑡+1𝐷𝑡+3+ ⋯ + 𝐵𝑡+1] = 𝛿𝐸𝑡𝐷𝑡+2+ 𝛿2𝐸𝑡𝐷𝑡+3+ ⋯ + 𝐸𝑡𝐵𝑡+1
(4)
The second equality results from the law of iterated expectations, that is, 𝐸𝑡(𝐸𝑡+1𝐷𝑡+𝑗) = (𝐸𝑡𝐷𝑡+𝑗). Henceforth, both equations (1) and (4) follows that
𝛿(𝐸𝑡𝐷𝑡+1+ 𝐸𝑡𝑃𝑡+1) = 𝛿𝐸𝑡𝐷𝑡+1+ (𝛿2𝐸
22
By substituting the definition of 𝑃𝑡𝑓in equation (2) in the right-hand side of equation (5), I have
𝛿[𝐸𝑡𝐷𝑡+1+ 𝐸𝑡𝑃𝑡+1] = 𝑃𝑡𝑓+ 𝛿𝐸𝑡𝐵𝑡+1 (6)
Therefore, equation (1) and (6) may jointly be written as
𝑃𝑡 = 𝑃𝑡𝑓+ 𝛿𝐸𝑡𝐵𝑡+1 (7)
and for equation (3) to be a valid solution it is indispensable to assume that 𝛿𝐸𝑡𝐵𝑡+1= 𝐵𝑡 or consistently that
𝐸𝑡𝐵𝑡+1= 𝐵𝑡⁄𝛿 = (1 + 𝑟)𝐵𝑡 (8)
Moreover, the non-fundamental term 𝐵𝑡 must behave as a martingale, in other words, the best forecast of all expected future values of the bubble depend only on its up-to-date value. Note that the bubble solution violates the transversality condition, when 𝐵𝑡≠ 0, and because 𝐵𝑡 is arbitrary, the solution (house price) in equation (3) is non-unique. Equation (7) highlights that the bubble component must “grow” in expectations exactly at a rate of 𝑟.
Blanchard (1979) and Blanchard and Watson (1982) describe rational bubbles that burst almost surely in finite time. According to Blanchard and Watson (1982), a bubble will persist in each period with probability 𝜋 or collapse with probability 1 − 𝜋. The authors believe that even all the agents have the same information, a speculative bubble may exist, consequently affecting the economy. Rational bubbles are likely to start, burst and restart repeatedly. If the bubble lasts, it has to grow in expectation by a factor of (1 + 𝑟)/𝜋. It is necessary in order to achieve an expected growth rate of 𝑟, as to compensate for the risk of a crash. Note also that the bubble component may be stochastic and that bubbles can only subsist in a world in which the required return is lower than or equal to the growth rate of the economy. Besides, Diba and Grossman (1988) shows that the impossibility of negative bubbles in stock prices suggests that a rational-bubbles component that burst could not restart later. However, among others, Evans (1991),
23 Taylor and Peel (1998) and Hall et al. (1999)14 examine a class of rational bubbles that are always positive and periodically collapse, i.e., the authors define this type of bubble as,
𝐵𝑡+1= {(1 + 𝑟)𝐵𝑡𝑢𝑡+1 𝑖𝑓 𝐵𝑡 ≤ 𝛼 {𝛿 + 𝜋−1(1 + 𝑟)𝜃
𝑡+1[𝐵𝑡− (1 + 𝑟)−1𝛿]}𝑢𝑡+1 𝑖𝑓 𝐵𝑡 > 𝛼
(9)
where 𝑢𝑡 is a sequence of non-negative exogenous i.i.d. positive random variable with 𝐸𝑡(𝑢𝑡+1) = 1, 𝜃𝑡+1 is an exogenous i.i.d. Bernoulli process (independent of 𝑢𝑡+1) with 𝑃[𝜃𝑡+1= 1] = 𝜋 and 𝑃[𝜃𝑡+1 = 0] = 1 − 𝜋, and subject to 0 ≤ 𝜋 ≤ 1, 𝛼 > 0. The following condition is also crucial 0 < 𝛿 < (1 + 𝑟)𝛼 as rational bubbles cannot be negative (i.e. 𝐵𝑡 < 0). The bubble has two different rates of growth: the first tranche of the equation says, where 𝐵𝑡≤ 𝛼, says that the bubble grows at mean rate (1 + 𝑟); secondly, when 𝐵𝑡> 𝛼 the bubble grows at a faster mean rate (1 + 𝑟) 𝜋⁄ , but a downfall is expected by a probability of 1 − 𝜋 each period. Once the bubble has crashed it restarts and expands from the mean value of 𝛿.
Furthermore, and as already stated, the parameter 𝜋 refers to the probability of continuation of the bubble. Lastly, in the two rational bubble models described, the bubble component must grow exogenously at an expected rate of (1 + 𝑟) per period and it is “exogenous” to the “fundamental models”.
Unlike the most popular examples of rational bubbles, some authors like Froot and Obstfeld (1989) proposed a new rational-bubble specification, the so-called intrinsic bubbles which depends entirely on dividends. Intrinsic bubbles are driven exclusively by the exogenous fundamental determinants of asset prices rather than by extraneous ones. Froot and Obstfeld simulate an intrinsic stock-price bubble,
𝑑𝑡 = 𝜇 + 𝑑𝑡−1+ 𝜀𝑡 (10)
where 𝜇 is the dividends growth rate, 𝑑𝑡 is the log of dividends at time 𝑡, and 𝜉𝑡 is a random walk with zero mean and variance 𝜎2, that is, 𝜀
𝑡~ 𝑁(0, 𝜎2) white noise. They define the function of the intrinsic bubble as 𝐵(𝐷𝑡) = 𝑐𝐷𝑡𝜆, with 𝑐 being an arbitrary
24 constant and 𝜆 a positive root of the following quadratic equation 𝜆2 𝜎2
2 + 𝜆𝜇 − 𝑟 = 0. Further, the basic stock-price equation is given by
𝑃(𝐷𝑡) = 𝑃𝑡𝑝𝑣 + 𝐵(𝐷𝑡) = 𝑃𝑡𝑝𝑣+ 𝑐𝐷𝑡𝜆 (11)
where for 𝑐 ≠ 𝑜 the equation contains a bubble and it is driven solely by fundamentals. As expressed, 𝑃(𝐷𝑡) is a function of dividends only and does not depend on time or any other extraneous variable. And it is assumed that 𝑐 > 0 so that stock prices cannot be non-positive.
Since equation (10) only display characteristic bubble behaviour during their expansion phase, some authors propose a regime switching model of dividends such as,
∆𝑑𝑡 = 𝜇0(1 − 𝑠𝑡) + 𝜇1𝑠𝑡+ [𝜎0(1 − 𝑠𝑡) + 𝜎1𝑠𝑡]𝜀𝑡 (12)
where 𝑠𝑡 is a state variable that follows a Markov process with the transition probability associated in each different state space; that is, it is assumed that the parameters of the ADF regression are time-varying, that is, they change with an unobserved indicator 𝑠𝑡 ∈ {0,1}. The dividends’ growth rates, ∆𝑑𝑡, are distributed as 𝑁(𝜇0, 𝜎02) in the 𝑠𝑡= 0 state, and as 𝑁(𝜇1, 𝜎12) in the 𝑠𝑡= 1 state. In practice, a Markov-switching procedure allows for the existence of two different regimes/ states consistent with the expanding and collapsing phases of the bubble. The MS-unit root test consists of testing the null hypothesis of non-stationarity 𝜎0 = 0 and 𝜎1 = 0 against the alternative 𝜎0 < 0(𝜎1 > 0) or 𝜎0 > 0(𝜎1 < 0) in equation (12). Accordingly, a positive estimate 𝜎𝑠 (𝜎0 > 0 or 𝜎1 > 0) statistically significant in the regime 𝑠𝑡 = {0,1} suggests an explosive behaviour, and a negative one indicates a stationarity behaviour.
Furthermore, the real effects of bubbles do in turn affect market fundamentals and thus have the power to modify the behaviour of prices. Considering housing as an asset composed by two inputs, land and structures. Hence, the supply curve for land shows an upward sloping and the supply for structures is inelastic in the short-run and elastic in the long-run. When the market is in the steady-state, the housing prices are equal to the present value of housing services, “rents”. In addition, new housing construction equals the depreciation on the existing stock. Suppose now that the agents of the market are willing to pay more than the market fundamentals, thus resulting in the start of a