Bringing Relationship Marketing Theory into B2B Practice:
The B2B-RP Scale and the B2B-RELPERF Scorecard*
Luis Filipe Lages, Andrew Lancastre, and Carmen Lages**
22 March 2005
* This research was funded by a research grant from the 6th European Framework Program, Specific Support Action-CoCombine. Luis Filipe Lages is grateful to “Nova Égide”, Andrew Lancastre acknowledges the support of UNIDCOM/ IADE and Carmen Lages to
UNIDE/ISCTE.
** Luis Filipe Lages is Assistant Professor of Marketing and International Business at Universidade Nova de Lisboa, Faculdade de Economia, Campus de Campolide, 1099-032 Lisboa, Portugal. E-mail: [email protected]; url: http://prof.fe.unl.pt/~lflages; Tel.
+351.213801600; Fax: +351.213886073.
Andrew Lancastre is Assistant Professor of Marketing at IADE – Instituto de Artes Visuais, Design e Marketing, Av. D.Carlos I, nº4, 1200, Lisboa, Portugal. E-mail: [email protected] Carmen Lages is Assistant Professor of Marketing at ISCTE Business School- Lisbon, Av. das Forças Armadas 1649-026 Lisboa, Portugal. E-mail: [email protected]
Bringing Relationship Marketing Theory into B2B Practice:
The B2B-RP Scale and the B2B-RELPERF Scorecard
Abstract
This study presents a new measurement scale to assess the performance of a relationship between two firms. The Business-to-Business Relationship Performance (B2B-RP) scale is presented as a high order concept. When tested in a sample of nearly 400 SME’s purchasing managers operating in a B2B e-marketplace, our findings reveal that greater relationship performance results in better 1) relationship policies and practices, 2) relationship commitment, 3) trust in the relationship, 4) mutual cooperation, as well as 5) satisfaction with the relationship. The multi-dimensional scale shows strong evidence of reliability as well as convergent, discriminant and nomological validity. Findings also reveal that B2B relationship performance is positively and significantly associated with loyalty. While building on this scale, the authors develop the B2B-RP Scorecard intended to be included in periodic reports. At the managerial level, both the scale and the scorecard are expected to help disclose relationship performance, and act as useful instruments for periodic planning, management, controlling, and improvement of B2B relationships.
Keywords: Relationship Performance; Relationship Marketing; B2B-RP Scale; B2B-RELPERF Scorecard; Electronic Markets.
1
Bringing Relationship Marketing Theory into B2B Practice:
The B2B-RP Scale and the B2B-RELPERF Scorecard
“Every firm, every activity, every worker needs metrics.” (Melnyk, Stewart and Swink, 2004: 209)
Introduction
As early as eight decades ago, Alfred Sloan and Donaldson Brown were interested in exploring the process of performance assessment at General Motors. Today, firms have a wide range of tools and metrics at their disposal to assess periodic performance, and they represent a critical topic in business literature (e.g., Cooke, 2001; Kerr, 2003; Melnyk and Christensen, 2000) and across different fields of management research (e.g., Beamon, 1999; Ittner and Larcker, 1998; Neely, 1999). However, although both worlds are interested in the topic of metrics, the way academics and managers discuss it is quite different (Melnyk, Stewart, and Swink, 2004). Frequently practitioners have different expectations and work with different time scales than those of academics (Likierman, 2004). Moreover, academic research is not normally concerned with the analysis and development of metrics that might be applied at the managerial level and included in management periodic reports (see Abdeen, 1991 as an exception). In this study it is our goal to develop solid instruments, both at the theoretical and methodological level.
The marketing trend towards a better understanding of relationship development with business partners continues to grow, as managers and researchers observe that better relationships result in a significant impact on business performance (Lemon, White, and Winer, 2002; Lages, Lages, and Lages, 2005). Nevertheless, although marketing academics and practitioners have been examining relationship marketing (RM) since the mid-80s, there has been significant criticism on
2
the way most RM studies have been conducted, because of their use of only a single dimension, such as trust, to capture the nature of a relationship between buyers and suppliers (Yau et al., 2000). The development of customer relationship is an ongoing process during which relational policies and practices, trust, relationship commitment, mutual cooperation, and satisfaction with the relationship represent important dimensions to be considered (Dwyer, Schurr, and Oh, 1987; Jap and Ganesan, 2000).
It is our goal to develop a scale that allows one to assess relationship performance in B2B relationships (the B2B-RP Scale). This scale is then used to develop a relationship performance scorecard (the B2B-RELPERF scorecard) to be included in periodic business reports. Major reasons justify the fundamental need for the disclosure of relationship performance metrics in periodic reports. Relationship performance metrics help to plan and monitor. They might be used as a supporting tool to identify the way resources could be better administered and allocated to different customers, as well as to identify deviations against proposed objectives. These metrics might also help to establish annual priorities in terms of marketing efforts, given the development of the different customer relationship processes, and the definition of the firm’s main objectives. Moreover, relationship performance metrics may be used as a motivation and reward tool for managers and their teams (e.g. bonus, promotion) by relying on comprehensive data. Finally, these metrics are essential to support benchmarking, improvement and development of the customer relationship processes.
The Marketing Science Institute has recently underscored the need to concentrate efforts on the development of tools that may better assist managers and firms’ performance, in order to narrow the gap between scientific research and managerial needs. It has been further stressed that one of the highest priorities in the years to follow is the development of B2B metrics, namely in an e-commerce environment (MSI, 2004; Parasuraman and Zinkhan, 2002; Parasuraman, Zeithaml,
3
and Malhotra, 2005). To our knowledge there are no established scales that might be used as a basis to manage, develop and evaluate the relationships between buyers and suppliers in an Internet context. Moreover, despite the interest of both managers and academics in better understanding relationships in the electronic environment, concerted efforts have not materialized (Grewal, Comer, and Mehta, 2001). Our paper intends to contribute to filling these gaps in the literature.
In the next section we start by presenting the five dimensions of the B2B-RP Scale. Then, the preliminary scale is refined through qualitative research and tested via a field survey of nearly 400 SME’s purchasing managers in an e-marketplace. The impact of the B2B-RP Scale on customers’ loyalty intentions is also analyzed. The scale is then used as a basis for the development of the B2B-RELPERF Scorecard, which allows the assessment of relationship performance on a periodic basis. Finally, research limitations, implications for practice and theory, and directions for future research are presented.
The B2B-RP Scale
We consider that relationship performance is a higher order construct made of several distinct, though related dimensions. As a result, the B2B-RP Scale reflects the performance of the buyer-supplier relationship marketing process, at a specific point in time, while taking into
consideration the following five dimensions: relationship policies and practices, trust in the relationship, relationship commitment, mutual cooperation, and satisfaction with the relationship. Each of the five B2B-RP dimensions are presented below.
Relationship Policies and Practices
Relationship policies and practices represent one of the most important dimensions to be considered during a relationship process (Jap and Ganesan, 2000). By establishing clear relational
4
policies and practices the supplier becomes motivated to behave in a way that is beneficial to the relationship as a whole, and as a consequence “emerging exchange partners start setting the ground rules for future exchange” (Dwyer, Schurr, and Oh, 1987:17). Despite the well-recognized significance of these policies, few studies have examined company behaviors and practices specifically or the mechanisms by which they may enhance relationships (Sirdeshmukh, Singh, and Sabol, 2002).
Ethical values, such as the supplier showing respect for the customer, should be included in relationship policies and practices, as they contribute to the development of the relationship between customers and firms (Morgan and Hunt, 1994). In fact, the extent to which partners have common beliefs about what behaviors and policies are important or not, appropriate or inappropriate, and right or wrong, is an important fact in the process of relationship development. Strategic considerations motivate firms to better serve their customers, and technology is viewed as a means to build competitive advantage. In electronic markets strategic considerations such as “providing better customer service” are particularly significance, given the fact that the virtual world increases the possibility of suppliers acting opportunistically and the customer perceiving augmented risk and uncertainty (Grewal, Comer, and Mehta, 2001). It is then natural that providing better service through quicker and easier problem solving represents an added relationship value in the electronic context and a contribution to the buyer-supplier relationship. Trust
Since firms and marketers show increasing attention and efforts to build long-term relationships with their customers, trust plays a central role in the development of relationship performance (Dwyer, Schurr, and Oh, 1987), as trust is an essential ingredient in the creation, development, and maintenance of long-term relationships between buyers and suppliers (Anderson and Narus, 1990; Ganesan, 1994). Trust exists when one party has confidence in an exchange partner’s
5
reliability and integrity (Morgan and Hunt, 1994). Once trust is established, firms learn that coordinated, joint efforts will lead to results that normally exceed what they would achieve if they acted on their own in their best interests. So trust is a key ingredient in a working
relationship, and this fact has repercussions on the firm’s actions. These repercussions can be defined as the buyer’s belief that the supplier will act in a way that results in positive outcomes for the buyer.
Trust is the cornerstone of the strategic partnership and relationship development process
(Moorman and Deshpandé, and Zaltman, 1993; Morgan and Hunt, 1994). Because perceived risk is more pronounced in an e-commerce environment than in traditional commerce, trust may represent greater importance due to the spatial and temporal separation between buyers and sellers that result from the Internet characteristics. In fact, the Internet transaction typically takes place from different locations at different times, and goods or services are delivered
subsequently, after the buyer has confirmed payment. When selecting a supplier, a buyer must take into account the possiblity that the supplier may be an expert in attracting customers and cashing credit cards, but not in actually delivering goods or services (Smith, Bailey, and
Brynjolfsson, 1999). So, given the higher perceived risks and uncertainty in the “marketspace”, trust could be even more critical in the buyer-supplier relationship development process than in the traditional marketplace. The buyer’s belief that the supplier delivers reliable information and advice represents an added contribution for trust developing purposes.
Relationship Commitment
Commitment is essential for the development of long-term relationships (Anderson and Narus, 1990; Dwyer, Schurr, and Oh, 1987; Morgan and Hunt, 1994) and is an important indicator of relationship performance (Roberts, Varki, and Brodie, 2003). Commitment to the relationship is defined as the “desire to develop a stable relationship, a willingness to make short-term sacrifices 6
to maintain the relationship, and a confidence in the stability of the relationship” (Anderson and Weitz, 1992: 19). Moreover, relationship commitment is a means to differentiate successful relationships from unsuccessful ones (Morgan and Hunt, 1994).
Suppliers in a committed relationship gain greater access to market information for selecting a better customer-oriented assortment (Anderson and Weitz, 1992), and buyers in an e-marketplace receive more relevant up-to-date market and product information, a better assortment choice, and order/payment automation (Weiber and Kollman, 1998; Smith, Bailey, and Brynjolfsson, 1999). Because both parties receive new benefits from each other, each one has a stronger motivation to build, maintain, and develop the relationship through committed efforts (Kumar, Scheer, and Steenkamp, 1995). Hence, there is evidence that strong relationships are “built on the foundation of mutual commitment” (Berry and Parasuraman, 1991: 139).
In an organizational environment, commitment may be affective commitment (attachment to an organization), continuance commitment (perceived cost of leaving an organization), or normative commitment (perceived obligation to stay with an organization) (Meyer, Allen, and Smith, 1993). Of the three kinds of commitment, only affective commitment influences the degree to which the customer “wants” to maintain a relationship with the firm (Roberts, Varki, and Brodie, 2003). Hence, in this research setting, we assume that relationship commitment is the buyer’s attachment to the supplier that leads to the development of stable and long-term relationships (Anderson and Weitz, 1992).
Mutual Cooperation
Relationship marketing requires cooperative behaviors (Morgan and Hunt, 1994). Cooperation between partners in a relationship exchange process grows on the basis that they perceive greater benefits from working together than from pursuing similar benefits by working independently. Cooperation can then be defined as “similar or complementary coordinated actions taken by firms
7
in interdependent relationships to achieve mutual outcomes or singular outcomes with expected reciprocation over time” (Anderson and Narus, 1990: 45).
The electronic marketplace is a “networked information system that serves as an enabling infrastructure for buyers and sellers to exchange information, transact, and perform other
activities” (Varadarajan and Yadav, 2002: 297). Mutual cooperation in an electronic environment is seen in terms of the regularity of the interactions and the openness in communication activities between the buyer and the supplier (Hewett and Bearden, 2001; O’Keefe, O’Connor and Jung, 1998), and represents an important element in relationship performance planning, managing, and controlling purposes.
Satisfaction with the Relationship
While taking into consideration past experience, satisfaction with the relationship refers to “the cognitive and affective evaluation based on personal experience across all […] episodes within the relationship” (Roberts, Varki, and Brodie, 2003: 175). Satisfaction with the relationship may then be seen as a positive emotional and rational state resulting from the assessment of the buyer’s working relationship with the supplier (Geyskens, Steenkamp and Kumar, 1999). Customer evaluation of satisfaction with the relationship with the supplier is important for the development of business exchanges (Cannon and Perreault, 1999). It summarizes customer’s past interactions with the supplier that influence expectations of future relationship development (Roberts, Varki, and Brodie, 2003), leading to long-term continuation of the relationship, and emphasizing why satisfaction with the relationship is essential to the improvement of relationship performance. The fulfillment of achieving the parties’ desired outcomes leads to satisfaction with the partnership (Anderson and Narus, 1990).
8
Method
Research Setting
The unit of analysis for this research is the specific buyer’s relationship with the supplier, from the buyer’s perspective. We decided to collect customers’ data because it is usually the customer that ultimately makes the decision of whether to purchase from the supplier, and it is the customer’s view that is likely to be determinant to the relationship development and performance (Cannon and Perreault, 1999).
Electronic business has added a whole new dimension to discussions of business relationships (Morgan and Hunt, 2003). In an e-market environment, business is conducted at a distance and risks and uncertainties are enhanced, namely because the Internet - which is a relatively new and complex technology - presents security problems frequently reported in the media. Beyond this fact, the online suppliers may easily register and track customer data, which increases the possibility for them to act opportunistically. Additionally, many online buyers might not yet have accumulated the necessary shopping experience and relevant knowledge about potential market suppliers or other partners within this new online shopping channel (Einwiller, Ingenhoff, and Schmid, 2003).
Usually an e-market is sponsored by a market maker, whose main role is centered on gathering buyers and sellers in the marketspace (Grewal, Comer, and Mehta, 2001; Klein and Quelch, 1997). For the purpose of this project, we selected PMElink.pt and its small and medium enterprises’ (SMEs) customers. PMElink.pt is an online business center that sells office goods and services to SMEs, from office paper to consumables, computers to office furniture, recruitment services to customer credit reports, in areas that support their core businesses. PMElink.pt not only manages to significantly reduce product and services prices to its clients
9
through bulk ordering and strategic sourcing of materials from key suppliers, it promises efficient and 24 hour delivery of goods. In addition to goods, PMElink.pt offers a range of business
services, business expertise, advice and information online. As customers place their orders, PMElink.pt forwards them to their 30 suppliers; an express cargo carrier takes care of delivery logistics, and PMElink.pt bills the customer, promising a 99 percent success rate for goods being delivered within a 24 hour timeframe.
Survey Instrument Development
Churchill’s (1979) traditional approach to scale development was adopted. The measures were refined through interviews with managers involved in the electronic market operations. Based on their feedback these measures were adjusted to electronic markets’ reality. Three SME customers then assessed the final set of items of the B2B-RP Scale for content and face validity. Based on the literature review and preliminary findings, the domain of the construct was specified to include five B2B-RP dimensions. A set of items designed to measure each of these dimensions was developed, some of them undergoing modifications while taking into consideration the e-commerce context. A full listing of the 14 final items and their scale reliabilities is seen in Table 1. The average internal reliability (Cronbach alpha) was .86.
*************************************** Insert Table 1 about here
*************************************** Data Collection
In order to test the B2B-RP Scale, primary data were initially collected through a qualitative exploratory stage followed by a survey, based on an online questionnaire, aimed at a sample of the SME customers, and directed to individuals responsible for the purchasing operations. The
10
online survey, attached to the firm periodic online newsletter, provided 395 valid questionnaires, above the minimum number (381) required for a 95% confidence level and a 5% sampling error1.
Sample Profile and Non-response Bias
Respondents covered the main industry and economic activities, from the primary sector (5%), to the industrial sector (21%), and the services sector (74%). They also regularly purchased main product categories, as classified by the supplier: paper (74%); consumable goods (73%); other office products (57%); systems equipment (29%); office furniture (5%); and services (6%). Based on the supplier database, the survey was directed to individuals that are primarily
responsible for the SME’s buying centers. Althoughthe job titles of the respondents ranged from general manager to financial manager, purchasing manager, and administrative manager, all of the respondents have in common the fact of being responsible for the purchasing operations. They are typically responsible for contacting and dealing with the supplier on a daily basis. In terms of profile, 20% of the respondent firms had less than 6 months of business experience with the supplier, 30% showed an experience that varied between 6 and 12 months, and the remaining 50% had more than 12 months experience. Of this last group, 70% had experience above 2 years. This result indicates that although the title of the respondents’ positions may be wide-ranging, the individuals appear to have significant knowledge in the specific purchasing activities of the firm. Non-response bias was tested by assessing the differences between the 75% early and 25% late respondents (Armstrong and Overton, 1977). No significant differences were found, suggesting that there was not a significant problem with non-response bias in the study. Data were then analyzed through exploratory factor analysis (EFA) followed by confirmatory factor analysis (CFA).
1 In line with previous studies conducted by PMElink.pt, we have used the online periodic newsletter to promote the
on-line survey. Stratified sampling, based on the customers’ loyalty degree strata grouping, was accomplished.
11
Data Analysis
Confirmatory Factor Analysis
CFA is performed to assess the measurement properties of the existing scales, using full-information maximum likelihood (FIML) estimation procedures in LISREL 8.3 (Jöreskog and Sörbom, 1993). In this model, each item is restricted to load on its pre-specified factor, with the five first order factors allowed to correlate freely. The chi-square for this model is significant (χ2=143.58, 67df, p<.05). Since the chi-square is sensitive to sample size, we also assessed additional fit indices: 1) Non Normative Fit Index (NNFI); 2) Comparative Fit Index (CFI); the Incremental Fit Index (IFI) and Standardized Root Mean Square Residual (SRMR). The NNFI, CFI, and IFI, of this model are .99 and the SRMR is .41. Since fit indices can be improved by allowing more terms to be freely estimated, we also assess the Root Mean Square Error of Approximation (RMSEA). The RMSEA of this measurement model is .054.
Unidimensionality was evidenced by the large and significant standardized loadings of each item on its intended construct (average loading size was .83). Additionally, as shown in Table 1, all constructs present the desirable levels of composite reliability (cf. Bagozzi, 1980). Table 1 also shows that Fornell and Larcker’s (1981) index of variance extracted was above the recommended level of .50 for all of the five constructs.
Evidence of discriminant validity is revealed by the fact that all of the construct intercorrelations are significantly different from 1, and the shared variance among any two constructs (i.e., the square of their intercorrelation) is less than the average variance explained in the items by the construct (Fornell and Larcker, 1981; MacKenzie, Podsakoff and Rich, 1999). The largest squared multiple correlation between any two constructs was .53 (.73 was the highest correlation --between satisfaction and commitment as well as between satisfaction and trust --), whereas the
12
variance extracted ranged from .61 to .78. In order to assess nomological validity, we tested our measures with respect to a dimension to which our constructs are supposed to be theoretically related (cf. Churchill, 1995). There are well-grounded theoretical reasons to expect a positive relation between relationship performance and loyalty. Buyer loyalty can be defined as the intention to perform a set of behaviors that indicate a motivation to maintain a relationship with the supplier, including allocating a higher share of wallet, engaging in positive word of mouth, and repeat purchasing (Zeithaml, Berry, and Parasuraman, 1996). When suppliers are oriented to the relationship and act in a way that strengthens relationship policies and practices, trust,
relationship commitment, cooperative activities and satisfaction, the perceived risk with the specific service supplier is likely reduced, enabling the customers to make confident predictions about the supplier’s future behaviors (Morgan and Hunt, 1994). Altogether, this helps to shape the customers’ perceptions about the relationship they hold with suppliers, and enhances their loyalty (Sirdeshmukh, Singh, and Sabol, 2002). We found that loyalty2 is positively correlated with relationship orientation (r=.50), relationship commitment (r=.64), trust (r=.53), mutual cooperation (r=.58) and satisfaction with the relationship (r=.80). Given that all of the coefficients are positive and significant (at p<.01 or better), we may conclude that the performance of the buyer-seller relationship has a positive impact on loyalty and, hence, the nomological validity of the five proposed measures is supported (Cross and Chaffin, 1982). Higher Order Factor
A second order factor model of B2B-RP is also estimated. This model includes the five first order factors along with their standardized coefficients, observable indicators and measurement errors.
2 Three items where used for measuring buyer loyalty (α=.93): a) buyer intention to make most future purchases
from the supplier, b) intention to recommend the supplier to other firms, and c) intention to use the supplier the next time the buyer needs to purchase products or services. All items are 7-point likert scales anchored by “Strongly Disagree” and “Strongly Agree” (Sirdeshmukh, Singh, and Sabol 2002).
13
*************************************** Insert Figure 1 about here
***************************************
Each of the first order factors has significant (p<.01) loadings of .54, .80, .79, .74, and .94 respectively, on the second order factor. Although the chi-square for the second order model is significant (χ2=152.66, 72df, p<.05), the NNFI, CFI, and IFI are .99, the SRMR is .41, the RMSEA is .053, and the chi-square difference test between the first order and second order models is non-significant (∆χ2= 9.08, ∆df= 5, p>.10). Overall, this suggests that the higher order model accounted for the data well. Further evidence is demonstrated by inspecting the
correlations between the five constructs. All correlations are significant at p<.01 and the coefficients are large and positive, indicating that the five scales converge on a common
underlying construct (Cadogan, Diamantopoulos, and De Mortanges, 1999; Lages and Fernandes, 2005).
The Fundamental Need to Bring Relationship
Performance Metrics into Periodic Reports
Six major reasons justify a fundamental need for the disclosure of relationship performance metrics in periodic reports. The first reason is to thoroughly communicate the firm’s situation in the market. At a time when business relationships are instrumental in the determination of enterprises’ value and performance, most stakeholders (e.g., shareholders, investors, executives, and government) would be pleased to find information in periodic reports that allows them to evaluate the (un)success of each business relationship. In this way, the credibility and importance of the business operations could be promoted from the shareholders’ viewpoint.
14
A second reason is to help to establish annual priorities. Despite managers’ intuition about which relationships to invest their efforts in, it may become very difficult to assign priorities and gauge the resulting benefits of relationships, the reason being that there is no established yardstick by which to measure the performance of individual relationships. Hence, the definition of a clear metric and the attribution of different weights to different performance measures, as well as to different relationships, might play a major role in defining where the focus should reside. Third, planning and monitoring are essential. There is a need for a supporting tool in decision making that allows controlling the way resources are annually administered and allocated to the different business relationships. Relationship performance metrics would help managers to clearly define periodic objectives for particular products in specific markets, which would allow them to better control the cause of relationship (un)success. In particular, when addressing business problems, relationship performance metrics can be used as a guide to managers and employees. Metrics might also be used as a key monitoring and decision making tool in a vast range of situations, such as in international relationships and exploration of new markets, or when major changes occur, such as a firm’s restructuring or downsizing across divisions or when business performance has been substandard or has slipped from past higher levels and top managers try to keep tight controls on different aspects of the business operations.
Fourth, it can be a motivation tool for staff members. By relying on comprehensible data publicly presented in periodic reports, human resources can be rewarded (e.g. bonus, promotion) when achieving relationship goals. Moreover, when relationship performance is positive all the firm’s stakeholders are more likely to react positively, and managers are thereby in a better position to request more human and financial support (Lages and Montgomery 2004).
A fifth reason is to support benchmarking and improvement. Both companies and executives are under pressure to develop and apply systems that improve the business activity. Annual
15
disclosure of relationship performance might provide both with a benchmark to track the progress of business operations over time. Moreover, this benchmark might be the basis for sharing
information between managers within and across firms as a way of identifying which business operations perform better, allowing benchmarking the best practices to the business relationships that are performing poorly.
Last but not least, the inclusion of relationship performance metrics into periodic reports would allow matching research with the frame of reference employed by managers. Since planning is typically undertaken on an annual basis and a significant share of managers’ time is spent in assessing annual performance of individual business operations, by developing relationship performance appraisals researchers might provide powerful managerial tools. Moreover,
researchers cannot ignore the fact that managers’ frame of mind relates to annual results. Annual relationship performance relates directly to managers’ personal interests, as a positive/negative performance might have an immediate effect on them (e.g. having a salary bonus versus being fired) (Lages and Montgomery 2004). On the basis of these arguments, a credible disclosure of relationship performance information is a basic requirement in periodic reports.
The B2B-RELPERF Scorecard
In modern companies, there is an increasing need to access and establish goals for specific performance metrics, to measure efficiency, effectiveness, productivity, and annual performance, against objectives. Non-financial measuring is becoming increasingly popular in modern
management, namely through the balanced scorecard developed by Kaplan and Norton (1992, 1993, 1996, 2001) because it can be understood as “innovative performance-improvement strategy that gets results” (Abernathy, 1997: 58). In this study, we use the B2B-RP Scale as a basis for developing the B2B-RELPERF Scorecard.
16
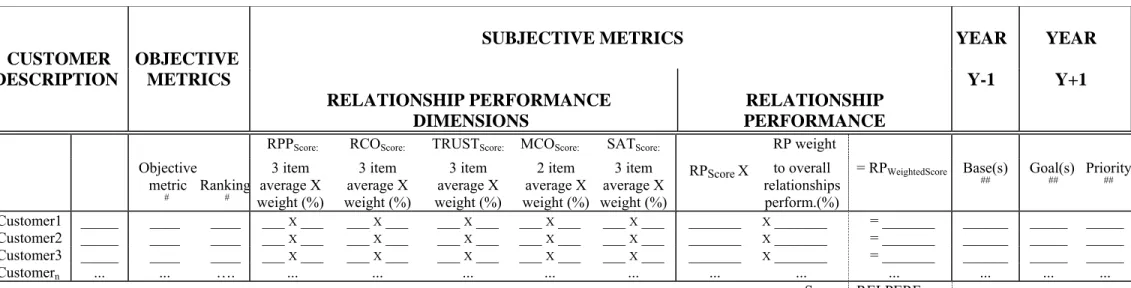
To balance the metrics, the scorecard should include both objective and subjective metrics, reflecting the relationship performance, as recommended by Kaplan and Norton (1996). In a B2B environment, sales, profits, and costs by customer are some of the general objective metrics that most firms plan on and monitor periodically. However, objective metrics may not be significant during the first stages of the relationship process (Peppers and Rogers, 1997, 1999; Reichheld and Sasser, 1990). Nevertheless, whenever available, a balanced B2B-RELPERF Scorecard may combine these objective/financial measures with the subjective metrics previously presented. Figure 2 presents our scorecard proposal.
*************************************** Insert Figure 2 about here
*************************************** Development of the B2B-RELPERF Scorecard
On the B2B-RELPERF Scorecard, the first step is to enter under “customer description” the customers that were identified as showing business potential for inclusion in a relationship process that are the object of specific marketing efforts. The second entry is under the “objective metrics” column(s) to identify existing financial metrics (e.g. sales, profits, or costs) and establish a ranking for each customer. Then, customers should be asked to assess the 14 items presented in the B2B-RP Scale on a 7 point scale (see Table 1). The next step is to assess the average score for each of the five B2B-RP dimensions and multiply them by their weights3. These results should be presented under the column of “relationship performance dimensions”. The sum of the five weighted dimensions will represent the final RPScore per customer. The RPWeightedScore results from
3 The buyer-seller relationship process develops through mutual learning stages, where relationship policies and
practices, trust, relationship commitment, mutual cooperation, and satisfaction with the relationship are critical issues. Depending on the relationship stage, different factors might present different weightings. Weightings should differ across the various customers’ relationship processes, depending on the different phases of development of each process. For this reason, it is important that the marketing team agrees on the weightings of each dimension, previous to its implementation and future assessment.
17
the multiplication of the final RPScore by the weight of each customer to overall relationship performance. Each RP weight to overall relationships performance must take into consideration different factors, such as the firm’s mission and objectives, firm’s strategy, and the different insights from managers. A final RELPERFScoreresults from the sum of all RPWeightedScores. Managers are often judged not only by the performance of different relationship processes but also by the priorities they assign to the relationships. We therefore propose that each current year (Y) weighted score should be compared with the one from the previous year (Y-1), as problems are easier to observe by the size of the gap between a current year’s metrics and the base score from the previous year. This annual feedback will allow marketers to make corrections and will help them define goals and priorities for the relationships in the following year. In order to define each relationship process goal and degree of priority, firms might also consider existing objective metrics and industry benchmarks. Another possibility is to set sub-goal intervals to the B2B-RELPERF Scorecard (e.g. on a quarterly or half-year basis). The major advantage of doing so is that quarterly or half-year feedback would enable marketers to review relationship performance trends and to make corrections more frequently as a response to the changing environment (Abernathy 1997). In this way periodic scheduled reviews with the B2B-RELPERF Scorecard might be extremely useful in monitoring and improving relationship and loyalty strategies. In sum, the B2B-RELPERF Scorecard developed here is expected to ensure that attention is paid by marketing managers to both subjective and existing objective metrics, to each relationship process, and to overall relationship performance. The future inclusion of the B2B-RELPERF Scorecard in annual planning would make them more transparent and would improve the reliability of marketing efforts on specific relationship processes.
18
Research Limitations
There are some limitations to consider. Our research relies on the responses of the buyers only. Conceptually, a researcher can collect data from the supplier’s perspective, the customer’s perspective, or both. Ideally, researchers should collect data from both sides of the dyad. Since research in relationship marketing is still at an early stage, it is believed that with this approach we offer the buyer view as a starting point to better understand the components of B2B relationship performance. Another limitation is that our research instrument (i.e. the questionnaire) may have created common method variance. This could be particularly threatening if the respondents were aware of the conceptual framework of interest. However, they were not told the specific purpose of the study, and the construct items were separated and mixed (c.f. Jap 2001; Lages and Jap 2003). Furthermore, confidentiality was guaranteed to all survey participants for self-presentation reasons, which also helps to reduce the possibility of bias in issues such as relationship policies and practices, trust, commitment, cooperation and satisfaction (Singh 2000). Additionally, if common method bias exists, a CFA containing all constructs should produce a single method factor (Podsakoff and Organ, 1986). The goodness-of-fit indices (NNFI=.85, CFI=.87, IFI=.87, RMSEA=.191) indicate a poor fit, which suggests that biasing from common method variance is unlikely (Lages and Lages, 2004).
Managerial Implications
We argue that it is important to develop tools to assess the performance of a relationship between two firms so that managers might better understand and efficiently handle their relationships. We test this measure in a buyer-seller relationship in an e-business context. The e-marketplace is a particularly interesting environment to develop these metrics, as e-business relationships are conducted at a distance and risks and uncertainties are magnified. Moreover, since the
19
relationship process develops through various stages in the long run, where different dimensions assume different roles and contributions during the process, it is argued that the use of a B2B-RELPERF Scorecard, through which different dimensions are weighted differently, may capture that fact. This tool is expected to help practitioners planning, managing, monitoring, and
improving their ongoing B2B relationships.
By using the B2B-RELPER scale and B2B-RELPERF Scorecard to assess the performance of a buyer-supplier relationship process, at a specific point in time, managers may better understand the relationship process’ main constituent elements, which aids the manager in selecting, using, and controlling the most adequate marketing tools for each of them. The use of the B2B-RP Scale and B2B-RELPERF Scorecard may also help managers understand the difference that may exist in the relationship process development phases regarding different customers or groups, and to handle them more efficiently and effectively. By defining actions that address potential problems during the relationship marketing process development, managers might ultimately influence their firm’s relationship orientation, retention, and loyalty strategies.
Theoretical Implications and Research Directions
The performance of a B2B relationship process is central to marketing practice and research. The hierarchical structure of the B2B-RP Scale presents theoretical implications to both relationship marketing and technological literatures. Although we cannot claim to have fully captured the dimensions of relationship performance, it may be argued that we are close to it, because the second order factor extracts the underlying commonality among dimensions. In addition to
obtaining respondents’ evaluations of the five dimensions, the second order factor model captures the common variance among them, reflecting an assessment of the buyer-supplier relationship performance process. While testing nomological validity, our empirical findings demonstrate that
20
relationship performance is strongly associated with loyalty. Hence, by using the B2B-RP Scale to assess the performance of a relationship, managers may better understand relationships’ main constituent elements, so that they may handle them more efficiently. By defining strategies and actions that address potential problems with relationship performance, managers might ultimately influence their firm’s performance. Additional research is required when analyzing the
antecedents and consequences of the B2B-RP Scale. In addition to its relationship with loyalty, it is necessary to investigate how the scale is related to other established constructs in the
relationship marketing field, such as transaction-specific investments.
Future research is particularly encouraged to further test the B2B-RP Scale and B2B-RELPERF Scorecard, namely by doing so on the other side of the dyad (i.e. the suppliers’ side) or on both sides of the dyad. Additionally, this scale should be tested in different settings, within a wide range of activities. As relationships in an international context transcend national boundaries, they are affected by social, cultural and other environmental differences. Hence, it would be important to test the B2B-RP Scale in other settings such as exporter-importer and franchiser-franchisee relationships. When applying it to different contexts, we encourage researchers to add new items and factors in order to continue refining the B2B-RP Scale.
In sum, as a direct response to a recent observation in the literature (Morgan and Hunt 2003), it is hoped that this article will help to cultivate further research on relationship marketing theory while helping to shed light on the B2B relationships supported by new information and communication technologies. Moreover, at a time when researchers are challenged to present studies with managerial implications (MSI, 2004), we expect that the RP Scale and B2B-RELPERF Scorecard helps to address the managerial needs of relationship performance planning, implementation, and control.
21
References
Abdeen A. Social responsibility disclosure in annual reports, Business Forum 1991; (winter): 23-24.
Abernathy W. Balanced scorecards make teamwork a reality. The Journal for Quality and Participation 1997; 20 (5): 58-59.
Anderson, E., Weitz B. The use of pledges to build and sustain commitment in distribution channels. Journal of Marketing Research 1992; 29 (Feb): 18-34.
Anderson J.C., Narus J. A. A model of distributor firm and manufacturer firm working partnerships. Journal of Marketing 1990; 54 (1): 42-58.
Armstrong J., Overton T. Estimating nonresponse bias in mail surveys. Journal of Marketing Research 1977; 14 (3): 396-402.
Bagozzi R.P. Causal Models in Marketing. New York: John Wiley 1980.
Berry L., Parasuraman A. Marketing services: competing through quality, New York: The Free Press 1991. Cadogan J. W., Diamantopoulos A., de Mortanges C. P. A measure of export market orientation: scale development
and cross-cultural validation. Journal of International Business Studies 1999; 30 (4): 689-707.
Cannon J., Perreault W. Buyer-seller relationships in business markets. Journal of Marketing Research 1999; 36 (4): 439-460.
Churchill G.A.Jr. A paradigm for developing better measures of marketing constructs. Journal of Marketing Research 1979; 16 (Feb): 64-73.
Churchill G. A. Jr. Marketing research: methodological foundations. Chicago: The Dryden Press 1995. Cooke, J.A. Metrics systems. Logistics Management Distribution Report 2001; 40(10): 45-49.
Cross E. M., Chaffin W. W. Use of the binomial theorem in interpreting results of multiple tests of significance. Educational and Psychological Measurement 1982; 42: 25-34.
Dwyer F., Schurr P., Oh S. Developing-buyer-seller relationships. Journal of Marketing 1987; 51 (2): 11-27. Einwiller S., Ingenhoff D, Schmid B. A model of trust and reputation in electronic commerce, in Proceedings from
the EMAC 32nd Conference, University of Strathclyde, Glasgow, 2003.
Fornell C.D., Larcker F. Evaluating structural equation models with unobservable variables and measurement errors. Journal of Marketing Research 1981; 18 (Feb): 39-50.
Ganesan S. Determinants of long-term orientation in buyer-seller relationships. Journal of Marketing 1994; 58 (April): 1-19.
Geyskens I., Steenkamp J.., Kumar N.. A meta-analysis of satisfaction in marketing channel relationships. Journal of Marketing Research 1999; 36 (2): 223-238.
Grewal R., Comer J., Mehta R. An investigation into the antecedents of organizational participation in business-to-business electronic markets. Journal of Marketing 2001; 65 (July): 17-33.
Hewett K., Bearden W. Dependence, trust, and relational behaviour on the part of foreign subsidiary marketing operations: implications for managing global marketing operations. Journal of Marketing 2001; 65 (Oct): 51-66. Jap, S. D. “Pie sharing” in complex collaboration contexts. Journal of Marketing Research, 2001; 38 (Feb): 86-99. Jap, S. D., Ganesan S. Control mechanisms and the relationship life cycle: implications for safeguarding specific
investments and developing commitment. Journal of Marketing Research 2000; 37: 227-245
Jöreskog K. G., Sörbom D. LISREL 8: Structural equation modeling with the SIMPLIS command language. Hillsdale NJ: Lawrence Erlbaum Associates 1993.
Kaplan R. S., Norton D. The balanced scorecard - measures that drive performance. Harvard Business Review 1992; 70 (1): 71-79.
Kaplan R. S., Norton D. The balanced scorecard. Cambridge, MA: Harvard Business School Press 1996. Kaplan R. S., Norton D. The strategy-focused organization: how balanced scorecard companies thrive in the new
business environment. Cambridge, MA: Harvard Business School Press 2001. Kerr S. The best-laid incentive plans. Harvard Business Review 2003; 81 (1): 27-37.
Klein L., Quelch J. Business-to-business market making on the Internet. International Marketing Review 1997; 14 (5): 345-361.
Kumar N., Scheer L. K., Steenkamp J. E. The effects of supplier fairness on vulnerable resellers. Journal of Marketing Research 1995; 32 (1): 5-65.
Lages, C., Lages, C. R., Lages, L. F., The RELQUAL scale: A measure of relationship quality in export market ventures. Journal of Business Research, 2005; 58(8), 1040-1048.
Lages L. F., Fernandes J. The SERPVAL scale: A multi-item instrument for measuring service personal values. Journal of Business Research, forthcoming.
22
Lages L.F., Jap S. D. The relationship among past performance, marketing mix adaptation, and current export performance improvement in global marketing relationships, in Joep W.C. Arts, Sumitro Banerjee & Jeroen L. G. Binken, Global Marketing 2003, Marketing Science Institute Report No. 03-116, 97-98.
Lages L.F., Lages C. R. The STEP scale: a measure of short-term export performance improvement. Journal of International Marketing 2004; 12 (1): 36-56.
Lemon K.N., White T.B., Winer R.S. Dynamic customer relationship management: incorporating future considerations into the service retention decision. Journal of Marketing 2002; 66, 1-14.
Likierman A. Ideas and practice - why ‘academic’ should not mean ‘irrelevant’,” in Keynote Speech at the 2004 Conference of the Performance Measurement Association, Centre for Business Performance, Edinburgh, UK: Performance Measurement Association.
MacKenzie S. B., Podsakoff P. M., Rich G. A. Transformational and transactional leadership and salesperson performance. Journal of the Academy of Marketing Science 1999; 29 (2): 115-134.
Melnyk, S.A.,Christensen R.T. Value-driven process management: using value to improve processes. Hospital Materiel Management Quarterly 2000; 22 (1): 59-67.
Melnyk, S.A., Stewart D.M., Swink M. Metrics and performance measurement in operations management: dealing with the metrics maze. Journal of Operations Management 2004; 22 (3): 209-217.
Meyer, J., Allen, N., Smith, C. Commitment to organizations and occupations: extension and test of a three-component conceptualization. Journal of Applied Psychology 1993; 78 (4): 538-551.
Moorman C., Deshpandé R., Zaltman Factors affecting trust in market research relationships. Journal of Marketing 1993; 57 (Jan): 81-101.
Morgan R.M., Hunt S.D. The commitment-trust theory of relationship marketing. Journal of Marketing 1994; 58(3): 20-38.
Morgan R., Hunt S. An interview with Dr. Rob Morgan & Dr. Shelby Hunt, 2003, in http://www.incites.com/papersMMorgan_n_Hunt.html (accessed 5- 01-2004).
MSI (2004), http://www.msi.org/msi/rp0204.cfm#Overview.
O´Keefe R., O´Connor G., Jung H. Early adopters of the Web as a retail medium: small company winners and losers. European Journal of Marketing 1998; 32 (7/8): 629-643.
Parasuraman, A., Zinkhan G. (2002). Marketing to and serving customers through the Internet: an overview and research agenda”, Journal of the Academy of Marketing Science 2002; 30 (4): 286-295.
Parasuraman A., Zeithaml V., Malhotra A. E-S-QUAL– A multiple-item scale for assessing electronic service quality. Journal of Service Research 2005; 7 (3): 213-233.
Peppers D., Rogers M. Enterprise one-to-one: tools for competing in the interactive age, Doubleday, N.Y 1997. Peppers D., Rogers M. Is your company ready for one-to-one marketing? Harvard Business Review 1999; (Jan-Feb):
151-160.
Podsakoff P. M., Organ D. W. Self-reports in organizational research: problems and perspectives. Journal of Management 1986; 12(4): 531-44.
Reichheld F., Sasser W. Zero defections: quality comes to services, Harvard Business Review 1990; 68 (Set-Oct): 105-111.
Roberts K., Varki S., Brodie R. Measuring the quality of relationships in consumer services: an empirical study. European Journal of Marketing 2003; 37 (1/2): 169-196.
Singh, J. Performance productivity and quality of frontline employees in service organizations, Journal of Marketing 2000; 64 (Apr): 15-34.
Sirdeshmukh. J. Singh. J., Sabol B. Consumer trust, value, and loyalty in relational exchanges. Journal of Marketing 2002; 66 (Jan): 15-37.
Smith. M., Bailey J., Brynjolfsson E. Understanding digital markets: review and assessment”. eBusiness Center, MIT-Sloan School of Management, March 1999, paper 140, http://ebusiness.mit.edu.
Varadarajan P.R., Yadav M. Marketing strategy and the Internet: an organizing framework. Journal of the Academy of Marketing Science 2002; 30 (4): 296-312.
Weiber R., Kollman T. Competitive advantages in virtual markets – perspectives of information-based marketing in cyberspace. European Journal of Marketing 1998; 32 (7/8): 603-615.
Yau O., McFetridge P., Chow R., Lee J., Sin L., Tse A. Is relationship marketing for everyone? European Journal of Marketing 2000; 34 (9/10): 1111-1127.
Zeithaml V.A., Berry L.L., Parasuraman A. The behavioral consequences of service quality. Journal of Marketing 1996; 60: 31-46.
23
TABLE 1: THE B2B-RP SCALE
Scale Dimensions and Items, Reliabilities, and Variance Extracted
Please rate your agreement with each of the following statements,
regarding your relationship with PMElink.pt (the supplier): α / ρvc(n) / ρ
RPP: Relationship Policies and Practices .81/.61/.82
(Adapted from Sirdeshmukh, Singh, and Sabol, 2002)
V1 The supplier has polices that show respect for the customer V2 The supplier has practices that make solving problems easy V3 The supplier solves my firm’s problems quickly
RCO: Relationship Commitment .86/.69/.87
(Adapted from Anderson and Weitz, 1992)
V4 Our relationship with the supplier is a long-term partnership
V5 We would not drop the supplier because we like being associated with it V6 We want to remain as a customer of the supplier because we have pride
in being associated with a firm that carries a technological image
TRUST: Trust in the Relationship .91/.78/.91
(Adapted from Morgan and Hunt, 1994) In our relationship, the supplier ...
V7 ... is someone to whom I give my confidence V8 ... has high integrity
V9 ... gives us reliable information and advice
MCO: Mutual Cooperation .82/.71/.83
(Adapted from Hewett and Bearden, 2001) V10 My firm and the supplier regularly interact
V11 There is an open communication between our firms
SAT: Satisfaction with the Relationship .88/.71/.88
(Adapted from Cannon and Perreault, 1999) V12 Overall, we are satisfied with the supplier
V13 We are pleased with what the supplier does for us
V14 If we had to do it again, we would still choose to use the supplier
Notes:
α = Internal reliability (Cronbach, 1951);
ρvc(n) = Variance extracted (Fornell and Larcker, 1981)
ρ = Composite reliability (Bagozzi, 1980);
All items are 7 point-likert scales anchored by “Strongly Disagree” and “Strongly Agree”.
24
FIGURE 1: THE B2B-RP SCALE
CFA Standardized Coefficients for Higher Order Model
25
FIGURE 2: THE B2B-RELPERF SCORECARD
CUSTOMER OBJECTIVE
SUBJECTIVE METRICS YEAR YEAR
DESCRIPTION METRICS RELATIONSHIP PERFORMANCE DIMENSIONS RELATIONSHIP PERFORMANCE Y-1 Y+1
RPPScore: RCOScore: TRUSTScore: MCOScore: SATScore: RP weight
Objective metric # Ranking# 3 item average X weight (%) 3 item average X weight (%) 3 item average X weight (%) 2 item average X weight (%) 3 item average X weight (%) RPScore X to overall relationships perform.(%) = RPWeightedScore Base(s) ## Goal(s) ## Priority## Customer1 _____ ____ ____ ___ X ___ ___ X ___ ___ X ___ ___ X ___ ___ X ___ _______ X _______ = _______ ______ _____ _____ Customer2 _____ ____ ____ ___ X ___ ___ X ___ ___ X ___ ___ X ___ ___ X ___ _______ X _______ = _______ ______ _____ _____ Customer3 _____ ____ ____ ___ X ___ ___ X ___ ___ X ___ ___ X ___ ___ X ___ _______ X _______ = _______ ______ _____ _____ Customern ... ... …. ... ... ... ... ... ... ... ... ... ... ... Sum= RELPERFScore Notes:
RP Score = RP1WeightedScore + RP2WeightedScore + RP3WeightedScore + RP4WeightedScore + RPnWeightedScore RPScore =RPPScore + TRUSTScore + RCOScore + MCOScore + SATScore
Legends:
RELPERFScore=Overall Relationships Performance.
RPP= Relationship Policies and Practices; RCO= Relationship Commitment; TRUST= Trust in the Relationship; MCO= Mutual Cooperation; SAT= Satisfaction with the Relationship.
# This column should be repeated according to the number of existing objective performance metrics (e.g. sales volume, profit, costs).
If more than one objective metric is available, a final ranking of relationship performance should be created while taking into consideration different weights for each metric.
## These fields should take into consideration the RPWeightedScore and (if possible) existing objective metric(s).
26