Sebastião Santos, Ana Catarina Ferreira
(editores)
TICYUrb · vol. V
MetaCity
TICYUrb · Proceedings of the Third International Conference of Young Urban Researchers. Vol. V
MetaCity
TICYUrb · Proceedings of the Third International Conference of Young Urban Researchers
Vol. I
CollectiveCity: The Right to the City: 50 Years Later
(organizado por Manuel Garcia-Ruiz, Carolina Henriques e Henrique Chaves)
Vol. II
TransfearCity: In-security, Migrations and Racism
(organizado por Manuel Garcia-Ruiz e Henrique Chaves)
Vol. III
ProductCity: The City as a Product
(organizado por Manuel Garcia-Ruiz)
Vol. IV
Divercity: Diversity in the City
(organizado por Ana Oliveira e Manuel Garcia-Ruiz)
Vol. V
MetaCity: Ways of Thinking and Making Ciity
(Organizado por Sebastião Santos e Ana Catarina Ferreira)
Vol. VI
UCity: Utopias and Dystopias
(organizado por Carolina Henriques)
Vol. VII
FractalCity: The City Amid Policies
Sebastião Santos, Ana Catarina Ferreira (editores)
TICYUrb · Proceedings of the Third International Conference of Young Urban Researchers. Vol. V
MetaCity
ways of thinking and making city
Egess Tiri
Brian Moran
Sara Daugbjerg
Ane Vierø
Joumana Stephan
Rodrigo Almeida
Barbara Siqueira
Laini Santos
Renato Saboya
Catarina Pinheiro
Hulya Ertas
Burak Pak
Bruna Pontes
Mariely Luz
Marluce Venâncio
Vítor Ferreira
Júlio Suzuki
Bruno Lázaro
Maria Lígia Chuerubim
Guilherme Fest
Paulo Junior
Lisboa, 2018
© Sebastião Santos, Ana Catarina Ferreira (eds), 2018.
Sebastião Santos, Ana Catarina Ferreira (eds), 2018. MetaCity. Ways of thinking and making city
Primeria edição: Novembro 2018
ISBN: 978-972-8048-35-8
Composição (em caracteres Palatino, corpo 10) Conceção gráfica e composição: Marta Almeida Santos Capa: Marta Almeida Santos
Imagem da capa: Marta Almeida Santos
Reservados todos os direitos para a língua portuguesa, de acordo com a legislação em vigor, por Sebastião Santos, Ana Catarina Ferreira
Contactos:
ISCTE, Instituto Universitário de Lisboa, Av. Das Forças Armadas, 1649-026 Lisboa Tel.: +351 217903000 • Fax: +351 217964710 E-mail: [email protected]
VI
Index
IntroductionSebastião Santos & Ana Catarina Ferreira ………...……… 1
1. Open Data Quality – An assessment of housing data for Dublin and Ireland
Egess Tiri, Brian Moran ………...….. 4
2. The tree-map
Sara Daugbjerg, Ane Vierø ……….………. 14
3. Complexity Thinking: A New Systemic Language towards Sustainable Urban Cohesion, the Case of Horsh Beirut
Joumana Stephan ……….………. 25
4. From Heritage Interpretation to Cultural Systems: Outline of an urban semiotics of culture
Rodrigo Almeida ………...………. 42
5. Interpretações sobre o espaço cotidiano: A noção e o tratamento de espaço nos estudos de segregação
Interpretations on everyday space: The notion and treatment of space in segregation studies
Barbara Siqueira, Laini Santos, Renato Saboya ………...……….. 59
6. Contributo da deteção remota para o estudo da evolução espaciotemporal de áreas urbanas: o caso de Braga e Guimarães
Contribution of remote detection to the study of urban areas space-time evolution: the case of Braga and Guimarães
Catarina Pinheiro ………..…………...………. 76
7. What is Commons Architecture?
Hulya Ertas, Burak Pak ………...……..……… 96
8. O Trem e a Comunidade: Instrumentos Reabilitadores do Espaço
The Train and the Community: Instruments for Space Rehabilitation
Bruna Pontes ………...………...……….….…… 106
9. Pelas Mãos Latino Americanas: a atuação de arquitetos-urbanistas em assentamentos precários
By the Latin American Hands: the performance of urban-planning architects in precarious settlements
VII
10. Agricultura, agroecologia e ruralidades na cidade: Experiências de São Paulo e Bogotá
Agriculture, agroecology and ruralities in the city: Experiences of São Paulo and Bogotá
Vítor Ferreira, Júlio Suzuk ………...……….……… 154
11. Reflexões Urbanísticas e Ambientais sobre a Área Industrial de Uberlândia/MG, Brasil, por meio da aplicação de Geotecnologias
Urban and Environmental Reflections on the Industrial Area of Uberlândia/ MG, Brazil, through the application of Geotechnologies
Bruno Lázaro, Maria Chuerubim ………...……...………….……… 170
12. São Paulo as ‘urban rivers’ metacity? Dystopias of a developmental industrialist model
VIII
Figures and Tables Index
Figures
1.1 Open data scheme, 5star ranking ..……….…………..……… 6
1.2 Six Primary Definitions of Data Quality …...……….. 7
1.3 CSO Dataset ……… 9
1.4 Housing Department Dataset ……….. 9
1.5 ESB Connections Dataset ……….……….. 9
1.6 Planning Department Dataset ……….. 9
1.7 R code for Null values ………..…….……….. 9
1.8 R code for numeric values ……….……….. 9
1.9 Ranking of quality metrics for housing data in Ireland ……….……… 10
1.10 Understanding data quality control process ………..………….. 11
2.1. A print screen of the tree-map with the edited inputs from the local citizens (symbolised with green dots) (Københavns Kommune, 2017c).……….……… 15
2.2 A comparison of different classifications for public participation (Danielsen & Wøhlk, 2012). …………. 17
2.3 Peng’s taxonomy of web-based public participation systems (Peng, 2001). ……… 18
2.4 (Københavns Kommune, n.d.b.) ………...………….……… 20
3.1 Aerial photo of Horsh Beirut and its bordering neighborhoods (Badaro, Chiah and Qasqas). Photo source: Regional Holcim Awards 2014 for Africa Middle East ………...………..… 27
3.2 Percentage of park visitors based on place of residence in each of the three bordering neighborhoods ….. 31
3.3 Major issues concluded from the pre-survey ……….……...…… 32
3.4 Confessional distribution around Horsh Beirut. Source: Shayya F., & Arbid G. (2010). At the edge of the city: reinhabiting public space toward the recovery of Beirut's Horsh Al-Sanawbar. Discursive Formations………..…..…… 33
3.5 How do you access Horsh Beirut?……….……….……… 34
3.6 How do you define Horsh Beirut? …….……….……….. 35
3.7 Do you feel like you being properly informed about the issues of your city? ……….. 35
3.8 Structural angle model of Horsh Beirut ……….………… 36
3.9 Functional angle model of Horsh Beirut ………..……….……… 37
3.10 Historical angle model of Horsh Beirut ………..……….……… 37
4.1 Analytical Categories of Survey to Heritage in Tomar ……….…...………. 46
4.2 Analytical Model for Meaning Dynamics ………. 50
4.3 Initial Display ………...………. 51
4.4 Display after 1000 ticks ………...………. 51
4.5 State Space of Modalities (%) with small median levels of social-influence ………..………. 51
4.6 State Space of Modalities (%) with high median levels of social-influence ………..………….…………. 52
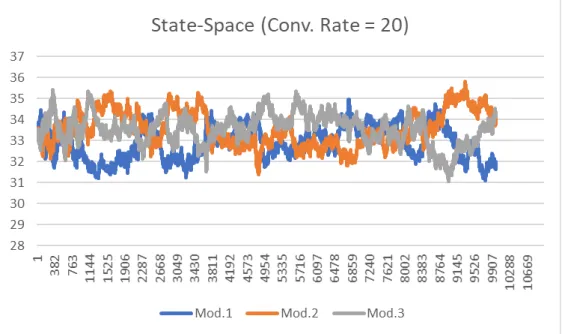
4.7 State Space of Modalities with agents following "Distinction" Strategy ……...……….….………. 53
IX
5.1 Modelo espacial da teoria de Kohl, Burgess e Hoyt, Cunha (2015) adaptado pelos autores ……… 60
5.2 Padrão de segregação socioespacial centro versus periferia. Rosemback et al (2009) …...…….……...….. 61
5.3 Mapa de Exclusão e Inclusão Social de São Paulo, 201 Sposati (1996) ………...…...…………. 63
5.4 Cumprimento das linhas e visibilidade dos espaços, Legeby (2013) …………...………...……… 64
6.1 Lógica dedutiva versus indutiva na análise das áreas urbanas, Adaptado de Bhatta (2013). ………...….. 78
6.2 Abordagem concetual para o estudo da dinâmica espaciotemporal das áreas urbanas, Adaptado de Herold et al. (2005). ……….………...……….………… 79
6.3 Modos de crescimento urbano captados pelo Landscape Expansion Index, Modificado de Liu et al. (2010) ...… 80
6.4 Classificação das freguesias do município de Braga e de Guimarães, segundo a tipologia de áreas urbanas do Instituto Nacional de Estatística ……...………...……….………… 82
6.5 Observação de Braga e Guimarães pelo Landsat (1984-2016) …………..………...………….………… 84
6.6 Crescimento Urbano em Braga e Guimarães (1984-2016) ……….……...……….………… 85
6.7 Modo de crescimento urbano em Braga (1984-2016) ……...………... 89
6.8 Modo de crescimento urbano em Guimarães (1984-2016) …...…...………....………... 90
8.1 Primeira Estação inaugurada em 1907 / Chegada do expresso “Asa Branca” na Estação Nova em 1977, Retalhos Históricos, 2018 ………...……….……. 108
8.2 O vagão da Locomotiva do forró (2016) / Estrutura interior do vagão durante o evento, Acervo pessoal, 2016………...………...……… 109
8.3 Situação atual da linha férrea de Campina Grande., Acervo pessoal, 2016. ………...………...… 109
8.4 1) Localização da Paraíba no Brasil; 2) Localização da cidade Campina Grande na Paraíba; 3) Localização da área de estudo em Campina Grande. Acervo pessoal, 2016. ……… 110
8.5 Mapa de Setorização da área de estudo, Acervo pessoal, 2016. ………...………...………. 112
8.6 Mapa Setorizado 1 e 2, Acervo pessoal, 2016 ………...……...……… 113
8.7 Imagens locais do fragmento 1, Acervo pessoal, 2016. ………..………...……… 113
8.8 Imagens locais do fragmento 2, Acervo pessoal, 2016. ………...……… 114
8.9 Mapa Setorizado 3 e 4, Acervo pessoal, 2016. ………...…..……….……… 115
8.10 Imagens locais dos fragmentos 3 e 4, Acervo pessoal, 2016 …..…...……… 115
8.11 Perspectiva e interior do vagão após o processo de recuperação, Al Borde, 2012. ……...………… 116
8.12 Esquema demonstrando as possíveis áreas e funções dos vagões do trem, Acervo pessoal, 2016. …….. 117
8.13 Programa indicando alguns dos usos propostos para o trem ………....….…….….…………..… 118
8.14 Mapa das áreas potenciais para parada do trem
,
Acervo pessoal, 2016. …...………...…….……… 1188.15 Perspectiva do vagão antes e depois da proposta de intervenção, Acervo pessoal, 2016. ...…...… 119
8.16 Ilustração em 3d da área detalhada na implantação, Acervo pessoal, 2016. ……..………….…...… 120
8.17 Representação de corte do vagão modificado em diferentes situações de uso, Acervo pessoal, 2016. .... 120
8.18 Diagrama de módulos utilizados como layout no vagão, Acervo pessoal, 2016. …..……….………..… 121
8.19 Ilustração em 3D da área detalhada na implantação, Acervo pessoal, 2016 ……….……… 122
9.1 Características dos assentamentos precários latino americanos. Autora elaborado a partir de Fernandes (2011). ………...………...…………...………. 137 9.2 A mudança de visão da arquitetura através de exposições. Imagem da esquerda - Goodwin apud Scottá
X
(2014); Imagem da direita - MoMA (s.d.). ………...…. 139
9.3 Graus e níveis de participação segundo Imparato e Ruster (2003). Elaborado pela Autora (2016). ...… 141
9.4 Apropriação dos moradores após construção do conjunto habitacional. ELEMENTAL (2007) …...… 143
9.5 Processo participativo no desenvolvimento da Esperanza Dos. Al Borde (2011). Créditos: Esteban Cadena …....………...………...………….... 145
9.6 Sistema de Teleférico do Complexo do Alemão, Rio de Janeiro (Brasil). Secretaria de Estado de Obras do Governo do Rio de Janeiro (2011) ………...……… 147
10.1 Espaço da horta, com destaque para o prédio da Faculdade de Medicina da Universidade de São Paulo (FMUSP). Fotografia nossa, realizada em 02 set. 2017 ………...……….…… 163
10.2 Entrada da Horta das Corujas. Apesar do portão, a entrada é livre para todas as pessoas. Fotografia nossa, realizada em 18 jan. 2018. ………...…………...………. 164
11.1 Representação da hierarquia metodológica utilizada para elaboração deste trabalho. Fonte: Autores, 2018 …....………...………...………….... 174
11.2 Localização do município de Uberlândia. Fonte: IBGE (2010). …………...………...…..…… 175
11.3 Localização geoespacial da Bacia Hidrográfica do Córrego do Liso. Fonte: Autores (2016). ……..….. 176
11.4 Variação da mancha urbana na área industrial de Uberlândia – MG/Brasil. De cima para baixo, da esquerda para a direita, imagens referentes aos anos de 2005, 2007, 2010, 2013, 2015 e 2017., Fonte: GoogleEarth Profissional. Modificado pelos autores (2017). …...………...……… 177
11.5 Mapa de variabilidade dos padrões de uso e ocupação do solo da área industrial de Uberlândia – MG/Brasil. Fonte: GoogleEarth Profissional. Modificado pelos autores. (2017). ……….. 179
11.6 Variação das áreas ocupadas pelos padrões de uso e ocupação do solo da região industrial de Uberlândia. Fonte: Autores (2017). ………...………..………… 180
11.7 Depósito clandestino de resíduos sólidos abaixo de uma ponte. Fonte: Autores (2015). …...…..…...…. 182
11.8 Assoreamento e poluição de cursos d’água na área de estudo. Fonte: Autores (2016). ………….…...… 183
11.9 Desprendimento de massas de terra e formação de voçoroca. Fonte: Autores (2016). ……...……….…. 183
11.10 Contaminação e poluição das áreas de preservação permanente. Fonte: Autores (2016). ……...…… 184
12.1 Depósito de materiais improvisado no Parque Linear Aricanduva, 2012.Soares, 2014 ...…..…... 196
12.2 Banheiro público do Parque Linear Canivete, com lançamento de efluentes no córrego, 2012.Soares, 2014 ...………...…………... 197
Graphs
6.1 Distância média à mancha urbana mais próxima em Braga e Guimarães (1984-2016) ………...…… 866.2 Evolução da área urbana (%) em Braga e Guimarães (1984-2016) ………...………. 87
6.3 Comparação dos modos de crescimento urbano em Braga e Guimarães (1984-2016) ……...………… 90
6.4 MEI em Braga e Guimarães (1984-2016) …………...………...……… 91
Tables
1.1 Datasets file format description ………..…………...……….………… 94.1 V3 values for a given Church ……..……….………. 48
4.2 Analytical Categories of Survey to Heritage in Tomar ……….……… 48
6.1 Tecido urbano em Braga e Guimarães (1984-2016) …………...……… 86
XI
6.3 Proporção do crescimento urbano (%) relativamente ao tecido urbano existente em Braga e Guimarães (1984-2016) ………...……… 88 6.4 Taxa de crescimento urbano anual em Braga e Guimarães (1984-2016) ………...……… 88 11.1 Variação quantitativa da área dos padrões de uso e ocupação do solo local. Fonte: Autores (2017). ….. 180 11.2 Síntese de impactos associados à variabilidade dos padrões de uso e ocupação do solo. Fonte: Autores (2017). ………..………...……….………...…. 184
1
Introduction
Sebastião Santos & Ana Catarina Ferreira
Metacity launched the challenge of reflecting on the ‘implicit’ and mostly ‘invisible’ drivers that influence urban transformation. The call asked participants to explore the nexus between scientific knowledge, political and economic actors and social mobilization in the production of contemporary urban space. Questions were raised: What concepts, methods and fields of knowledge – instituted or to be established – can and will inform urban development theory(s) and practice(s) in the near future? What types of urban knowledge are still considered legitimate and what is their relevance? How public policies, governance practices and development strategies had change cities and how can we re-think these instruments? What, after all, is the effective importance of political and social mobilization of urban scientists and technicians in the process of “making cities”? We were pleased to received several contributions from different disciplines and geographies that have shown these are cross-cutting issues on a global scale. Some of these contributions were collected in this book and we will briefly present their main subjects.
In the first paper, Egess Tiri and Brian Moran bring into focus the importance of evaluating the quality of information provided by open big data sources. Open Data Quality – An assessment of housing data for Dublin and Ireland presents an assessment of produced housing data for Dublin through the use of quality metrics. The authors explore the importance of assuring quality control over data in order to strength decision-making processes in a context of increased urbanization.
The tree-map introduces the topic of public participation in urban planning processes through the use of new technologies. Sara Daugbjerg and Ane Vierø seek to understand what constraints and potentials may result from the use of GIS as a tool to improve citizen participation in spatial planning. Their research findings emerge from the study of “an interactive online map”, launched by the Municipality of Copenhagen to support the process of selecting locations for new trees in the Danish city.
In Complexity Thinking: A New Systemic Language towards Sustainable Urban Cohesion, the Case of Horsh Beirut, Joumana Stephan bring forward fresh methods capable of expanding the comprehension of urban topics by presenting results on the application of complexity thinking to the study of the Horsh Beirut park.
For Rodrigo Almeida an “holistic ‘systems theory’” and Agent Based Models can help us to disentangle the complexity of urban phenomena. In From Heritage Interpretation to Cultural Systems: Outline of an urban semiotics of culture, the author explores the potential of applying these theoretical and methodological tools to the study of urban heritage in the Portuguese city of Tomar.
2
In Interpretations on everyday space: The notion and treatment of space in segregation studies Barbara Siqueira, Laini Santos and Renato Saboya take us on an epistemological journey to spatial segregation studies. Drawing attention on the importance of bridging qualitative and quantitative methodologies, they envision new paths to capture the multidimensional and multi-scalar features of spatial segregation embedded not only in space but also in everyday life.
Catarina Pinheiro, in Contribution of remote detection to the study of urban areas space-time evolution: the case of Braga and Guimarães, presents relevant insights on the processes and patterns that characterize the evolution of urban morphologie (Braga and Guimarães) through the use of geographic information systems and remote sensing techniques.
Hulya Ertas and Burak Pak assume their reflection of architecture and architectural practices as a “manifesto”. In What is Commons Architecture?, the authors claim for a “critical practice of social (re)production of space”, giving us some clues to operationalize it. Yet, they consider that this “operative framework for commons architecture” is open to debate, calling for the “co-ideation” of the concept.
In The train and the community: Space Rehabilitators Instruments, Bruna Pontes addresses the issue of urban obsolescence and regeneration. The author presents a proposal for an under-used infrastructure – the railway and the train of Campina Grande, a Brazilian city – drawing on the practices, needs and memories of the local community.
Mariely Luz and Marluce Venâncio reflect on the role of architects/urbanists in facing housing and services precarity and resource scarcity in latin-american cities. The authors’ paper, By The Latin American Hands: the performance of urban-planning architects in precarious settlements, focuses on urban interventions designed by three architecture studios based on Chile, Ecuador and Brazil.
In Agriculture, agroecology and ruralities in the city: Experiences of São Paulo and Bogotá, Vítor Ferreira and Júlio Suzuki stress out the importance of urban agriculture as an emergent ‘ground of practices’ that may change the actors, the dimensions and the scales by which cities, such as São Paulo and Bogotá, are being toughed and transformed and how this relates to the ‘right to the city’ today.
Bruno Lázaro and Maria Lígia Chuerubim return to the subject of geotechnologies’ use in urban analyses. In Urban and Environmental Reflections on the Industrial Area of Uberlândia/ MG, Brazil, Through the Application of Geotechnologies, the authors explore the potential of this method through the analyse of land uses’ transformations in the industrial area of a municipality located in the Brazilian state of Minas Gerais, and relate them with social and environmental changes in the region.
In São Paulo as ‘urban rivers’ metacity? Dystopias of a developmental industrialist model, Guilherme Fest and Paulo Junior reflect on the impacts of historic and current urban development models/projects in the city of
3
São Paulo. Considering the city transformations along its water courses, they point out the rising of dystopic urban realities and the need for an integrated and collective approach to urban future transformation.
An overview of the contributions leads us to consider the existence of common grounds on the problems approached regarding the need of curbing existing gaps between knowledge, practices, society and the processes of spatial transformation: the identification of breaches between spatial planning practices and urban changes/community aspirations and how these practices can become more inclusive at different scales; the potentialities and limitations of new technologies in helping to fulfil this purpose or to expand the understanding of urban phenomena; the role of theories and methods that can be mobilized to disentangle today’s urban complexity and to broaden the perspectives on the multidimensionality of urban problems; the questioning of contemporary architectural practices and the need to amplify their social significance/proximity by adopting a more collective approach in the process of thinking and building space.
The authors gave us interesting insights on these issues. We hope they can stimulate the readers for further investigations. To watch the TICYUrb’18 sessions where the papers were discussed, please see here.
4
Open Data Quality – An assessment of housing data for Dublin and Ireland
Egess Tiri | [email protected]
Maynooth University, National Centre for Geocomputation
Brian Moran | [email protected]
Maynooth University, National Centre for Geocomputation
Abstract
Smart cities are using open big data to inform and engage citizens on the current situations in their city and also enabling city managers to better operate public services by improving their decision making through the sharing of information in real-time. City dashboards are considered a critical infrastructure in communicating this information to the users. In this context, Dublin Dashboard, with the primary focus to be a tool for interacting with urban data, is a collection of real-time and non-real-time data for Dublin City. Although there is a huge amount of data circulating, and the importance of reporting data quality is known through different ISO and city standards, there is little assurance on their quality and standards. In this research paper, we are focusing on the quality assessment of housing data by reviewing their current state for Dublin and Ireland with the purpose of looking at how that affects policy makers in the process of increasing urbanization.
By questioning the provenance of the data and asking what are the known issues that Ireland is experiencing with the current state of housing, we are looking into many datasets from different sources for their Usability, Accuracy, Completeness and Metadata. Testing the above specifications, we are seeing how the results differ from one area to another and how these data have affected decision making in construction sector and as a result, the quality of life of the city. We extend our discussion by highlighting the importance of improving metadata around data quality.
Keywords
Open Data, Data Quality, Dashboards, Smart Cities.
Introduction
City governors, policy makers and citizens make their short term, mid-term and long term decisions on the huge amount of data being produced on daily basis from different sources. While lots of information has been produced, yet there was a need to display information on ease to interpret gauges, traffic light colours, meters, arrows, bar charts and graphs (Few, 2006). City dashboards are seen as providing present and future critical infrastructure for the smart city, enabling city managers to efficiently and effectively operate a range of urban services in real-time, formulate evidence-based policy and create better city plans through simulating city developments and empowering citizens and businesses by sharing information that will facilitate participation, improve quality of life and foster entrepreneurship (Batty, 2015, pp. 29-32). Just as a car dashboard provides
5
critical information needed to operate the vehicle at a glance, indicator dashboards provide key information on managing systems, companies or cities (Rivard & Cogswell, 2004)
Following the same framework, Dublin Dashboard1 has been developed by researchers using open source tools.
Dashboards developed commercially have strict rules governing the format of the data. A substantial monetary and time investment is required for cities to produce data to work with commercial applications. This is not the case with the Dublin Dashboard and it can therefore be replicated by others to produce an urban dashboard without large development or maintenance costs or the inclusion of city personnel. (McArdle & Kitchin, 2016, pp. 19-25)
Developed in 2014 by researchers from the Programmable City project in Maynooth University, working in collaboration with Dublin City Council it provides citizens, city officials, public sector workers and companies with real-time information, time-series indicator data, and interactive maps about all aspects of Dublin city.
“The Building city dashboards (BCD) project seeks to determine how to build more extensive and effective city dashboards. It aims to develop new tools that extend beyond data visualisation tools to provide robust data analysis and decision support frameworks that can be used by experts and citizens alike.”2 The project is organised in three work packages which will, respectively, answer questions about three sets of fundamental problems: data quality and standards; visualization and interaction issues; and analytics/modelling issues. In this paper we will focus mainly on the quality of the data being produced and shared with the purpose of increasing citizen participation and improving governance decisions.
“A smart city is one that strategically uses information and communications technology, big data and data analytics to improve existing city services and create new services, engage citizens, foster sustainability and resilience, solve urban issues and stimulate innovation and grow the local economy. (McArdle & Kitchin, 2016, pp. 19-25). But are the information technologies and open big data really leading us towards a smart city? Is the data being generated really smart data? And what makes big data, smart data?
Quality of the data
Many studies have been carried out around quality of the data where researchers have been trying to bring definitions of what are qualitative data. The traditional definition of quality is based on the viewpoint that products and services must meet the requirements of those who use them. (Montgomery, 2009). Also, (Wang & Strong, 1996) have defined quality as “fitness for use”; (Alexander, Tate, & Ted, 1999, p. 156) defined six quality criteria for web data: authority, accuracy, objectivity, currency, coverage/audience, and interaction. Many international standards have been developed, for instance ISO 19115-1:2014 which give mandatory metadata fields for spatial data. (Garvin, 1987) described eight dimensions of quality:
1 http://www.dublindashboard.ie/pages/index#
6
- Performance (Will the product do the intended job?) - Reliability (How often does the product fail?) - Durability (How long does the product last?) - Serviceability (How easy is to fix the product?) - Aesthetics (What does the product look like?) - Features (What does the product do?)
- Perceived quality (What is the reputation of the company or its product?) - Conformance to standard? (Is the product as per design draw?)
City dashboards operate as a collection of open big data, and in this context “Open Knowledge Foundation” has given the definition of open data: “Open data are the building blocks of open knowledge. Open knowledge is what open data becomes when it’s useful, usable and used”3. Also, Open Knowledge Foundation has given a 5 star ranking of data formats in terms of openness and reusability. (Fig. 1)
Figure 1. Open data scheme, 5star ranking
(Ochoa & Duval, 2006) have given a set of quality metrics:
- Completeness: a record is considered complete if it contains all the information required to represent it - Accuracy: how accurate the record represents the model
- Richness of information: vocabulary terms should be meaningful to use - Readability: to which extent a record is accessible
3 https://okfn.org/opendata/
7
Also, Dama UK Working Group has published a paper where they describe the six primary dimensions for data quality4 (Figure 2), along with their definitions and related dimension for each core ones, as follows:
• Completeness - The proportion of stored data against the potential of "100% complete" o Related Dimension – Validity and Accuracy
• Accuracy - The degree to which data correctly describes the "real world" object or event being described.
o Related Dimension - Validity
• Timeliness - The degree to which data represent reality from the required point in time. o Related Dimension - Accuracy
• Validity - Data are valid if it conforms to the syntax (format, type, range) of its definition o Related Dimension - Accuracy, Completeness, Consistency and Uniqueness
• Consistency - The absence of difference, when comparing two or more representations of a thing against a definition.
o Related Dimension - Validity, Accuracy and Uniqueness
• Uniqueness - Nothing will be recorded more than once based upon how that thing is identified o Related Dimension - Consistency
Figure 2. Six Primary Definitions of Data Quality
On the other hand, it is very important to understand the quality control process. In the context of a smart city, we need to have a level of assurance of quality assessment and how can we make sure that the data produced are reliable. Adding to the above metrics, we look at the metadata of each dataset. Metadata are data about data, which give details about the source, author, description etc. If all the metadata fields are filled, it makes the dataset more accessible and usable for other users. As we will show below, in many cases, we have no metadata at all for published datasets, which has made the entire dataset less reliable.
Following these rules and standards we are doing a quality check on the open source housing data for Ireland.
4 https://www.whitepapers.em360tech.com/wp-content/files_mf/1407250286DAMAUKDQDimensionsWhitePaperR37.pdf Quality Completeness Accuracy Timeliness Validity Consistency Uniqueness
8
Current status of housing in Ireland
Ireland experienced a housing bubble in the 1990’s and 2000’s where the average price of a house increased 251%. (Marion, 2010). Caused by an increase in the availability of finance, the move to monetary union which lower interest rates and also financial liberalisation (Fitzgerald & Conefrey, 2010, pp. 211-299). The bubble was driven by a combination of financial conditions (liberalisation within the banking sector and low interest rate environment), buoyant housing markets and a massive expansion of the mortgage markets which led to large increases of personal mortgage indebtedness. 5 Unemployment rate fell to the lowest in Europe, with the number
of people working increasing from 1.165 million to 2.139 million (CSO, 2010). Between 1991 and 2011 the population grew by 1.055 million to just over 4.5 million (a 29.9% increase). Between 1991 and 2007 the average new house prices rose by 429% in Dublin and 382% for the whole country. As the private property market boomed, the state continued to disinvest in social housing, between 1961 and 2006 the proportion of social housing stock fell from 18.4% to 7.2% (CSO, 2002. CSO 2009) Driven by unsustainable residential construction, the scale of construction output grew to an unprecedented 25% of GNP in 2006 before dropping to 6.4% of GNP in 2012 (Dept. of Housing, 2018)
Housing supply contracted sharply from late 2007, with number of new dwelling falling by over 90% between 2006 and 2013. (Dept. of Housing, 2018). During the boom little social housing was built and what was constructed was generally replacement stock of poor quality units, funded through public private partnerships. Ireland’s population increased by 3.7% between 2011 and 2016 (CSO, 2016) whereas the housing stock grew by just 8,800 (0.4%) between 2011 and 2016, in sharp contrast to the growth of 225,232 dwellings between 2006 and 2011. 6 Ireland’s economy grew by 5.1% in 2016. 7 7.8% in 2017 and is forecast to grow by 4.8% in 2018. 8
This has led to housing demand outstripping supply in recent years, manifesting in stronger growth in house prices and rents, with such increases being especially pronounced in Dublin and the surrounding commuter counties. This has impacted the country socially and economically; through challenges to the provision of social housing, an increase in homelessness and constraining competitiveness.
Case study
Dublin dashboard is a collection of real time and non-real time data into a single web platform. Data published on this platform are being produced by local authorities, census data and/or generated data from different sensors around the city. Although produced under certain standards, yet we are unable to give assurance in terms of veracity. This has led us to run a quality check on the open housing data for Ireland by applying the above mentioned quality metrics into these datasets and see how do they rank in terms of usability, accuracy, completeness and metadata. The generated datasets we are looking into come from: CSO (Central Statistics Office), Department of Housing, ESB Connections, and Planning Department. These are all open data sets that the building city dashboard project have access to. We use the R programming language, which is a free
5https://www.oecd-ilibrary.org/economics/has-the-rise-in-debt-made-households-more-vulnerable_352035704305
6https://www.cso.ie/en/csolatestnews/pressreleases/2017pressreleases/pressstatementcensus2016resultsprofile1-housinginireland/ 7 https://www.cso.ie/en/releasesandpublications/er/nie/niear2016/
9
software programme for statistical computing and graphics, in most of the analysis in the project.
In our analysis, we first look at the file formats of each dataset as part of the usability metrics.
Dataset Source CSO Housing Department ESB Planning Department
File Format CSV GEOJSON XLSX XLSX
Table 1. Datasets file format description
Furthermore, as part of usability metric, we look of how the data are formatted. In the following figures we are giving examples of each dataset (Figure 3; Figure 4; Figure 5 and Figure 6)
Figure 3. CSO Dataset
Figure 4. Housing Department Dataset
Figure 5. ESB Connections Dataset
Figure 6. Planning Department Dataset
Then we continue our analysis by checking the accuracy and completeness metrics. We have generated an R code which automatically checks for Null values (missing fields) and if the values are numeric. Below we are giving some examples of the code used.
Figure 7. R code for Null values
Figure 8. R code for numeric values
The same code criteria have been used to measure the metadata quality. We are looking for broken links, missing fields and misspelling.
10
Within the open source dashboard framework these datasets are not fit for use, because they lack the necessary structure for further analysis.
Following on from our analysis, we have ranked these datasets in scales from 1 (the worst) to 5 (the best) for the above mentioned quality metrics (Figure 9).
Figure 9. Ranking of quality metrics for housing data in Ireland
Findings and recommendation
While the datasets are ranked as a three stars’ quality in terms of openness and readability, the opposite happens in terms of usability. Some of the issues identified include: the datasets are not structured making it difficult to be reprocessed and reused; numeric fields include many null values leading into interpretation errors and false assuming.
In a data driven society, the data should be machine readable, accessible, structured and reproducible by all users. Although there are many guidelines and standards, many open datasets contain discrepancies and missing information.
Each dataset represents a process, thus prior to data collection, it is crucial to understand what the purpose of publishing these data is. Also, in terms of consistency, a definition of semantic attributes has to be made, prior to the data gathering, alongside its fitness for use.
Our view on data quality control consists in a process with three main steps, starting with Data Collection, followed by Data Analysis to, then, be finalised with Open Data (Figure 10). We suggest that in order to have an accurate data collection process, we can prevent errors and misleading information by applying good policies, guidelines and templates. Then, the process should be followed by standardized data entry and storage and
0 1 2 3 4 5
CSO Housing Dept ESB Planning dept
11
stepping in the last phase where prior than publishing these data online, the quality check has to go through automated tools and analysis which will be the cure for the quality control.
Figure 10. Understanding data quality control process
This is a research in progress and for the future we are looking into designing guidelines of how to best collect, store and process big data in a data driven environment.
Acknowledgment
"This publication has emanated from research conducted with the financial support of Science Foundation Ireland (SFI) under Grant Number 15/IA/3090."
Bibliography
Alexander, J., Tate, M., & Ted, L. (1999). Web wisdom: how to evaluate and create information quality on the Web. Program Electronic Library and Information Systems, 156.
Arnstein, S., & Sherry, R. (1969). A ladder of citizen participation. Journal of the American Planning Association, 216-224.
Baack, S. (2015). Datafication and empowerment: How the open data movement re-articualtes notions of democracy, participation and journalism. Big data & Society.
Batty. (2015). A perspective on city dashboards. Regional Studies, Regional Sciences, 29-32.
Brunsdon, C. (2017). Quantitative methods III: Scales of measurement in quantitative human geography. Progress in Human Geography.
• Policies • Guidelines • Templates
Data
Collection
• Standardized Data Entry • Standardized Data StorageQuality
Analysis
• Automated Tools • Data AnalysisOpen Data
12
Brunsdon, C., & Charlton, M. (2011). An assessment of the effectiveness of multiple hypothesis testing for geography anomaly detection. Environment and Planning B: Planning and Design, 216-230. Cai, L., & Zhu, Y. (2015). The challenges of Data Quality and Data Quality Assessment in the Big data era. Data
Science Journal, 2.
Dept. of Housing, P. a. (2018). National Risk Assessment.
Eisenacher, M., Schnabel, A., & Stephan, C. (2011). Quality meets quantity - quality control, data standards and repositories. Proteomics, 1031-1036.
Few, S. (2006). Information Dashboard Design: The effective visual communication of data. Sebastopol: O'Reilly.
Fitzgerald, J., & Conefrey, T. (2010). Managing Housing Bubbles in Regional Economies under EMU. National Institute Economic Review Vol. 211, 211-299.
G, M., & R., K. (2016). The Dublin Dashboard: Design and development of a real-time analytical urban dashboard. 1st International Conference on Smart Data and Smart Cities (pp. 19-25). Split, Croatia: ISPRS Annals of the Photogrammetry, Remote Sensing and Spatial Information Sciences.
Garvin, D. (1987). Competing on the eight dimensions of quality. Harvard Business Review.
Hearne, R., Murphy, M., Haughan, P., Richardson, E., & Twomey, K. (2018). Investing in the right to a Home: Housing, HAPs and HUBs.
Helfert, M., & Mouzhi, G. (2016). Big data quality - Towards an explanation model in a smart city context. Iciq 2016.
Ireland, R. (2018). Review of Delivery Costs and Viability for Affordable Residential Development.
Lee, J., & Kang, M. (2015). Geospatial Big data: Challenges and Opportunities. Big Data Research, 74-81.
Marion. (2010). The local geographies of the financial crisis.
McArdle, G., & Kitchin, R. (2016). Improving the veracity of open and real-time urban data. Built Environment, 457-473.
13
McArdle, G., & Kitchin, R. (2016). The Dublin Dashboard:Design and Development of a Real-Time Analytical Urban Dashboard. ISPRS Annals of Photogrammetry, Remote Sensing and Spatial Information, 19-25.
Montgomery, D. (2009). Introduction to statistical quality control. John Wiley & Sons Inc.
Neumaier, S., Umbrich, J., & Polleres, A. (2016). Automated Quality Assessment of Metadata across Open Data Portals. Journal of Data and Information Quality, 1-29.
Ochoa, X., & Duval, E. (2006). Towards Automatic Evaluation of Learning Object Metadata Quality. World Conference on Educational Multimedia, Hypermedia and Telecommunications, 372-381.
Reiche, K., Hofig, E., & Schieferdecker, I. (2014). Assessment and Visualization of Metadata Quality for Open Government Data. Conference for E-Democracy and Open Government (pp. 335-348). Austria: Edition Donau-Universität Krems.
Rivard, K., & Cogswell, D. (2004). Using Analytical Dashboards to cut through the clutter. DM Review, pp26 - 29.
Servigne, S., Lesage, N., & Libourel, T. (2010). Quality Components, Standards and Metadata. 179-210.
Wang, R., & Strong, D. (1996). Beyond Accuracy: What Data Quality means to Data Consumers. Journal of Management Information Systems, 5-33.
14
The tree-map
Sara Daugbjerg |
[email protected]
Roskilde University, Department of People and Technology
Ane Vierø |
[email protected]
Roskilde University, Department of People and Technology
Abstract
In the winter of 2017, the city council of Copenhagen asked citizens where to plant new trees using an interactive online map. The use of new technologies for public participation raises questions regarding who is able to participate and how the inputs are used in the planning process. Through the perspective of critical cartography, we raise questions regarding the use of maps as tools in planning practices, and how ‘Public Participation GIS’ can be used to make planning more inclusive and transparent. We conclude that using GIS for public participation can be problematic if citizens’ prerequisites are not considered in the design of the technical solution. For such methods to be inclusive, it presupposes an understanding of the potential pitfalls with using digital tools, as well as the potential benefits they offer. If done correctly, the use of GIS in public participation can be more inclusive and make the issues at hand more apprehensible and accessible.
Keywords
Urban Planning, Public Participation, GIS.
Introduction
The ‘tree-map’ was an online interactive map designed and published by the Municipality of Copenhagen as part of a larger political strategy to make the city greener and particularly to plant more trees (Københavns Kommune, 2017a). The number and location of trees are contested issues in Copenhagen which often receive a lot of public attention. Using GIS in the public participation process is a relatively new method in Copenhagen. The intention was that citizens should add points on the tree-map on locations where they wished for the municipality to plant more trees. The map was online for 2 weeks and received more than 32.000 wishes for new trees (Københavns Kommune, 2017a). The collected data were later used as part of the strategy for future tree plantings in the city with an overall political ambition to plant 100.000 trees by the year 2025 (Københavns Kommune, 2017b).
15
Figure 1. A print screen of the tree-map with the edited inputs from the local citizens (symbolised with green dots) (Københavns Kommune,
2017c).
Public participation is widely acknowledged as an important part of the planning process (Agger, 2007) and is also a central element within the planning practice in Copenhagen (Københavns Kommune, 2015a). Both scholars and public authorities agree that participation can lead to more democratic and inclusive processes where citizens are allowed to express their opinions (Agger, 2007; Københavns Kommune, 2015a). Citizens can furthermore contribute with local knowledge that politicians and planners do not have access to (Hansen, 2004). It is however not easy to design and conduct successful participatory processes, and planners in Copenhagen sometimes struggle with including all the citizens affected by the plans in question, and find it hard to incorporate citizens’ input in their work (Skab din by, 2012, p. 7). Because of these challenges, digital and online methods might have the potential to improve and innovate the participatory practices, leading to better outcomes for citizens, planners, and politicians. An example of such methods is Public Participatory GIS (PPGIS). PPGIS is a method for using GIS-technologies to enable citizens to collect, analyse and visualise spatial data, thereby giving citizens a stronger voice within knowledge production and improving their position in for example a planning process (Carver, 2001; Mukherjee, 2015).
The turn to digital methods for public participation reflects a broader societal tendency towards increased digitalisation in an attempt to handle increasing complexity and a constantly growing amount of available data and information (Larsen, 2002). This is coupled with a growing importance of spatial data, enabled by increasing access to technologies for collecting and using geolocated information, leading to a ‘spatially enabled society’ (Enemark & Rajabifard, 2011). The digitised and spatially enabled society is for example expressed in the growing importance of maps and spatial data in decision-making (Williamson et al., 2011; Enemark & Rajabifard, 2011). This development is also present in Copenhagen, where spatial data and GIS, according to
16
interviewees from the municipal administration, are gradually becoming more important both within the planning and government and in the municipality’s interaction with the city’s residents.
The use of the tree-map within the context of an emergent transformation of participatory processes incited our curiosity, leading to the research question: How is GIS-based public participation used in the Copenhagen City Council’s plan for planting trees, and which potentials and implications does the method give rise to for the planning practice? This question is based on the hypothesis that the digitalisation and introduction of GIS-technologies present many new possibilities for a renewed and improved participation process. Simultaneously, this technology poses challenges both to the planners, who need to have the sufficient skills to obtain the benefits in e.g. PPGIS, and to citizens, who vary in terms of their prerequisites for participating through digital technologies.
Methodology
This study was made in spring 2017 as a semester project at the department for geography at Roskilde University. Like the majority of the students at Roskilde University we both live in Copenhagen, and when the city council advertised the tree-map on Facebook we saw it as a possibility to explore our interests in GIS, critical cartography and planning processes. This was done through a case study of the tree-map, inspired by the methodology suggested by Gary Thomas. Thomas proposes the use of the terms subject and object when studying a case (Thomas, 2011). The subject is a concrete example of the studied phenomenon, here the tree-map and the municipality’s use of participatory GIS tools. The object is the overarching context used as the analytical framework to study the specific subject. In this study, we make use of ideas and perspectives from PPGIS, critical cartography and the concept ‘spatially enabled society’. Choosing to work with a case, we were therefore aware that it would not necessarily give us general knowledge about for example online participation. Instead it could provide us with a deeper insight into the municipal use of GIS and from here help us reflect upon the more general tendencies present in the chosen case (Thomas, 2011).
We studied the case while the city administration was finishing the plan and while the plan was waiting to be discussed by the city council. To get a better insight and knowledge about the case, besides from what we could gain from the municipal plans and documents (Københavns Kommune, 2017d; Københavns Kommune, 2016; Københavns Kommune, 2017a), we conducted three semi-structured interviews with city officials. One of the interviewees worked directly with the tree-planting plan and contributed an understanding of how such strategies are treated by the city administration and the city council. The second interviewee worked at the GIS department and had given technical support in the design of the tree map; she contributed an understanding of how the administration works with GIS and data. The third interviewee worked with digital strategies and shared his experience of working with GIS and participatory digital processes in the city administration.
The technical aspects of the map were analyzed with insights from critical cartography, critical GIS, and several taxonomies for participation.
17
Critical cartography states that map are not neutral representations or tools, but that they reflect the opinions and perceptions of the people who designed them (Moore & Perdue, 2014). A map is furthermore always designed to answer a specific question or communicate a specific message (Kitchin & Dodge, 2007). Maps should therefore be approached as rhetorical tools, which help shape discourses and decisions, not just as illustrations of an objective reality (Olesen et al., 2016; Brodersen, 2009). This approached to cartography and GIS was used to ask questions about how the city and the trees were visualized, what perceptions of the city the design entailed and what role the map played in the political process and discourse in Copenhagen.
We were inspired by several classifications for public participation methods and PPGIS (see figure 2 and 3). The following tables illustrates the different levels and forms of participation when using for example GIS in participatory processes. It was used to examine questions such as how and to what extent participants were able to contribute with data, whether the map and the website the map was published on allowed for discussions and communication between citizens, and if the map supported a direct involvement of citizens in the decision-making process.
18
Figure 3. Peng’s taxonomy of web-based public participation systems (Peng, 2001).
Using the tree-map in the planning practice
The resulting plan for planting trees was included in the municipality’s budget negotiations made in spring 2017. Even though there was a political ambition, the municipality did not yet have the financial means to plant 100.000 trees. However, the data collected with the tree-map was used in the political negotiation, and the fact that it included contributions from the citizens was what made it politically viable, as one of the interviewees emphasized. The opinions of citizens are indeed a strong argument in a negotiation process, and a rhetorical tool to validate a case. The usage of a map to visualize to communicate the citizen’s wishes made them an even stronger political tool, due to the authority and objectivity maps are usually assigned (Harley, 1989).
If methods such as PPGIS are to be used in planning practices, as political tools, and as rhetorical arguments, they require some careful considerations. According to scholars who have studied PPGIS and digital technologies, it is central to reflect on how inclusive the participatory processes are, and which prerequisites the target group has to participate (Peng, 2001; Mukherjee, 2015). These considerations can be particularly important when using digital tools and maps. In the planning document the city council claims to have included the citizens of Copenhagen. It does however not address the question of how to reach the ones who aren’t digitally enabled, the ones who can’t read maps, the ones who don’t understand Danish or the ones who don’t follow the municipality on Facebook. The possibilities to contribute through other means than the digital map and Facebook did not seem to be considered, since the municipality, at the time of our research, did not have any strategies for compensating for these barriers to participation. The inclusion of the groups mentioned above might therefore have failed, something which the planners at the municipality were aware of.
Questions about inclusion can be easier to consider if the geographical area in question is small. When planning for smaller spaces, like in urban regeneration programs, issues of lack of citizen representation can be easier to avoid. With smaller geographical areas and smaller populations, it can be easier to ensure that all groups are
19
included in the participation process. The scale of the planning issue was a challenge in this case, since the tree-map is a plan for the whole city of Copenhagen. However, digital tools can be a way to reach a geographically dispersed population, since online participation is not bound to a place. The use of online applications can also be perceived as an inclusive tool. Peng (2001) argues that one of the benefits of using online participatory methods is to include citizens who do not have the time to participate in public meetings. He also addresses the fact that traditional participation methods have their own barriers for participation, for instance when a small group dominates public meetings. The municipality’s use of an online platform can therefore also result in a more inclusive and thereby more democratic participation process.
Public participation in city administration has shown to be a challenging practice for city officials, but the use of digital tools can be a way to overcome it. Firstly, as our interviewees highlighted, the city officials are pressed for time, and participation processes can be time-consuming. A digital tool such as the tree-map can be a quick and easy way of gathering data on citizens’ opinions and wishes for their city. Secondly, a report from 2012 which evaluated participatory tools in urban planning in Copenhagen, pointed out that the city officials experienced that they were rarely able to use the ideas and feedback they got from citizens through more traditional public participation practices (Skab din by, 2012). They particularly expressed difficulties in using citizen input in their work in a valuable way. The evaluation of the tree-map indicated that using a digital tool, in contrast to earlier experiences, gave the planners a simple overview of citizens’ wishes in a format that could be included in the department’s normal planning procedure, and therefore created a valuable input.
The design implications
The analysis was founded on the understanding that the tree-map–like other maps and uses of geodata–should be examined with a focus on what perception of reality they reflect, what message they communicate, and what form of action they encourage (Harley, 1989; Kitchin & Dodge, 2007). While the map was interactive, it only allowed one form of input from the citizens, in the form of green points (see figure 1). The citizens did not have the possibility to use the data for their own analyses, change the layout of the map, or in other ways employ the map or the data to engage in further discussions and communication with other citizens or the municipality, apart from comments on the municipality’s Facebook page. These are features that are otherwise central within PPGIS, which emphasises that GIS should be used to involve citizens in the actual decision-making and allow for democratic discussions. In that sense, the map represents a quite narrow form of one-way communication, and would in the taxonomy suggested by Peng (2001) be placed somewhere in the top left corner, and is therefore only to a limited extent an example of PPGIS (see figure 3). The map only contained limited information about the city such as roads, railways and green areas–but not already existing trees (see figure 4). Citizens who wished to use the map were therefore dependent on their own prior knowledge about the physical and social features of the city, which implicitly can encourage participants to focus on the neighborhoods they are most familiar with instead of focusing on the city as a whole. The lack of for example a discussion forum, or further interactivity, furthermore result in an individualized and frictionless participation process where participant encounter neither the viewpoints and priorities of other citizens nor the authorities collecting the data.
20
In the analysis ensuing the data collection, the department responsible for the plan for future tree planting concluded that a large part of the participants wished for trees around the major streets and squares in the city (Københavns Kommune, 2017c). While this of course can reflect the priorities among the participants, it should however be considered that the larger roads and squares visually where the most prominent features in the tree-map, and the map thereby encourages people to focus their inputs on these areas.
The choices made in the design of the tree-map made it relatively easy to use and did not require participants to understand or incorporate all the technical knowledge required to determine where it is actually practically and economically feasible to plant trees. This was a conscious choice made by the designers in the GIS-department, since they did not wish to make the map too complicated or overburden citizens with information. Such simplicity can be argued to allow for broader and more inclusive participation since it does not require as much time or prior knowledge from citizens. On the other hand, simplicity and limited information can result in less informed and applicable contributions from the citizens. When the map does not reflect the planning practice which the contributions will be used in, the participant’s contributions risk being irrelevant for or incompatible with the planning process.
21
Critical reflections and further research
The use of maps and GIS in public participation has the potential to reform the way citizens can take part in the decisions that influence their everyday life and the future development of the places they live, to the benefit of both citizens and planners. When part of the participatory process is moved online, it not only allows for new forms of participation, but also removes some of the time and place restraints that traditional participatory methods like public hearings impose. When the participation happens online it changes the scale of participation and can potentially involve people from a much larger area, which is important for initiatives that go beyond neighborhood and city borders. Such a geographical expansion does however run the risk of planners and participants losing control with who is participating, and it makes it harder to ensure that it is the local citizens with the relevant knowledge and experiences who are contributing.
Maps and other visualizations of geodata are furthermore powerful tools for communicating complicated knowledge, and can therefore remove some of the knowledge barriers that exist when information is published as lengthy technical or legal documents. People who for various reasons are not able to make their voice heard within the traditional frameworks are thus given a possibility to participate. Likewise, the possibility to present their suggestions and objections in the form of maps and data can be empowering and give citizens a stronger voice in the planning debates. This requires that citizens are given the skills to use maps and data, and that collected data is shared by the authorities. During our research the planners in Copenhagen expressed that the citizens do not yet have the necessary skills, and that the municipality unfortunately does not have the resources to help citizens to be more active users of GIS.
Another potential from the use of geodata stems from the fact that geodata and the associated technologies and methods are becoming increasingly important within planning and decision-making both within and without the public sector. The use of GIS in participatory processes thus translates the citizens’ perspectives and knowledge to the same (data) format as much of the other knowledge used in the planning process, and it thereby becomes easier for planners and politicians to incorporate the citizens’ knowledge and opinions. This was also the experience described by our interviewees from the municipal departments working with the tree-map. The challenge of whether the data actually reflects the opinions of the citizens, and whether the participants were representative for the population as a whole nevertheless remains.
The introduction of digital and online tools in the democratic process does of course also pose several challenges. One of these is the significant digital divide that still exists between different groups and communities, since there are big differences in people’s access and skills when it comes to digital technologies (Mukherjee, 2015). An online method as the tree-map thus hold a risk of repeating or exacerbating already existing divides between people’s access to the planning process, although this problem might decrease as we move towards a digital and spatially enabled society.
Another challenge lies in the restrictions for which types of knowledge you can add or communicate through a map. GIS-applications and data-collection will inherently privilege knowledge which can be communicated as
22
quantitative spatial data. Thus other forms of sensed and subjective forms of knowledge might not be prioritized in the planning process. The technical and quantitative aspects also pose a challenge within the municipal administration, since our analysis showed that there are some significant knowledge divisions when it comes to the use of GIS and data. The people who are going to use the data contributed by the citizens might not have sufficient understanding of the possibilities and limitations of GIS and data, while those developing the specific GIS-applications might not understand the planning context that the technologies will be used in. This problem must be addressed if GIS is to play a more significant role in future planning.
GIS can be used in the participatory planning processes without it actually being an expression of truly public participatory GIS. We should thus avoid any techno-determinism– which claims that new technologies inherently will be positive – or on the contrary that they are inherently undemocratic. Instead it is necessary to critically reflect upon the possibilities and limitations in each individual use of GIS, and based on this decide what GIS and data can be used for, and to what extent other forms of participation might be more useful. Further research is needed into how we can benefit from using GIS in participation. It is necessary to ensure that the use of GIS is truly participatory, without sustaining and reinforcing digital divides, and that we reap the full potentials that PPGIS provides when it comes to more inclusive, flexible and accessible planning processes.
Bibliography
Agger, A. (2007). Kommunikativ Planlægningsteori - Nye Idealer For Borgernes Rolle. In A. Jensen, K.A. Nielsen, J. Andersen & O.E. Hansen (Eds.), Planlægning i Teori og Praksis (pp.31-45). Frederiksberg, Denmark: Roskilde Universitetsforlag.
Brodersen, L. (2009). GIS er et kommunikationsmiddel. Perspektiv, 15, 5-10.
Carver, S. (2001). Participation and Geographical Information: a position paper. ESF-NSF Workshop on Access to Geographic Information and Participatory Approaches Using Geographic Information, Spoleto, Italien, 6-8. december 2001, Leeds, University of Leeds.
Danielsen, S., & Wøhlk, R. (2012). Analyse af GIS-baseret borgerinddragelse i danske kommuner. Perspektiv, 21, 14-21.
Enemark, S., & Rajabifard, A. (2011). Spatially Enabled Society. Perspektiv, 20, 6-13.
Hansen, H. (2004). Geografisk information i demokratiets tjeneste. Perspektiv, 6, 44-49.
Harley, J. B. (1989). Deconstructing the Map. In M. Dodge, R. Kitchin & C. Perkins (Eds.), The Map Reader, Theories of Mapping Practice and Cartographic Representation (pp. 56-64). West Sussex, England: Wiley-Blackwell.