ISBN: 978-605-64453-8-5
448
PERFORMANCE, INEQUALITY, AND THE ORGANISATION OF
EDUCATIONAL SYSTEMS: AN INTERNATIONAL COMPARISON OF THE
DYNAMICS OF SCHOOLING
Susana da Cruz Martins
1
Asst. Prof., Instituto Universitário de Lisboa (ISCTE-IUL), Centro de Investigação e Estudos de
Sociologia (CIES-IUL), and Gulbenkian Professorship, PORTUGAL, susana.martins@iscte.pt
Abstract
This work aims to identify the main dynamics of education in a transnational and trans-regional perspective. It proposes, therefore, a diachrony with a time span of more than half a century, pondering the meaning of different categories in these processes, in particular those relating to gender and age. In addition, considering the weight of education - taking into account their dynamics and spatial locations - in social opportunities and their relationship with inequality of various types.
Thus, in a first interpretative axis, it proceeds to the characterisation of the most significant moments of enlargement, relating them, simultaneously, to an identification of processes of educational inequalities. The verification of the gradual increase of the access to and certification in educational and training systems, with a historical depth of more than half a century, still referring to a reading of educational inequality associated with other inequalities, such as the regional and national, age/generation and gender.
A second analytical axis is related to the capacity and performance of education systems to operate in these dynamics. How do systems have been creating policies and cultures of functioning that will encourage "impulses" or, on the other hand, make use of "discouraging" mechanisms, being faced with real difficulties in producing basic skills and sustainable learning paths to operate in knowledge-based societies and economies.
Finally, and in a complementary way, it also seeks to produce some relationship between inequality and the fundamental guidelines prevailing in education systems, reflected in their performance and in the context of integration and success of various social groups of students, particularly regarding social origins.
The findings of this study point to the relationship between education and the opportunities of life and social inequalities and how education systems promote greater equity in the success and construction of school paths. Several references and empirical sources are used and articulated, such as those relating to the OECD, UNESCO, etc., which allow the deepening of these issues and, at the same time, comparisons between countries and regions in an enlarged diachrony.
ISBN: 978-605-64453-8-5
449
1 PRELIMINARY NOTES
The qualifications constitute one of the most determinant elements of knowledge-based societies and economies. In this sense, one of the main aims of this study is to examine the dynamics and extent of this expansion in various regions around the world, beginning in the mid-20th century. The first line of analysis describes the gradual increase in educational systems’ ability to promote access and certification, with a history that dates back more than half a century. This characterization is associated with a reading of educational inequality as being related to other inequalities, such as regional and national inequalities and inequalities that are related to age/generation and gender. A second line of analysis is related to the ability and performance of educational systems to operate in these dynamics. How is it that these systems have created policies and cultures that are capable of pushing students ahead or holding them back but have difficulty creating basic skills and providing steady academic advancement to prepare them to function in a knowledge-based society and economy?
Some of the classic questions of sociology of education remain relevant to the analysis of inequalities that have been developed through the spread of educational and training systems. This relevance appears to vary, however, when different countries and regions are compared. In this type of analytical exercise, we find educational systems, which are key institutions of modernity, that are out-of-step with each other, reinforcing dynamics of speeding students up or holding them back in their schooling. It is also important to investigate the relationship between these mechanisms and the social inequalities found there.
The present study follows a methodology of extensive comparative analysis with a multi-level perspective and is based on a transnational approach and comparison among countries. The analyses are conducted using statistical data from international sources such as UNESCO and OECD.
2 THEORETICAL AND ANALYTICAL PERSPECTIVES
The theoretical and analytical perspective presented here examines the expansion of education in various regions of the world as well as generational and gender inequalities in the manner in which schooling is implemented, both between countries and within countries (Barro and Lee, 2015; Benaabdelaali et al., 2012). As is known, these dynamics and inequalities are decisive in determining individuals’ access to the opportunities, patterns of life, and resources that education confers (Breen et al., 2009, 2010; Martins et al., 2014; Werfhorst, 2007).
If it is true that inequality in educational opportunities closely mirrors social inequalities (the classic references for which are, e.g., Coleman, 1996; Bourdieu and Passeron, 1964; Boudon, 1981; Bernstein, 1975), then it is also true that this is manifested in ways that vary greatly from country to country (Duru-Bellat, Mons, Suchaut, 2004), though their institutional forms indicate, at least on initial examination, a certain isomorphism (Meyer, Ramirez, Frank and Schofer, 2006). The reason is that in many countries, inequality is woven into the very fabric and form of the institutions (Martins, 2012, 2013).
With regard to educational inequality, we come upon stratification mechanisms, which have been the subject of extensive study by educational sociologists, that influence both access to education and successful progress, marking what we typically call the unequal “tracking” of students into particular educational paths and opportunities (Martins, 2013). Schools can certainly leverage social mobility; however, they can maintain unequal social structures. Educational policies and organizational and pedagogical models that favour equity and educational mobility can certainly act as shock absorbers to cushion inequality; however, by reinforcing inequality in the form of very hierarchical and selective educational systems, acting in concert with an unequal social structure, schools can contribute to a boomerang effect of these inequalities- perpetuating and reinforcing an unequal distribution of resources.
3 ANALYSIS OF THE INEQUALITIES, ORGANIZATION, AND PERFORMANCE OF
EDUCATIONAL SYSTEMS: A COMPARATIVE PERSPECTIVE
3.1 Global dynamics and inequalities in education
Whenever a country or region experiences a period of accelerated growth in education, the segments of society that are not included in its implementation are left in a more unequal position, cut off from educational resources and the opportunities that are provided by education.
As can be observed, formal schooling has spread quickly since the 1960s, with some locations also experiencing surges in the 1980s and 1990s, and has recently tapered off. Since the first decade of the 21st
ISBN: 978-605-64453-8-5
450
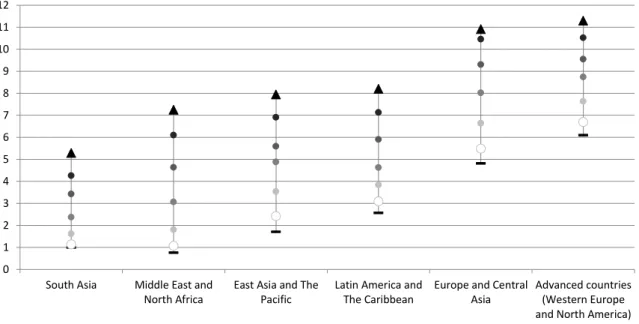
century, we have entered a phase of greater global stability and a clearer regional definition of educational hierarchies in terms of their dynamics and measures (see Fig. 1).Upon close analysis of Fig. 1, we observe that countries with developed or advanced economies (especially Western Europe and North America) and Europe and Central Asia appear on the upper part of the graph, indicating that they are better positioned in terms of the spread of education.
At the bottom of the graph appear the lines showing the evolution of areas such as Sub-Saharan Africa and South Asia, indicating dynamics that are comparatively weak on an international scale. Despite the improvements that have been observed in these regions, which are especially pronounced since the 1980s, these areas do not appear to be catching up to the advances that have been made in other regions.
The remaining regions such as Latin America and the Middle East, which are slightly lower on the trend lines in Fig. 1, occupy intermediate positions.
Fig. 1 Evolution of average years of schooling completed, shown by regions, 1960-2012 (population aged 25 or older)
Note: Calculation method used by UNESCO and Barro and Lee (2010).
Source: Built from UNESCO Institute for Statistics (2015), Barro and Lee (2014)
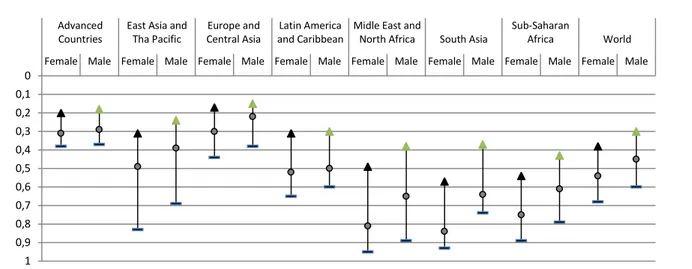
It is worth adding to this analysis an index that assumes a concession of distributional inequality (a coefficient), a type of educational Gini coefficient. In global terms, educational inequalities were much more pronounced in the 1950s, both within regions and among regions. Beginning in the 1980s, largely due to the spread of educational systems, schooling is much more evenly distributed, with Europe and Central Asia providing the best examples of this recovery (Fig. 2). With the exception of the African countries, the distribution of education was more unequal among females than among males. This phenomenon may have to do with the fact that at the starting point of this study (1950), females were rarely educated whereas, in recent years, the trend of education has been stronger among young females than among young males. This difference remains very important for North American and European countries but is not relevant for regions such as Latin America and Sub-Saharan Africa.
On a regional scale, both Western European and North American countries show a marked, steady trend of diminishing educational inequality over more than 50 years. The reduction is more pronounced, however, among males than among females (Fig. 2).
However, the disparities between males and females are not as pronounced in Latin America and the Caribbean, where they have decreased significantly since 1980 as the result of an educational expansion that lagged slightly behind Western Europe and North America (which are grouped here under the category of advanced countries) (Fig. 2).
0 1 2 3 4 5 6 7 8 9 10 11 12
South Asia Middle East and North Africa
East Asia and The Pacific
Latin America and The Caribbean
Europe and Central Asia
Advanced countries (Western Europe and North America)
ISBN: 978-605-64453-8-5
451
Fig. 2 Educational Gini coefficient, by world regions and by gender, 1950-2010. (Population aged 15 and older – range from 0 to 1)Source: Built from Benaabdelaali et al (2012).
The educational structures vary greatly among the different countries of the OECD. As we have observed, some of these differences have been more persistent. Fig. 3 shows a top-ranking group composed of Eastern European, North American, and some Northern European countries where approximately 90% of the population has secondary or higher education, which is consistent with a previous study of European countries (Martins, 2012). Some Latin American and Southern European countries are catching up, but the proportion of their populations with secondary education is less than 60%.
It may also be observed that the countries lagging furthest behind in secondary education show relatively strong progress among the youngest generation. Considering the current distribution shown in Fig. 4, one of the basic questions that comes to mind is how the stock of secondary school graduates in each country affects their access to resources, namely, financial resources.
Fig. 3 Population with secondary education or higher, OECD countries, 2014 (%) Population aged 25-64 years and aged 30-34 years.
Source: OECD (2015), Education at a Glance, Table A1.2a.
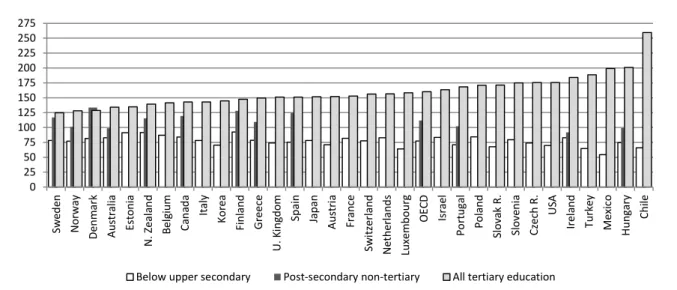
An initial reading of Fig. 4 leads to the conclusion that in all the OECD countries, the level of education is related to the level of earned income. The higher the level of education is, the higher the income (as has been shown by Martins et al., 2014). In some Latin American, Eastern European, and North American countries, these differences are more pronounced, reflecting very unequal societies.
0 0,1 0,2 0,3 0,4 0,5 0,6 0,7 0,8 0,9 1
Female Male Female Male Female Male Female Male Female Male Female Male Female Male Female Male Advanced
Countries
East Asia and Tha Pacific
Europe and Central Asia
Latin America and Caribbean
Midle East and
North Africa South Asia
Sub-Saharan Africa World 1950 1980 2010 0 10 20 30 40 50 60 70 80 90 100 A us tr al ia A us tr ia B el gi um C an ada C hi le C ze ch R . D enm ar k Est o ni a Fi nl an d Fr an ce G er m an y G re e ce H un gar y Ic el an d Ir el and Is rae l It al y Ko re a Lu xe m b o u rg M exi co N et h er lan d s N . Z eal an d N o rwa y P o lan d P o rt u gal Sl o vak R . Sl o ve n ia Spa in Sw ed en Sw it ze rl an d Tu rk ey U. K in gd o m EU A O EC D 25-64 25-34
ISBN: 978-605-64453-8-5
452
Fig. 4 Income of the employed population by level of education, OECD countries, 2013. Population with income from employment; Secondary education (ISCED 3) = 100Source: OCDE (2015), Education at a Glance, Table A6.2a.
The breakdown of earnings as related to education is also very revealing in some less educated countries but with the additional factor that only a small portion of the population sees improvements to their earnings through this route.
3.2 Educational systems: performance and directions
This section turns to an analysis of how educational systems change or reinforce long-standing inequalities. Paradoxically, the school systems of the countries that lag furthest behind in education in many cases act as a hindrance to academic progress through the practice of requiring students to repeat a grade level. This practice of retaining students, often as a corrective for academic failure, is most common in Southern European countries such as Portugal and Spain, in a context of centralized procedures and operating rules (Martins, 2012), in addition to Belgium, Luxembourg, and France. On the other end of the spectrum are countries where retention is an exception to the rule, especially in Northern Europe (Norway, Iceland, Finland, Sweden, and Denmark), the United Kingdom, Eastern Europe (Slovenia, Estonia, Poland, and the Czech Republic), some Asian countries (such as Japan and South Korea), and Israel.
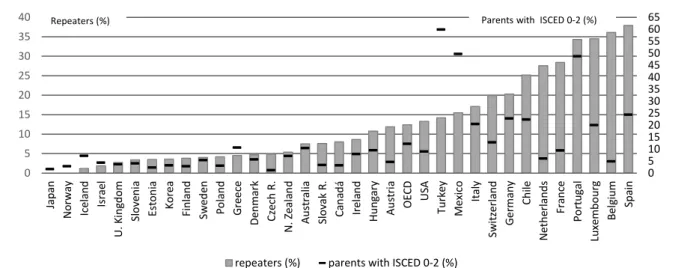
Many of the differences in the practice and administration of school retention is not even written into the policies and laws that govern this type of procedure. Finland and Portugal, for example, have similar laws governing retention but very different institutional and educational cultures and practices (Eurydice, 2011). Fig. 5 addresses two analytical issues. First, one can say that there is no linear correlation between the retention rate and the educational level of parents of 15 year olds. The rate at which students are retained is much more closely related to the selectivity of the educational systems that employ academic retention mechanisms than it is to the prevailing social contexts (e.g., The Netherlands, France and Belgium have negligible rates of less-educated parents). However, although no direct relationship can be proven, countries with higher rates of less-educated parents have retention rates that are higher than the OECD average. See also Turkey and Mexico (which have the highest percentage of parents with primary schooling) as well as Portugal (where higher retention rates are associated with parents’ low educational levels). In these countries, the long history of retention policies may also contribute to the parents’ generation having a history of academic difficulties because their school years were most likely also marked by the practice of retention; on the other hand, less educated parents tend to have difficulty helping their children successfully overcome such obstacles.
0 25 50 75 100 125 150 175 200 225 250 275 Sw ed en N o rway D enm ar k A us tr al ia Est o ni a N. Z eal an d B el gi um C an ada Italy Kor ea Fi nl an d G re e ce U. K ing do m Spa in Jap an A us tr ia Fr an ce Sw it ze rl an d N et he rl an ds Lu xe m bo ur g O EC D Isr ae l P o rt ug al P o lan d Sl o vak R . Sl o ve ni a C ze ch R . US A Ir el and Tur ke y M exi co H un gar y C hi le
ISBN: 978-605-64453-8-5
453
Fig. 5 Repetion rate (%) and parents (of 15 year olds) with lower secondary education (ISCED 0-2) (%), in OECD countries, 2012Source: Built from OECD (2013), Data from PISA2012 (Vol. IV).
The indicator for performance in math proposed by the OECD Programme for International Student Assessment (PISA) tests 15 year olds from various countries for competence in this subject. The average score on the OECD assessment is 494, and 16 countries have performance levels that are higher than 500 – most of them being in Northern and Central Europe, Canada, Japan, and South Korea (the last two having the highest average scores) (Fig. 6). However, although previous versions of the PISA assessment showed pronounced differences between the math scores of student from Portugal and those of students from other countries, Portuguese students have been closing the gap with countries that score higher on the PISA assessments. This improvement certainly has accompanied reforms in the organization of teaching and learning. In Sweden, where changes appear to be liberalizing educational policy, students have shown signs of scoring lower on math competency tests. Latin American countries have had the worst performance on the PISA, with students achieving the lowest scores on international math tests.
Fig. 6 Performance on the 2012 PISA math (average scores) Source: OECD (2014), PISA data for 2012 (Vol. I).
In relation to educational inequalities, it may be said that the mechanisms of stratification noted above translate into inequalities in academic performance in the educational systems and are reflected in different academic courses and educational opportunities (Fig.7).
0 5 10 15 20 25 30 35 40 45 50 55 60 65 0 5 10 15 20 25 30 35 40 Jap an N o rway Ic el an d Isr ae l U. K ing do m Sl o ve ni a Est o ni a Kor ea Fi nl an d Sw ed en P o lan d G re e ce D en m ar k C ze ch R . N . Z eal an d A us tr al ia Sl o vak R . C an adá Ir el and H un gar y A us tr ia O EC D US A Tur ke y M exi co It al y Sw it ze rl an d G er m an y C hi le N et he rl an ds Fr an ce P o rt u gal Lu xe m bo ur g B el gi um Spa in
repeaters (%) parents with ISCED 0-2 (%)
Repeaters (%) Parents with ISCED 0-2 (%)
413 423 448 453 466 477 478 481 482 484 485 487 489 490 494 494 495 499 500 501 501 504 506 514 515 518 518 519 521 523 531 536 554 M exi co C hi le Tur ke y G re e ce Isr ae l H un gar y Sw ed en US A Sl o vak R . Spa in It al y P o rt ug al N o rway Lu xe m bo ur g U. K ing do m O EC D Fr an ce C ze ch R . D enm ar k Sl o ve ni a Ir el and Aus tr al ia A us tr ia G er m an y B el gi um P o lan d C an ada Fi nl an d Est o ni a N et he rl an ds Sw it ze rl an d Jap an Ko re a
ISBN: 978-605-64453-8-5
454
Fig. 7 Performance on the 2012 PISA math (average scores) according to parents’ educational levels in OECD countries, 2012Source: OECD (2013), PISA data for 2012 (Vol. IV).
In all of the countries shown in Figure 8, the children of more highly educated parents performed better on the PISA assessments. A similarly consistent pattern of inequality is found in Eastern European countries (such as Slovakia, Hungary, and Poland). Even knowing that systemic social inequalities vary among countries and regions (Duru-Bellat and Suchaut, 2005), as patently observed here, some authors (Schlicht, Stadelmann-Steffen, and Freitag, 2010) have called attention to the fact that student performance is more dependent on their social background in Eastern European countries.
4 CONCLUSIONS AND NEW QUESTIONS
School openings have been effective in the world’s different regions during the second half of the 20th
century and the early 21st century. They have been able to handle the processes of broadening and reinforcement of school institutions over the past 60 years. Although they have highly varied dimensions, these openings have very important elements of social selectivity, revealing inequalities between genders, generations, and regions/countries. Regions such as Western Europe and North America have had unbalanced educational dynamics that are much faster and broader than their populations.
Educational systems are an expression of modern institutions, which, despite acknowledged isomorphism, denote logics of very differentiated tracking of school careers. One of the best indicators of such methods of action is the retention rate, which has served as a tool for hampering their populations’ education. Such mechanisms have constituted one of the most serious obstacles to universal education and sustainable school careers that support equity. The most unequal have had weaker dynamics for educating the population.
The countries that display very unequal education patterns, even among young people, tend to have educational system that imprints processes that favour this inequality on their organizational logic and functioning (Martins, 2012). Associated with this analysis is the fact that these same systems are themselves more susceptible to incorporating aspects of social inequality into their organization and institutional patterns, making social inequality an integral part of the system itself, reflecting it in its social processes and historical bases – and ending up having a boomerang effect on inequalities. Such standardization is not impervious to change but is subject to temporal and spatial diversity that, at times, can transform itself and affect inequality itself.
Associated with such dynamics is the manner in which educational policies operate through academic selectivity, in which the organizational and pedagogical dimensions of schools treat diversity inclusively and, no less important, if there is a commensurate, systematic intervention of public and social policies to combat adverse living conditions. In this sense, school can act to cushion inequalities, or damper, and be a motor force for social mobility. Given that inequalities have a certain cumulative effect, the reduction of inequalities must be observed in the interaction of its various dimensions (Costa, 2012). Although public, social, and educational policies are not the only elements that are capable of transforming social and educational realities, they are certainly instruments to be taken into account in changing these systems.
0 100 200 300 400 500 600 Sl o vak R . C hi le Isr ae l H un gar y M exi co G re e ce Cz ec h R . N o rway Tur ke y A us tr ia Sw ed en Fr an ce P o lan d O EC D Lu xe m bo ur g US A D enm ar k Sl o ve n ia N .Z eal an d It al y Spa in U. K ing do m B el gi um Ic el an d Ir el and C an ada P o rt ug al A us tr al ia Fi nl an d Sw it ze rl an d Est o ni a N et he rl an ds G er m an y Jap an Kor ea
ISBN: 978-605-64453-8-5
455
REFERENCE LIST
Barro, J.R.; and Lee, J-W (2015). Education Matters global - School gains from the 19th to the 2st century. Oxford: Oxford University Press.
Benaabdelaali, W.; Hanchane, S.; and Kamal, A. (2012). A New Data Set of Educational Inequality in the World, 1950–2010: Gini Index of Education by Age Group. Cahiers du LEAD, Nº 2012-1, p. 1-24. Bernstein, B. (1975). Language et Classe Social. Codes Socio-Linguistiques et Contrôle Social. Paris: Les
Éditions de Minuit.
Boudon, R. (1981). A Desigualdade de Oportunidades. A Mobilidade Social nas Sociedades Contemporâneas. Brasília: Editora Universidade de Brasília.
Bourdieu, P.; and Passeron, J. P. Les Héritiers. Les Étudiants et la Culture. Paris : Les Éditions de Minuit, 1964.
Breen, R.; Luijkx, R., Müller; W., and Pollak; R. (2009). Non-persistent inequality in educational attainment: evidence from eight European countries. American Journal of Sociology, 114 (5), 1475-1521.
Breen, R., Luijkx, R., Müller, W., and Pollak, R. (2010). Long-term trends in educational inequality in Europe: class inequalities and gender differences. European Sociological Review, 26 (1), 1-18. DOI: 10.1093/esr/jcp001
Coleman, J. S. (org.) (1966). Equality of Educational Opportunity. Washington: DC, Government Printing Office.
Costa, A. F. (2012), Desigualdades Globais (Global inequalities). Sociologia, Problemas e Práticas, 68, 9-32. DOI: 10.7458/SPP20126869.
Duru-Bellat, M.; Mons, N.; & Suchaut, B. (2004). Organisation scolaire et inégalités sociales de performance: les enseignements de l’enquête PISA. Education et Formations, 70, 123-131. (http://media.education.gouv.fr/file/13/5/5135.pdf).
Duru-Bellat, M., and Suchaut, B. (2005), Organisation and context, efficiency and equity of educational systems: what PISA tells us. European Educational Research Journal, 4(3), 181-194.
EURYDICE. (2011). Grade Retention During Compulsory Education in Europe: Regulations and Statistics. Brussels: European Comission. DOI: 10.2797/50570.
Martins, S. C. (2012). Escolas e Estudantes da Europa: Estruturas, Recursos e Políticas de Educação [Schools and Students in Europe]. Lisbon: Editora Mundos Sociais.
Martins, S. C. (2013). “Social state and public support for education: European dynamics and configurations”, proceedings of the EDULEARN13 5th International Conference on Education and New Learning Technologies (Session: General Issues in Education. Barriers to Learning & Globalization).
Martins, S. C.; Nunes, N.; Mauritti, R.; and COSTA, A.F. (2014). O que nos dizem as desigualdades educacionais sobre as outras desigualdades? Uma perspetiva comparada à escala europeia [What is the educational inequalities tell us about other inequalities? A compared perspective on a European scale]. In Melo, B.P.; A. Diogo; M. Ferreira; J. T. Lopes, e E. E. Gomes (orgs.). Entre Crise e Euforia : Práticas e Políticas Educativas no Brasil e em Portugal. Porto: Faculdade de Letras da Universidade do Porto, pp.845-868.
Meyer, J.; Ramirez, F. O.; Frank; e D. J; and Schofer, E. (2005). Higher education as an institution, CDDRL Working Papers, 57.
OECD (2015). Education at a Glance. OECD Publishing. http://dx.doi.org/10.1787/eag-2015-en.
OECD (2014). PISA 2012 Results: What Students Know and Can Do – Student Performance in Mathematics, Reading and Science (Volume I, Revised edition, February 2014), PISA, OECD Publishing. http://dx.doi.org/10.1787/9789264201118-en).
OECD (2013). PISA 2012 Results: Excellence Through Equity: Giving Every Student the Chance to Succeed (Volume II), OECD Publishing, 2013. ( http://dx.doi.org/10.1787/9789264201132-en).
ISBN: 978-605-64453-8-5
456
(Volume IV), PISA , OECD Publishing. (http://dx.doi.org/10.1787/9789264201156-en).Schlicht, R., Stadelmann-Steffen, I.; and Freitag, M. (2010), Educational inequality in the EU: The Effectiveness of the national education policy, European Union Politics, 11(1), 29-59. doi: 10.1177/1465116509346387.
Werfhorst, H.G. van (2007). Scarcity and abundance: Reconciling trends in the effects of education on social class and earnings in Great Britain 1972–2003. European Sociological Review, 23 (2), 239-261. DOI: 10. 1093/esr/jc103.