The informal aspects of the activity of
countries studied through Social
Accounting and Socio-Demographic
Matrices.
Susana Santos
ISEG (School of Economics and Management) of Lisbon University,
UECE (Research Unit on Complexity and Economics), DE
(Department of Economics)
2015
Online at
https://mpra.ub.uni-muenchen.de/68364/
SUSANA SANTOS*
ISEG (School of Economics and Management) of Lisbon University
UECE (Research Unit on Complexity and Economics) and DE (Department of Economics).
Abstract
Approaches based on Social Accounting Matrices (SAMs) and Socio-Demographic Matrices (SDMs)
will be presented as a way of capturing relevant networks of linkages and the corresponding multiplier
effects, which can subsequently be used for modelling the activity of the countries to be studied.
Emphasis will be placed on the activity of household unincorporated enterprises, also known as
informal enterprises.
Based on methodological principles derived mainly from the works of Richard Stone, this study will
be developed in a matrix format, including, on the one hand, people – represented by a SDM – and,
on the other hand, activities, products, factors of production and institutions – represented by a SAM.
The exposition will be accompanied by an application to Portugal, in which different scenarios will
be briefly presented, involving changes in incomes and expenditures. The macroeconomic effects of
these changes will be summarised in the form of changes in the macroeconomic aggregates: Gross
Domestic Product, Gross National Income and Disposable Income.
Keywords: Social Accounting Matrix; Socio-Demographic Matrices; Informal Economy.
JEL Classification: E01; E16; J11
(December 2015)
Notes:
- The author gratefully acknowledges the financial support provided by FCT (Fundação para a Ciência e a Tecnologia) Portugal for the research and writing of this article, which forms part of the Strategic Project for 2014 (PEst-OE/EGE/UI0436/2014).
-This paper is a revised version of the paper entitled “Studying the informal aspects of the activity of countries with Social Accounting and Socio-Demographic Matrices”, presented at the 22nd International Input-Output Conference -
Lisboa (Portugal): 14-18/7/2014, which can also be found in the Working Paper No. 17 /2014/DE (Department of Economics)/UECE (Research Unit on Complexity and Economics) – ISEG (School of Economics and Management) / University of Lisboa, September 2014.
-This paper was presented to the 23rd International Input-Output Conference, held in Mexico City – Mexico on
22-26/6/2015.
* Address for correspondence: ISEG /ULisboa, Rua Miguel Lupi, 20, 1249-078 Lisboa, Portugal; [email protected].
CONTENTS
1. Introduction ... 1
2. Approaches based on SAMs and SDMs ... 1
3. A SAM-based approach 3.1. Constructing and working with numerical versions of SAMs ... 3
3.1.1. The SAM’s basic structure and its consistency with the whole system ... 5
3.1.2. Disaggregations and extensions ... 10
3.1.3. Aggregates, indicators and balancing items ... 16
3.2. An algebraic version of the SAM: the accounting multipliers ... 20
4. Constructing numerical versions of SDMs ... 22
5. Studying the informal aspects of the activity of countries with SAMs and SDMs ... 26
6. Summary and concluding remarks ... 37
References ... 38
List of Tables 1. The Basic SAM by blocks ... 6
2. Basic SAM of Portugal in 2009 ... 9
3. SAM of Portugal in 2009, with disaggregated factors of production and the (domestic) institutions’ current and capital accounts ... 15
4. Portuguese functional distribution of the income generated in 2009 ... 18
5. Portuguese institutional distribution of the income generated in 2009 ... 19
6. Portuguese distribution and use of disposable income among institutions in 2009 ... 19
7. The SAM in endogenous and exogenous accounts ... 20
8. The standard SDM ... 22
9. SDM of Portugal in 2009 with population by age group ... 24
10. SDM of Portugal in 2009 with population by age group and economic activity ... 25
11. SDM of Portugal in 2009 with population by age group, economic activity and market participation ... 29
12. SAM of Portugal in 2009, with disaggregated factors of production, the (domestic) institutions’ current and capital account, and formal and informal labour and households ... 32
- 1 - 1. Introduction
The Social Accounting Matrix (SAM) and the Socio-Demographic Matrix (SDM) are tools that have
specific features intended for studying the activity of countries. Both matrices cover movements in
time and space, which are expressed by the former matrix in units of currency and by the latter matrix
in terms of human beings.
Such features allow for the reading and interpretation of the reality under study, leading to the
production of an empirical work which is not only capable of highlighting specific aspects of that
activity, but also offers the chance to experiment with different interventions with regard to its
functioning.
Section 2 outlines the main features of the SAM and SDM-based approaches, adopting a
methodological framework which is based on Richard Stone’s works. According to this
methodological framework, SAMs and SDMs can describe the activity of countries either empirically
or theoretically, depending on whether they are presented in a numerical or an algebraic version,
respectively.
A proposal is made for the development both of a basic SAM and of a standard SDM in Sections 3
and 4. Together with an explanation of possible alternative taxonomies, this presentations show how
these matrices can be used as an alternative support for studies being carried out in several areas, as
well as for the work of those taking part in the policy decision process. Numerical and algebraic
versions of SAMs are presented in a SAM-based approach, proposed in Section 3. Numerical versions
of SDMs are, in turn, presented in Section 4.
Using the example of an application for Portugal, Section 5 shows how those approaches can be used
as an alternative support for studying the informal aspects of the activity of countries at a
macroeconomic level.
A summary and some concluding remarks will be made in Section 6.
2. Approaches based on SAMs and SDMs
Richard Stone worked largely with SAMs and SDMs as matrix formats of the national and
demographic accounts, either in numerical and algebraic versions. In keeping with that work, and due
to their similarities, we will call the approach based on SAMs the SAM-based approach – the term
that is normally adopted – and the approach based on SDMs the SDM-based approach – a term that
is not normally adopted, but which will be used here.
Following the work of Richard Stone, both Graham Pyatt and Jeffrey Round in particular played a
- 2 -
In the foreword to the book which can now be regarded as a pioneering work in terms of the
SAM-based approach, “Social Accounting for Development Planning with special reference to Sri Lanka”,
Stone stated that the framework of the system of national accounts can be rearranged and “the entries
in a set of accounts can be presented in a matrix in which, by convention (…), incomings are shown
in the rows and outgoings are shown in the columns; and in which, reflecting the fact that accounts
balance, each row sum is equal to the corresponding column sum”. That matrix, with an equal number
of rows and columns, is the SAM, in the construction of which “it may be possible to adopt a
hierarchical approach, first adjusting the entries in a summary set of national accounts and then
adjusting subsets of estimates to these controlling totals”. (Pyatt and Roe, 1977: xix, xxiii).
In turn, in the abstract to his article “A SAM approach to modeling”, Pyatt says: “Given that there is
an accounting system corresponding to every economic model, it is useful to make the accounts
explicit in the form of a SAM. Such a matrix can be used as the framework for a consistent dataset
and for the representation of theory in what is called its transaction form”. In that transaction form
(or TV (transaction value) form), the SAM can be seen “(…) as a framework for theory” and its cells
“(…) can be filled instead with algebraic expressions, which describe in conceptual terms how the
corresponding transaction values might be determined”. Thus, the SAM is used as “the basic
framework for model presentation”. (Pyatt, 1988: 327; 337).
Looking at the question from the perspectives outlined above, it can be said that a SAM can have two
versions: a numerical version, which describes the activity of a country empirically; and an algebraic
version, which describes that same activity theoretically. In the former version, each cell has a specific
numerical value, with the sums of the rows being equal to the sums of the columns. In the latter
version, each cell is filled with algebraic expressions that, together with those of all the other cells,
form a SAM-based model, the calibration of which involves a replication of the numerical version.
In the words of Pyatt, “the essence of (...) the SAM approach to modelling is to use the same SAM
framework for both the empirical and the theoretical description of an economy”. (Pyatt, 1988: 337).
The construction of algebraic versions (or SAM-based models) can be seen, among others, in Pyatt
(2001; 1988), Pyatt and Roe (1977), Pyatt and Round (2012; 1985) and Santos (2012; 2009). A
specific SAM-based approach will be examined in section 3.
Despite the potentialities of Stone’s work on SDMs, the SDM-based approach has not been followed
by other authors as much as the SAM-based approach has. Thus, the study of the SDM-based
approach will be based only on Stone’s work.
According to Stone, the population of a specific country in a specific year “flows in partly along time
- 3 -
immigration; and flows out, through death and emigration, and partly along time into next year,
through survival” (Stone, 1986: 21). With the survivors from the preceding period constituting the
opening stock of the population and the survivors into the succeeding period constituting the closing
stock, the SDM can thus be considered a stock-flow matrix.
By connecting “the opening and closing stocks of year θ with flows during year θ” (Stone, 1982:
292), two types of versions will be identified for the SDM: numerical versions, in which each cell has
a specific numerical value; and algebraic versions, in which each cell is filled with algebraic
expressions that, together with those of all the other cells, form a SDM-based model.
Numerical versions of SDMs can thus be constructed from demographic statistics or they can be
replicated by the running of SDM-based models. The former versions measure the reality under study
and will be examined in section 4. The latter versions allow for the construction of scenarios resulting
from experiments performed with those models, and can be seen in: Stone, 1966, 1971, 1973, 1975,
1981, 1982, 1985, 1986a.
Assuming that the core of the statistics representing the part of the activity of countries that can be
expressed in currency units (covered by the SAM), and in human beings (covered by the SDM), are
the national and the demographic accounts, respectively, at least as a starting point, their adoption is
recommended for any study that is looking for empirical evidence about that activity. This will enable
one to work with, and gain a greater knowledge about the activity that is (supposedly) observed by
the national and the demographic accounts, which, both in a SAM and a SDM framework, will benefit
from the increased analytical content provided by the matrix format and the possibility of capturing
and working with networks of linkages not captured or worked on otherwise.
3. A SAM-based approach
3.1. Constructing and working with numerical versions of SAMs
The latest versions of the SNA have devoted a number of paragraphs to discussing the question of
SAMs. The 2008 version mentions SAMs in Section D of its Chapter 28, entitled “Input-output and
other matrix-based analysis” (ISWGNA, 2009: 519-522), in which a matrix representation is
presented of the accounts identified and described in the whole SNA. This representation is not,
however, to be identified with the SAM presented in this paper, although they both cover practically
- 4 -
In turn, the European System of National and Regional Accounts in the European Union of 20101
(the adaptation for Europe of the 2008 version of the SNA) makes a reference to the SAM, stating
that, among other features, it can be thought of as an expanded system of labour (satellite) accounts
(Chapter 22).
The SAM that will be presented below results from the work that the author has undertaken within
the methodological framework presented in Section 2, based especially on the works of Graham Pyatt
and his associates (Pyatt, 1988 and 1991; Pyatt and Roe, 1977; Pyatt and Round, 1985 and 2012), as
well as from the efforts made to reconcile that framework with what has been defined by (the
successive versions of) the SNA (Pyatt, 1985 and 1991a; Round, 2003; Santos, 2009). Thus, the
author will propose a version of a SAM that seeks to be as exhaustive as possible regarding the flows
observed by the SNA. Pyatt (1999) and Round (2003) also approach this same issue with the use of
their own versions.
The following proposal will be accompanied by the applications made of that SAM to Portugal in
2009. In that year, the Portuguese national accounts adopted the European System of National and
Regional Accounts in the European Community of 1995 – the adaptation for Europe of the 1993
version of the SNA. Because the general differences between the accounts identified in those
applications and described in the 1993 and 2008 versions of the SNA are not significant, they will be
used to illustrate the following exposition.
Thus, returning to the description provided in Section 2, a square matrix will be worked upon, in
which the sum of the rows is equal to the corresponding sum of the columns. In keeping with what is
conventionally accepted, and after some adjustments have been made to adapt this to the SNA,
resources, incomes, receipts or changes in liabilities and net worth will be represented in the entries
made in the rows, while uses, outlays, expenditures or changes in assets will be represented in the
entries made in the columns. Each flow will therefore be recorded only once, in a cell of its own. The
following description will be made in accordance with the 2008 SNA.
The starting point for the construction of a numerical SAM should be its design, i.e. the classification
or taxonomy of its accounts. That taxonomy and the levels of disaggregation adopted will depend on
the purposes for which the SAM is to be used, as well as on the way that the available information is
organised. Adopting the national accounts as the base source of information, a basic structure is
proposed below, which takes into account the underlying SNA and highlights the consistency of the
whole system. The flexibility of that basic structure will be shown, together with the possibilities that
1 EU Regulation No. 549/2013 of the European Parliament and of the European Council of 21 May 2013, on the European
- 5 -
it presents for characterising problems and for achieving specific purposes. These will also be seen
as possibilities for going beyond the SNA, which is considered as a starting point, as mentioned in
Section 2.
In this respect, we are aware of the dangers associated with the adoption of international standards
and systems of classification and their failure to recognise important issues and realities. This problem
is also mentioned by Pyatt and Round when they consider the choice of taxonomies within a SAM
framework and the strategic influence that these can have on the potential usefulness of subsequent
applications. According to those authors: “the taxonomies that are embedded within [the SAM
framework] predetermine what any subsequent modelling exercise might have to say in response to
specific distributional questions” (Pyatt and Round, 2012: 270).
3.1.1. The SAM’s basic structure and its consistency with the whole system
Adopting the working method recommended by Stone in the third paragraph of Section 2 of this
paper, the basic structure for the SAM presented below will be a summary set of the national accounts
and the controlling totals for the other levels of disaggregation, which will later be analysed in
Subsection 3.1.2. Thus, in keeping with the conventions and nomenclatures defined by the SNA,
besides a rest of the world account, the proposed SAM will also include both production and
institutional accounts.
Table 1 shows the above-mentioned basic structure, representing the nominal transactions (“t”) with
which two indexes are associated. The location of these transactions within the matrix framework is
described by those indexes, the first of which represents the row account while the second represents
the column account. Each cell of this matrix will be converted into a submatrix, with the number of
rows and columns corresponding to the level of disaggregation of the row and column accounts. This
same table also identifies blocks, which are submatrices or sets of submatrices with common
characteristics. The specification of these blocks will be made below and involves an identification
of the flows of the National Accounts, which will continue to be the same even if some disaggregation
- 6 - Table 1. The Basic SAM by blocks
p a f dic dik dif rw total
p – products TTM (t
p,p)
IC
(tp,a) 0
FC
(tp,dic)
GCF
(tp,dik) 0
EX
(tp,rw)
AD (tp.. )
a – activities P
(ta,p) 0 0 0 0 0 0
VPT (ta . )
f – factors 0 CFP_GAV
(tf,a) 0 0 0 0
CFP
(tf,rw)
AFIR (tf . )
dic – (domestic) institutions’ current account
NTP
(tdic,p)
NTA
(tdic,a)
CFP_GNI
(tdic,f)
CT
(tdic,dic) 0 0
CT
(tdic,rw)
AI (tdic. )
dik – (domestic) institutions’
capital account 0 0 0
S
(tdik,dic)
KT
(tdik,dik)
NLB (tdik,dif)
KT
(tdik,rw)
INVF (tdik. )
dif – (domestic) institutions’
financial account 0 0 0 0 0
FT
(tdif,dif)
FT
(tdif,rw)
TFTR (tdif.)
rw – rest of the world IM&NTP (t
rw,p)
NTA
(trw,a)
CFP (trw,f)
CT
(trw,dic)
KT
(trw,dik)
FT
(trw,dif) 0
TVRWP (trw.)
total AS
(t.p)
VCT (t.a )
AFIP (t.f )
AIP (t.dic)
AINV (t.dik )
TFTP (t.dif)
TVRWR (t..rw )
Source: Own construction
Note: The first three accounts (p = products (or goods and services), a = activities (or industries) and
f = factors (of production)) are the production accounts of the economy and the next three
accounts (dic = current; dik = capital; dif = financial) are the accounts of the (domestic)
institutions. The last account (rw = rest of the world) represents the “outside” part of the
(domestic) economy.
Description of the blocks (included in the texts are letters followed by numbers between brackets,
which are the flow codes of the National Accounts, in accordance with the 2008 SNA):
a) Production – P (cell: ta,p; basic prices) – represents the output of goods and services (P1).
b) Domestic Trade is represented by the value of domestically transacted products, which can be
either domestically produced or imported.
b.1)Intermediate Consumption – IC (cell: tp,a; purchasers’ prices) – consists of the value of the
goods and services consumed as inputs by a process of production, excluding those fixed assets whose consumption is recorded as consumption of fixed capital (P2).
b.2)Final Consumption – FC (cell: tp,dic; purchasers’ prices) – consists of the expenditure incurred
by resident institutional units on goods or services that are used for the direct satisfaction of
individual needs or wants, or the collective needs of members of the community (P3).
b.3)Gross Capital Formation – GCF (cell: tp,dik; purchasers’ prices) – includes gross fixed capital
- 7 -
c) External Trade includes the transactions in goods and services from non-residents to residents,
also known as imports (P7), or IM (cell: trw,p; purchasers’ prices), and the transactions in goods
and services from residents to non-residents, also known as exports (P6), or EX (cell: tp,rw;
purchasers’ prices).
d) Trade and Transport Margins – TTM (cell: tp,p) – amounts to zero and, when it is disaggregated
and takes the form of a submatrix, it allocates the output of the trade and transport services used
in the domestic trade to the supplied products.
e) Net taxes on production and imports
e.1)Net Taxes on Production – NTA (cells: tdic,a; trw,a) – represents the (other) taxes on production
(D29) minus the (other) subsidies to production (D39).
e.2)Net Taxes on Products – NTP (cells: tdic,p; trw,p) – represents the taxes on products (D21)
minus the subsidies on products (D31).
f) Compensation of Factors of Production – CFP (cells: tf,a; tdic,f; tf,rw; trw,f) – consists of the income
of the institutional sectors originating from the compensation of employees (D1) and the
compensation of employers and own-account (or self-employed) workers, and the compensation of capital, including property income (D4; B2g-B3g). The functional distribution is represented
by the Gross Added Value – GAV (cell: tf,a), whereas the institutional distribution is represented
by the Gross National Income – GNI (cell: tdic,f).
g) Current Transactions – CT (cells: tdic,dic; tdic,rw; trw,dic) – includes: current taxes on income, wealth,
etc. (D5); net social contributions (D61); social benefits other than social transfers in kind (D62);
other current transfers (D7); and the adjustment made for the change in pension entitlements (D8).
h) Capital Transactions – KT (cells: tdik,dik; tdik,rw; trw,dik) – includes: capital taxes (D91); investment
grants (D92); other capital transfers (D99).
i) Financial Transactions – FT (cells: tdif,dif; tdif,rw; trw,dif) – includes: monetary gold and special
drawing rights (F1); currency and deposits (F2); debt securities (F3); loans (F4); equity and
investment fund shares (F5); insurance, pension and standardised guarantee schemes (F6);
financial derivatives and employee stock options (F7); and other accounts receivable/payable (F8).
j) Gross Saving – S (cell: tdik,dic) – measures the portion of aggregate income that is not used for
final consumption expenditure and current transfers to domestic institutions or to the rest of the world (B9g).
k) Net Borrowing/Lending – NLB (cell: tdik,dif)
The net lending or borrowing of the total economy is the sum of the net lending or borrowing of
- 8 -
available to the rest of the world or the net resources that it receives from the rest of the world to
finance the corresponding needs of investment funds (B9).
Here, those amounts are recorded in the row(s) of the capital account, i.e. as changes in liabilities and net worth, and in the column(s) of the financial account, i.e. as changes in assets. This is why
the mathematical signs of this item have been changed in relation to the SNA.
The construction of a SAM is easier when it is performed by blocks.
The totals of each account represent the corresponding sums of the cells in rows and in columns, with
the following description:
I. Products account (p): Aggregate Demand – AD, the row sum (cell: tp.); Aggregate Supply – AS,
the column sum (cell: t.p).
II. Activities account (a): Production Value – VPT, the row sum (cell: ta.); Total Costs – VCT, the
column sum (cell: t.a).
III. Factors of Production (f): Aggregate Factors Income (Received) – AFIR, the row sum (cell: tf.);
Aggregate Factors Income (Paid) – AFIP, the column sum (cell: t.f).
IV. Current account of (domestic) institutions (dic): Aggregate Income (received) – AI, the row sum (cell: tdic.); Aggregate Income (Paid) – AIP, the column sum (cell: t.dic).
V. Capital account of (domestic) institutions (dik): Investment Funds – INVF, the row sum (cell:
tdik.); Aggregate Investment – AINV, the column sum (cell: t.dik).
VI. Financial account of (domestic) institutions (dif): Total Financial Transactions (Received) –
TFTR, the row sum (cell: tdif.); Total Financial Transactions (Paid) – TFTP, the column sum (cell:
t.dif).
VII. Rest of the world account (rw): Value of Transactions to the Rest of the World (Paid) – TVRWP,
the row sum (cell: trw.); Value of Transactions from the Rest of the World (Received) – TVRWR,
the column sum (cell: t.rw).
From the above description, two further advantages of the matrix presentation of the national accounts
can be highlighted: each transaction represents a single entry and can be characterised by its position;
each account is represented by a row and a column, whose balance is ensured by the equality of their
sums.
The Integrated Economic Accounts Table is equivalent to a summary of what is observed by the SNA.
According to the 2008 SNA: “The integrated economic accounts use (…) three of the conceptual
elements of the SNA (...) [institutional units and sectors, transactions, and assets and liabilities]
together with the concept of the rest of the world to form a wide range of accounts. These include the
full sequence of accounts for institutional sectors, separately or collectively, the rest of the world and
- 9 -
and presents a set of data for the institutional sectors, the economy as a whole and the rest of the
world” (ISWGNA, 2009: 23; 29). Based on this table and the previous description (adapted to the
previous version of the SNA), it was possible to construct the basic SAM presented in Table 2,
representing the highest possible level of aggregation of the activity of Portugal observed by the
national accounts in 2009.
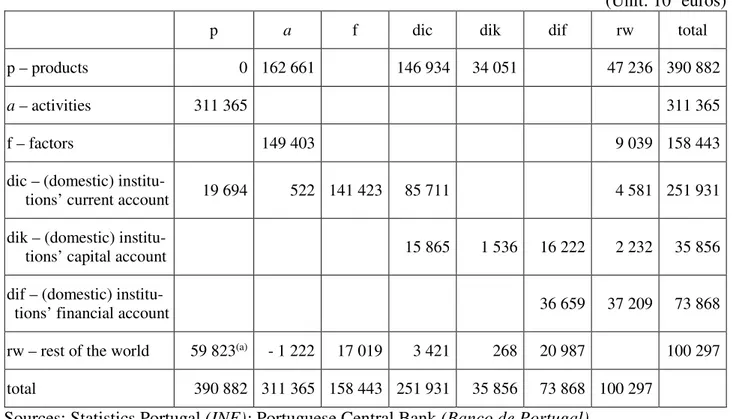
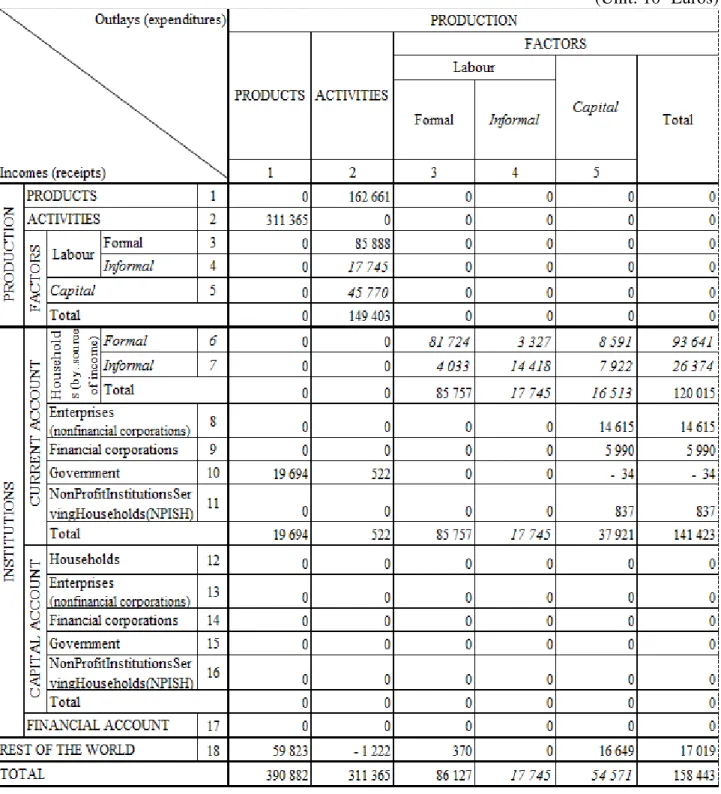
Considering the description given about Table 1, and based on the reading of the products account in
Portugal in 2009, represented in Table 2 – row and column p, the main components of the aggregate
demand and supply of the goods and services transacted in the market and captured by the Portuguese
National Accounts, can be identified in millions of euros. Thus, reading in rows, the total aggregate
demand of 390,882 million euros was composed of 162,661million euros of intermediate
consumption, 146,934 million euros of final consumption, and 34,051 million euros of gross capital
formation and 47,236 million euros of exports. Reading in columns, the total aggregate supply of
390,882 million euros (equal to the total aggregate demand) was composed of 311,365 million euros
from the output of goods and services, 19 694 million euros of net taxes on products received by the
Portuguese Government and 59,717 million euros of imports and 106 million euros of net taxes on
products sent to the institutions of the European Union. A similar reading can be made for each of
the other columns and rows of Table 2 for Portugal.
Table 2. Basic SAM of Portugal in 2009
(Unit: 106 euros)
p a f dic dik dif rw total
p – products 0 162 661 146 934 34 051 47 236 390 882
a – activities 311 365 311 365
f – factors 149 403 9 039 158 443
dic – (domestic)
institu-tions’ current account 19 694 522 141 423 85 711 4 581 251 931
dik – (domestic)
institu-tions’ capital account 15 865 1 536 16 222 2 232 35 856
dif – (domestic)
institu-tions’ financial account 36 659 37 209 73 868
rw – rest of the world 59 823(a) - 1 222 17 019 3 421 268 20 987 100 297
total 390 882 311 365 158 443 251 931 35 856 73 868 100 297
Sources: Statistics Portugal (INE); Portuguese Central Bank (Banco de Portugal).
- 10 -
Therefore, as mentioned above, and again using the words of Stone, the basic SAM that has just been
described can be considered as the most aggregate “summary set of national accounts”, representing
a first level of the intended hierarchical method, with all the controlling totals for the next level of
that hierarchy. From here the consistency of the whole (supposedly) observed system can be ensured.
3.1.2. Disaggregations and extensions
Since the national accounts cover all the details covered by the basic structure presented above, some
other levels of the above mentioned-hierarchical method can be identified within the national
accounts, providing other controlling totals for greater levels of disaggregation. As will be seen
below, this disaggregation can be made at the levels of the production, institutional and rest of the
world accounts, either within the scope of the SNA conventions or not. Reverse reasoning can be
applied to the case of aggregation. Therefore, in addition to the already-mentioned advantages of
presenting the national accounts in the form of a matrix, it is also possible to make an easier
aggregation and disaggregation of the accounts, in accordance with the specific requirements of the
exercise and the available information, without losing the consistency of the system.
In the words of Round, in his Foreword to Santos (2009): “The key to constructing a useful SAM and
developing an effective SAM-based model is the SAM design. A SAM need not be dimensionally
large as long as it represents the most significant features of economy-wide interdependence. More
precisely, this means designing the SAM so that the key sectors, markets and institutions are as fully
represented as is practicable. Estimation of the transactions between accounts is obviously also
important but this needs to go in tandem with the SAM design” (Santos, 2009: xiv).
It is also worth mentioning that, although the quarterly national accounts are not as complete as the
annual ones, it will nonetheless be possible to make some further disaggregations from these accounts
in terms of time.
Furthermore, disaggregations can be made in terms of space, since regional accounts are also
considered. In that case, it is possible to work with regions and countries, either individually or as a
group. Round (1991; 1994), for example, experimented with the case of Europe. It would even be
possible to think in world terms, if the SNA could be adopted worldwide.
Extensions are also possible, either from the national accounts or from other sources of information,
with the convenient adjustment to, or connection with, the whole system in order to maintain its
- 11 -
The 2008 SNA dedicates its Chapter 29 to “Satellite accounts and other extensions” (ISWGNA, 2009:
523-544)2, where the main idea is to serve specific analytical purposes, in a way that is consistent
with the central framework, although not fully integrated into it (ISWGNA, 2009: 37-38). In this
respect, the author would like to support Steven Keuning and Willem Ruijter’s idea of a “complete
data set” which “could be tentatively labelled: a System of Socio-economic Accounts” (Keuning and
Ruijter, 1988: 73).
a) Production accounts
In the basic structure proposed above, the production accounts are the accounts of products, activities
and factors of production. These accounts correspond respectively to the SNA accounts of goods and
services, production and the primary distribution of income. Thus, within these accounts and
depending on the available level of disaggregation, it can be seen how the available products are used,
with some details being provided about the process of production and about the way in which the
incomes resulting from that process and the ownership of assets are distributed among institutions
and activities.
The SNA uses the Central Product Classification (CPC) Version 2 (completed in December 2008) to
classify products (ISWGNA, 2009: 19), which are organised into 10 sections, with it being possible
to go as far as the fifth level of disaggregation within each of these.
In turn, the International Standard Industrial Classification of All Economic Activities (ISIC)
Revision 4 (officially released in August 2008) is used to classify activities (ISWGNA, 2009: 20),
organised into 23 sections, the disaggregation of which is perfectly consonant with that of the product
classification. The Supply and Use Table provides this information, usually at an intermediate level
of disaggregation.
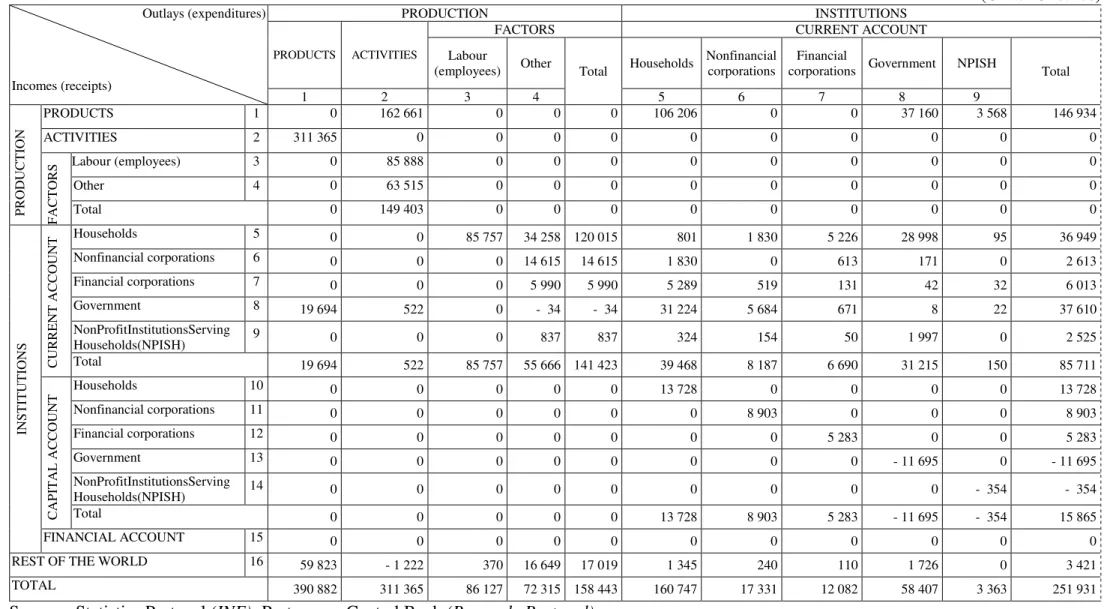
As described above, in the characterisation of the block representing the compensation of the factors
of production, the disaggregation that can be made from the already mentioned tables of the national
accounts is between labour (or the compensation of employees) and what has been referred to as the
compensation of other factors, which includes the compensation of employers and own-account (or
self-employed) workers, and the compensation of capital, namely property income. Such information
can only be derived from the Integrated Economic Accounts Table if the products and activities
accounts are not disaggregated, or from the Supply and Use Table if those same accounts are
disaggregated. Table 3, which contains the above-mentioned application to Portugal, in which the
- 12 -
products and activities accounts are not disaggregated, presents the possible disaggregation of the
factors of production accounts based on the Integrated Economic Accounts Table.
Regarding the design of SAMs and in order to establish a connection between the taxonomies dealt
with in this Subsection (a) and in the next (b), it should be mentioned that in their latest work, besides
a rest of the world account, Pyatt and Round identify accounts for goods and non-factor services and
factor services, as well as, accounts for institutions. In the latter, they identify private and public
sector current accounts and combined capital accounts. About this classification, they say the
following: “taxonomies for goods and services serve to distinguish different markets and should
therefore be constructed in ways that recognise significant market failures and segmentation. In
contrast, the institutions within the private sector are differentiated by the assets they own (or do not
own…) and the productive activities they are responsible for…. Factors of production and the assets
that provide them are therefore the defining feature of institutions.” (Pyatt and Round, 2012: 268).
b) Institutions and rest of the world accounts
In the basic structure proposed in Subsection 3.1.1, the domestic institutions are divided into current,
capital and financial accounts. These accounts correspond, respectively, to the following SNA
accounts: secondary distribution of income, redistribution of income in kind and use of income;
capital; and financial accounts. Within these accounts, depending on the level of disaggregation
available, the current accounts show how the national income is transformed into disposable income
through the receipt and payment of current transfers, and how the latter is distributed between final
consumption and saving. In turn, the capital account records the transactions linked to acquisitions of
non-financial assets and capital transfers involving the redistribution of wealth, whereas the financial
account records the transactions in financial assets and liabilities between institutional units, and
between these and the rest of the world.
All the linkages between the domestic economy and the rest of the world, i.e. all the transactions
between resident and non-resident units, are recorded both in the SAM and in the SNA through the
rest of the world account.
Chapter 4 of the 2008 SNA specifies the institutional sectors, including the rest of the world, and their
possible disaggregation, which in some cases can be taken as far as the third level (ISWGNA, 2009:
61-85), although normally it cannot be taken beyond the first level. In the case of the rest of the world,
such disaggregation will certainly depend on the country, or group of countries, that adopt and adapt
this system3.
3 In the case of the 2010 ESA (Chapter 23), a second level of disaggregation is made, with a distinction being drawn
- 13 -
At the first level of disaggregation, the accounts of the institutions, as well as the rest of the world
account, are part of the Integrated Economic Accounts Table. Higher levels of disaggregation,
whenever these are possible, are usually published in the separate accounts of institutions. Even at
the first level of disaggregation, any work conducted with the institutional sectors when there are
transactions involving more than one row or column of the SAM also requires the so-called “from
whom to whom matrices”. These matrices make it possible to fill in the cells of the submatrices of
transactions taking place within domestic institutions and between institutions and the rest of the
world, recorded in the above-described blocks of current, capital, and financial transactions
(Subsection 3.1.1. g-i).
As will be exemplified in Section 5, the disaggregation of specific institutional sectors makes it
possible to analyse the most diverse aspects of the corresponding roles in the activity of countries
(Santos (2004) and (2007) are examples of studies on the role of the general government and its
subsectors – central government, local government and social security funds).
The detailed study of the specific accounts of domestic institutions and their corresponding
transactions also makes it possible to analyse specific aspects of that same activity: the distribution
and redistribution of income, using the current account; the redistribution of wealth, using the capital
account; investment, its financing, and the implicit levels of the financing requirements and
availability of the institutional sectors and the whole economy, using the capital and financial
accounts.
In turn, the rest of the world account can provide many possibilities for studying the international
economic relations of the domestic economy.
Table 3 presents the possible disaggregation of the institutions’ current and capital accounts, made
from the Integrated Economic Accounts Table and the “from whom to whom matrices”, for the
above-mentioned application. From that table, we can discover a little more about the reality under
study – Portugal in 2009. This is the case with the aggregate factors income – the so-called primary
distribution of income, to the amount of 158,443 million euros, in which it can now be seen that
86,127 million euros account for the compensation of employees – row and column 3, and 72,315
million euros account for the compensation of other factors of production, namely employers and
own-account workers, land and capital (including property income) – row and column 4.
Through row 3 we can see that 85,888 million euros represent the part of the gross added value,
generated in the domestic economy by residents and non-residents that is attributed to the
- 14 -
compensation of employees, to which are added 239 million euros generated abroad by residents. In
turn, row 4 shows that 63,515 million euros represent the part of the gross added value, generated in
the domestic economy by residents and non-residents, that is attributed to the above-mentioned other
factors of production, to which are added 8,800 million euros generated abroad by residents. Rows 3
and 4 allow for the study of aspects related with the functional distribution of income.
Through column 3, we can see that 85,757 million euros represent the part of the gross national
income, generated in the domestic economy and abroad by residents, that is attributed to the
compensation of employees, to which are added 370 million eurosgenerated in the domestic economy
by non-residents and sent abroad. In column 4, we can see that 55,666 million euros is the part of the
gross national income, generated in the domestic economy and abroad by residents, that is attributed
to the compensation of other factors, to which are added 16,649 million euros generated in the
domestic economy by non-residents and sent abroad. From the cells of columns 3 and 4, it is possible
- 15 -
Table 3. SAM of Portugal in 2009, with disaggregated factors of production and the (domestic) institutions’ current and capital accounts
(Unit: 106 euros)
Outlays (expenditures)
Incomes (receipts)
PRODUCTION INSTITUTIONS
PRODUCTS ACTIVITIES
FACTORS CURRENT ACCOUNT Labour
(employees) Other Total Households
Nonfinancial corporations
Financial
corporations Government NPISH Total
1 2 3 4 5 6 7 8 9
P R O D U C T IO N
PRODUCTS 1 0 162 661 0 0 0 106 206 0 0 37 160 3 568 146 934
ACTIVITIES 2 311 365 0 0 0 0 0 0 0 0 0 0
F A C T O R
S Labour (employees) 3 0 85 888 0 0 0 0 0 0 0 0 0
Other 4 0 63 515 0 0 0 0 0 0 0 0 0
Total 0 149 403 0 0 0 0 0 0 0 0 0
IN S T IT U T IO N S C U R R E N T A C C O U N
T Households 5 0 0 85 757 34 258 120 015 801 1 830 5 226 28 998 95 36 949
Nonfinancial corporations 6 0 0 0 14 615 14 615 1 830 0 613 171 0 2 613 Financial corporations 7 0 0 0 5 990 5 990 5 289 519 131 42 32 6 013 Government 8 19 694 522 0 - 34 - 34 31 224 5 684 671 8 22 37 610 NonProfitInstitutionsServing
Households(NPISH) 9 0 0 0 837 837 324 154 50 1 997 0 2 525 Total 19 694 522 85 757 55 666 141 423 39 468 8 187 6 690 31 215 150 85 711
C A P IT A L A C C O U N T
Households 10 0 0 0 0 0 13 728 0 0 0 0 13 728 Nonfinancial corporations 11 0 0 0 0 0 0 8 903 0 0 0 8 903 Financial corporations 12 0 0 0 0 0 0 0 5 283 0 0 5 283 Government 13 0 0 0 0 0 0 0 0 - 11 695 0 - 11 695 NonProfitInstitutionsServing
Households(NPISH) 14 0 0 0 0 0 0 0 0 0 - 354 - 354 Total 0 0 0 0 0 13 728 8 903 5 283 - 11 695 - 354 15 865
FINANCIAL ACCOUNT 15 0 0 0 0 0 0 0 0 0 0 0
REST OF THE WORLD 16 59 823 - 1 222 370 16 649 17 019 1 345 240 110 1 726 0 3 421 TOTAL 390 882 311 365 86 127 72 315 158 443 160 747 17 331 12 082 58 407 3 363 251 931
- 16 -
Table 3 (continued). SAM of Portugal in 2009, with disaggregated factors of production and the (domestic) institutions’ current and capital accounts (Unit: 106 euros)
Outlays (expenditures)
Incomes (receipts)
INSTITUTIONS
REST OF THE
WORLD TOTAL CAPITAL ACCOUNT FINANCIAL ACCOUNT Households Nonfinancial corporations Financial
corporations Government NPISH Total
10 11 12 13 14 15 16
P R O D U C T IO N
PRODUCTS 1 7 269 19 812 1 064 5 071 834 34 051 0 47 236 390 882
ACTIVITIES 2 0 0 0 0 0 0 0 0 311 365
F A C T O R
S Labour (employees) 3 0 0 0 0 0 0 0 239 86 127
Other 4 0 0 0 0 0 0 0 8 800 72 315
Total 0 0 0 0 0 0 0 9 039 158 443
IN S T IT U T IO N S C U R R E N T A C C O U N
T Households 5 0 0 0 0 0 0 0 3 783 160 747
Nonfinancial corporations 6 0 0 0 0 0 0 0 103 17 331 Financial corporations 7 0 0 0 0 0 0 0 79 12 082
Government 8 0 0 0 0 0 0 0 615 58 407
NonProfitInstitutionsServing
Households(NPISH) 9 0 0 0 0 0 0 0 1 3 363
Total 0 0 0 0 0 0 0 4 581 251 931
C A P IT A L A C C O U N
T Households 10 0 0 53 139 0 192 - 9 004 177 5 093
Nonfinancial corporations 11 0 0 0 795 0 795 11 407 924 22 029 Financial corporations 12 0 0 53 24 0 77 - 4 157 0 1 202
Government 13 3 95 28 0 129 17 135 1 118 6 687
NonProfitInstitutionsServing
Households(NPISH) 14 0 0 0 344 0 344 840 14 844
Total 3 95 135 1 301 2 1 536 16 222 2 232 35 856
FINANCIAL ACCOUNT 15 0 0 0 0 0 0 66 325 37 209 103 534 REST OF THE WORLD 16 - 2 179 2 122 3 315 8 268 20 987 100 297 TOTAL 5 093 22 029 1 202 6 687 844 35 856 103 534 100 297
- 17 -
Just as the matrix form of the production accounts may be easily worked on from the supply and use
tables, it would also be possible to work on the matrix form of the institutional accounts if some kind
of “from whom to whom tables” were made official. This would be a crucial factor for implementing
the SAM-based approach, in which SAMs with production and institutional accounts, conveniently
capturing the circular flow of income and the underlying network of linkages, would form the basis
for macroeconomic models capable of reproducing the multiplier processes implicit in the activity of
countries.
3.1.3. Aggregates, indicators and balancing items
As was seen above, practically all the transactions of the national accounts are covered by the SAM,
so that macroeconomic aggregates, indicators and balancing items can be identified from it (see the
description of the cells or blocks in Table 1, as well as Tables 2 and 3 for the application to Portugal).
Gross Domestic Product at market prices (GDPpm), which is usually considered the main
macroeconomic aggregate, can be calculated in the three known approaches:
- Production approach: GDPpm = P – IC + NTP = ta,p – tp,a + (tdic,p+ (part of) trw,p);
- Expenditure approach: GDPpm = FC + GCF + Ex – IM = tp,dic + tp,dik + tp,rw – (part of) trw,p;
- Income approach: GDPpm = GAV + NTP + NTA = tf,a + (tdic,p+ (part of) trw,p) + (tdic,a + trw,a).
The Portuguese GDPpm in 2009 was 168 504 * 106 euros, which can be calculated from these three
approaches as follows:
- Production approach: GDPpm = 311 365 – 162 661 + (19 694 + 106);
- Expenditure approach: GDPpm = 146 934 + 34 051 + 47 236 – 59 717;
- Income approach: GDPpm = 149 403 + (19 694 + 106) + (522 – 1 222).
Domestic Product can be converted into National Product by adding the compensation of factors
received from the rest of the world and deducting the compensation of factors and the net indirect
taxes (on both products and production) sent to the rest of the world, when these exist. Thus, from
the described cells of the basic SAM, GDPpm can be converted into Gross National Product at market
prices (GNPpm) or Gross National Income (GNIpm), as follows: GDPpm + tf,rw – trw,f – trw,a– (part of)
trw,p. On the other hand, as the SAM directly provides Gross National Income, this can also be
calculated just by adding the net indirect taxes (on both products and production) received by
domestic institutions: tdic,f + tdic,p + tdic,a. The corresponding amount for Portugal in 2009 is 161 639 *
106 euros, for which the underlying calculations are as follows: GNPpm= 168 504 + 9 039 – 17 019 –
- 18 -
Disposable Income (Domestic or National) is also very important and can be calculated by adding to
GNIpm the net current transactions received by domestic institutions: GNIpm + ((received)tdic,dic+
tdic,rw) – ((paid) tdic,dic+ trw,dic). In our application to Portugal: 161 639 + (85 711 + 4 581) – (85 711 +
3 421) = 162 800 * 106 euros.
In turn, gross aggregates can be converted into net aggregates (and balancing items) by deducting the
consumption of fixed capital, which lies outside the basic SAM but is part of the integrated economic
accounts.
Gross Saving (S) and Net Lending or Borrowing (NLB) are given directly by the SAM, through tdik,dic
and tdik,dif, respectively, which in the case of Portugal in 2009 are: 15 865 and 16 222 * 106 euros. As
explained in Subsection 3.1.1 - k), the latter amount represents Net Borrowing.
It is also possible to calculate structural indicators of the functional and institutional distribution of
generated income, as well as indicators of the use of disposable income.
In the functional distribution of generated income, the distribution of gross added value – GAV –
among the factors of production is given by the structure of the submatrix in cell tf,a of the basic
structure, with its level of detail depending on the disaggregation of the activities (column account)
and of the factors of production (row account). Table 4 shows the results for the applications to
Portugal.
Table 4. Portuguese functional distribution of the income generated in 2009 (in percentage terms)
%
Factors of Production
(generated income = gross added value or gross domestic product)
Labour
(employees) 57.5
Other
(employers and own-account workers; capital)
42.5
Total 100.0
Source: Table 3
In the institutional distribution of generated income, the distribution of gross national income – GNI
– is given by the structure of the submatrix in cell tdic,f of the basic structure. In this case, the level of
detail will depend on the disaggregation of the factors of production (column account) and of the
current account of the domestic institutions (row account). Table 5 shows the results of our
- 19 -
Table 5. Portuguese institutional distribution of the income generated in 2009 (in percentage terms)
Factors of Production
Labour
(employees)
Other
(employers and own-account workers; capital)
Total
Institutions
(generated income = gross national income)
Households 100.0 61.5 84.9
Non-financial corporations 26.3 10.3
Financial corporations 10.8 4.2
General government - 0.1 0.0
Non-profit institutions serving
households 1.5 0.6
Total 100.0 100.0 100.0
Source: Table 3
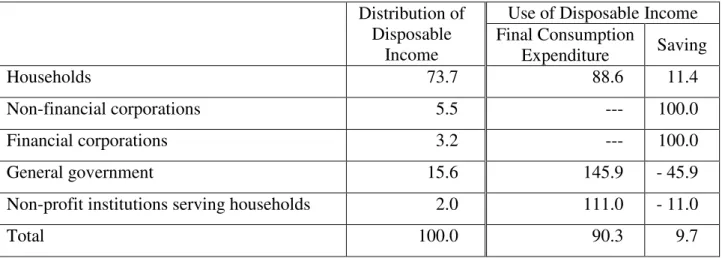
As described above for the whole economy, the disposable income of the institutional sectors can be
calculated in the same way, and then its distribution and use can also be studied – see Table 6.
Table 6. Portuguese distribution and use of disposable income among institutions in 2009 (in percentage terms)
Distribution of Disposable
Income
Use of Disposable Income Final Consumption
Expenditure Saving
Households 73.7 88.6 11.4
Non-financial corporations 5.5 --- 100.0
Financial corporations 3.2 --- 100.0
General government 15.6 145.9 - 45.9
Non-profit institutions serving households 2.0 111.0 - 11.0
Total 100.0 90.3 9.7
Source: Table 3
The main items in the revenue and expenditure of the institutional sectors and of the rest of the world
can be calculated from the respective rows and columns of the SAM. In the case of institutional
sectors, the total balancing item is the net lending/borrowing (NLB) of the respective institutional
sector, with an opposite mathematical sign to the one registered in the SAM; the current balancing
item is the respective gross saving (S); and the capital balancing item is the difference between the
- 20 -
3.2. An algebraic version of the SAM: the accounting multipliers
A static and comparative static analysis will be made within a framework in which prices are not
separated from quantities, with changes being identified only at the level of values.
It will be assumed that there is excess capacity in the economy and that the production technology
and resource endowment are given.
The base methodology that is to be followed is centred upon the use of multipliers. A systematic
outline of this methodology is provided below, following Santos (2004 and 2007), in keeping with
the work of Pyatt and Roe (1977) and Pyatt and Round (1985).
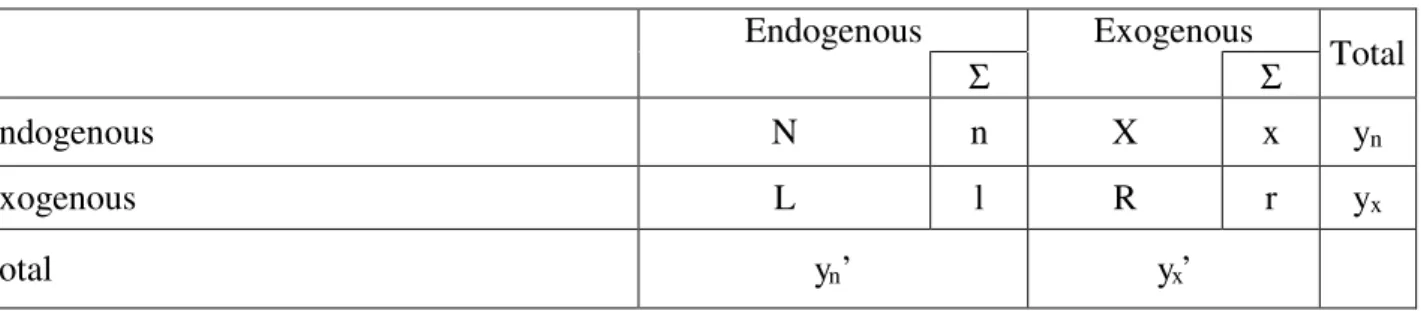
As shown in Table 7, we will have both exogenous and endogenous accounts, so that consequently
the transactions in each cell of the SAM will be considered exogenous or endogenous according to
the corresponding row and column accounts.
Table 7. The SAM in endogenous and exogenous accounts
Endogenous Exogenous
Total
Σ Σ
Endogenous N n X x yn
Exogenous L l R r yx
Total yn ’ yx’
Source: Pyatt and Round (1985).
Note: As referred above, rows represent resources, incomes, receipts or changes in liabilities and net
worth and columns represent uses, outlays, expenditures or changes in assets.
Key:
N = matrix of transactions between endogenous accounts; n = vector of the (corresponding) row
sums.
X = matrix of transactions between exogenous and endogenous accounts (injections from first into
second); x = vector of the (corresponding) row sums.
L = matrix of transactions between endogenous and exogenous accounts (leakages from first into
second); l = vector of the (corresponding) row sums.
R = matrix of transactions between exogenous accounts; r = vector of the (corresponding) row
sums.
yn = vector (column) of the receipts of the endogenous accounts (ŷn: diagonal; ŷn-1: inverse); yn’ =
vector (row) of the expenditures of the same accounts.
yx = vector (column) of the receipts of the exogenous accounts; yx’ = vector (row) of the
- 21 - From Table 7, it can be written that
yn = n + x (1)
yx = l + r (2)
The amount that the endogenous accounts receive is equal to the amount that they spend (row totals
equal column totals). In other words, in aggregate terms, total injections from the exogenous into the
endogenous accounts (i.e. the column sum of “x”) are equal to total leakages from the endogenous
into the exogenous accounts, i.e. considering i’ to be the unitary vector (row), the column sum of “1”
is:
x * i’ = l * i’. (3)
In the structure of Table 7, if the entries in the N matrix are divided by the corresponding total
expenditures a corresponding matrix (squared) can be defined of the average expenditure
propensities of the endogenous accounts within the endogenous accounts or of the use of resources
within those accounts. Calling this matrix An, it can be written that
An = N*ŷn -1 (4)
N = An*ŷn (5)
Considering equation (1), yn = An*yn + x (6)
Therefore, yn = (I-An)-1* x = Ma * x. (7)
We thus have the equation that gives the total receipts of the endogenous accounts (yn), by multiplying
the injections “x” by the matrix of the accounting multipliers:
Ma = (I-An)-1. (8)
On the other hand, if the entries in the L matrix are divided by the corresponding total expenditures
a corresponding matrix (non squared) can be defined of the average expenditure propensities of the
endogenous accounts into the exogenous accounts or of the use of resources from the endogenous
accounts into the exogenous accounts. Calling this matrix Al, it can be written that
Al = L*ŷn-1 (9)
L = Al*ŷn (10)
Considering equation (2), yx = Al*yn + r (11)
Thus, l = Al * yn = Al * (I-An)-1* x = Al * Ma * x. (12)
So, with the accounting multipliers, the impact of changes in receipts is analysed at the moment when
they occur, assuming that the structure of expenditure in the economy does not change.
For a study of changes resulting from the increment of the informal aspects of the activity of Portugal
- 22 - 4. Constructing numerical versions of SDMs
From what was stated in Section 2, just as in any SAM, time and space dimensions can also be
identified in any SDM. With an equal number of rows and columns, in each SDM “in any period, the
equality of inflows and outflows implies that the difference between the opening and the closing
stocks is equal to the net inflow from the outside world” (Stone, 1986: 21). Thus, the SDM connects
the opening and the closing stocks of year θ with the flows during the year θ.
In the standard stock-flow SDM, presented in Table 8, the state at New Year θ or θ+1 refers to the
position on the 1st of January each year.
Table 8. The standard SDM
(Unit: number of individuals)
State at New Year θ
State at New Year θ+1 Outside World
Our Country: Opening States
Closing Stocks
Outside World α ď
Our Country: Closing States b S Λn
Opening Stocks n’
Source: Stone (1981, 1982, 1986)
Key:
α (scalar) = individuals who both enter and leave our country during year θ and so are not
recorded in either the opening or the closing stock of that year (babies born in our country during
year θ who die in our country or emigrate before the end of it; immigrants into our country during
year θ who died in our country or emigrate before the end of it).
ď (row vector) = individuals who leave our country during year θ and so are recorded in the
opening stock but are not included in the closing stock (deaths and emigrants of year θ).
b (column vector) = individuals who enter our country during year θ and so are recorded in
the closing stock but are not included in the opening stock (births and immigrants of year θ).
S (square matrix) = individuals who survive in our country through year θ and so are recorded
in both the opening and the closing stocks (classified by their opening states in the columns and
by their closing states in the rows).
Λn (column vector) = closing stock in each state.
n’ (row vector) = opening stock in each state.
The taxonomic framework, within which each study is developed, will depend not only on its
purposes, but also on the information available. The whole population must, however, be included.
There is no doubt about the complexity of this work and the difficulty of obtaining credible and
- 23 -
As seen above, besides the opening and closing stocks, the SDM also quantifies (for each year) the
flows of individuals, which are recorded under “our country: (opening or closing) states”, defined in
accordance with the taxonomic framework adopted. As far as those flows are concerned, adopting
the words of Stone, “Each year individuals can enter a state in several ways: by survival in that same
state from last year, by moving into it from a different state in the course of the year, by birth or by
immigration; and they may leave it by survival into the year, by moving into another state during the
year, by emigration or by death” (Stone, 1986: 22).
Active or passive sequences can be adopted within this framework. In the case of active sequences,
different population groups can be identified, including those who are learning – schoolchildren and
students; those who are earning – members of the labour force, who participate in the market; and the
rest – all the educationally and economically inactive (in the sense that they do not participate in the
labour market and do not produce goods and services transacted in the market). Passive sequences
cover socio-economic groups, which may include such considerations as income, social class, family
size, etc.
The identification of different age groups can be regarded as the necessary step to be taken before
working with an active or a passive sequence.
In the following application to Portugal in 2009, in order to better deal with the above-mentioned
complexity and to study the so-called economic activity of the population, two levels of
disaggregation were identified. At the first level of disaggregation, the population was organised by
age groups. At the second level of disaggregation, within each age group, the population was
classified as either active or inactive, in accordance with their economic activity, understood as their
participation both in the labour market and in the supply side of the goods and services market. With
this process of organisation, the difficulty of obtaining data led, in some cases, to the adoption of
estimates and assumptions in order to be able to complete the matrices. The hierarchical method,
adopted in the previous section (for the construction of the SAM), was adopted. According to this
method, each level of disaggregation has all the controlling totals for the next level of that hierarchy.
The specification of the sources and the methodologies adopted in the construction of the following
- 24 -
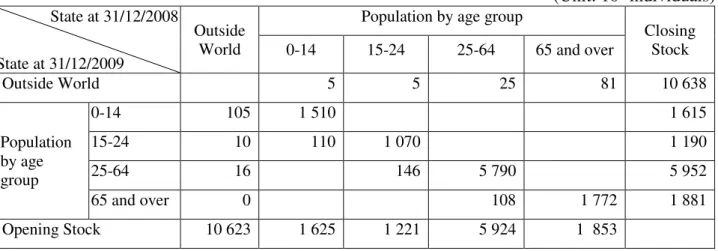
Table 9. SDM of Portugal in 2009 with population by age group.
(Unit: 103 individuals)
State at 31/12/2008
State at 31/12/2009
Outside World
Population by age group
Closing Stock 0-14 15-24 25-64 65 and over
Outside World 5 5 25 81 10 638
Population by age group
0-14 105 1 510 1 615
15-24 10 110 1 070 1 190
25-64 16 146 5 790 5 952
65 and over 0 108 1 772 1 881
Opening Stock 10 623 1 625 1 221 5 924 1 853
Source: Statistics Portugal (INE).
In the first age group of the population in Portugal in 2009, represented in Table 9 – column and row
0-14, we can see the stocks and the flows of children aged 0 to 14, measured in thousands of
individuals. Thus, reading by columns, the opening stock of children was 1,625; of these, 4 died or
emigrated, 1,510 remained in that age group throughout the year and 110 moved to the 15-24 age
group. Reading by rows, the closing stock was 1,615, which is composed of 105 children surviving
births and immigrants and 1,510 children who have not changed state. A similar reading can be made
for each of the other columns and rows.
The next level of disaggregation will look at the economic activity (as described above) of the
population in Portugal in 2009, within each age group and as represented in Table 10. As was seen
above, the economically active population amounts to those people that participate in the labour
market and/or produce goods and services transacted in the market. Reading the column of the active
15-24 age group, we can see that the opening stock of the active population aged 15 to 24, measured
in thousands of individuals, was 508; of these, 5 died or emigrated, 456 remained in the same situation
throughout the year and 47 moved to the active 25-64 age group. Reading the row for the same age
group, the closing stock was 466, which is composed of 10 immigrants, and 456 who have not
changed state. As was stated for the previous level of disaggregation, a similar reading can be made
- 25 -
Table 10. SDM of Portugal in 2009 with population by age group and economic activity.
(Unit: 103 individuals)
Outside
World
Population by age group and economic activity
Closing
Stock 0-14
15-24 25-64 65 and over
Active Inactive Total
Active Inactive Total
Active Inactive Total
1 2 3 4 5 6 7 8 9
Outside World 1 5 5 5 22 3 25 42 39 81 10 638
P o p u la ti o n b y a g e g ro u p a n d e co n o m ic a ct iv it y
0-14 2 105 1 510 1 615
1
5
-2
4
Active 3 10 456 466
Inactive 4 110 614 724
Total 10 110 1 070 1 190
2
5
-6
4
Active 5 16 47 4 734 4 797
Inactive 6 100 1 056 1 156
Total 16 146 5 790 5 952
6 5 a n d o v er
Active 7 0 35 284 320
Inactive 8 73 1 488 1 561
Total 0 108 1 772 1 881
Opening Stock 9 10 623 1 625 508 714 1 221 4 791 1 133 5 924 326 1 527 1 853
Source: Statistics Portugal (INE).
The above-described work with population movements within a country, during a specific period
captured by a SDM, can complement and improve the information that has been captured by a SAM
regarding the production, consumption and income of the institutional sector of households – one of
the five institutional sectors identified by the current System of National Accounts (2008 SNA), the
others being: financial and non-financial corporations, government and non-profit institutions serving