Regional, National and International
Networks:
The suitability of different competitive strategies for
different geographic profiles
Marisa Cesário1& Maria Teresa de Noronha Vaz1 1
CIEO – Research Centre for Spatial and Organizational Dynamics University of Algarve, Portugal
mcesario@ualg.pt Abstract
The continuous capacity of firms to learn is seen by many scholars as the critical solution in order to avoid firms from becoming locked into obsolete technological and competitive trajectories. This is a very common tendency, particularly in peripheral areas and/or labour-intensive industries.
Networks are often seen as the channel to overcome the risk that firms may become rigid. By accessing other markets, assets and technologies, firms free themselves from their own limitations while following the technological trajectories of their competitors.
In this paper, we approach the issue with respect to the relation between the competitive strategies of small firms and their networking profile. We report the results of the application of a common questionnaire to a sample of 165 SMEs from labour-intensive sectors belonging to the following southern European areas: North (Portugal), Valencia (Spain), Macedonia (Greece) and South Italy (Italy). Using multivariate statistical analysis, the firms were grouped according to the use of regional, national and international geographic scales for supply, distribution and sales networks. For each one of them, competitive strategies related with market, investments, technology and training were analysed.
Our results allow us to observe that competitive strategies vary across the three groups, indicating that there is a relation between the capacity to improve the geographic scale of networking and the capacity to strategically react to market changing conditions. While the related literature confirms the advantages of networking for the competitiveness of firms, we conclude that not all firms have the ability to develop international or even national contacts. Firms with restricted backward and forward linkages are also the ones with lower technological, training and innovative performances. Another important and related insight regards the requirements of going global: the network scaling-up is related more with quality production, than with scale economies.
The exploitation of marketing networks depends heavily on the openness towards new opportunities which, in turn, depends on the knowledge stock of firms (Cohen & Levinthal, 1990) and on the empowerment of employees to pursue it (Lechner & Dowling, 2003). The resource-base of firms is both an input for and an output of networking activity, and that can be either a vicious or a virtuous cycle.
Keywords: firm-networking, firm strategies, manufacturing
Acknowledgements: This paper has been partially supported by the Portuguese
1. Introduction
The continuous capacity of firms to learn is seen by many scholars as the critical solution in order to avoid firms from becoming locked into obsolete technological and competitive trajectories. This is a very common tendency, particularly in peripheral areas and/or labour-intensive industries.
Networks are often seen as the channel to overcome the risk that firms may become rigid. By accessing other markets, assets and technologies, firms free themselves from their own limitations while following the technological trajectories of their competitors. Case-studies across Europe give empirical and theoretical perspectives on how firms benefit from external linkages with other firms along the value-chain (Alvarez, Marin, & Fonfria, 2009; Arndt & Sternberg, 2000; Cantner, Conti, & Meder, 2010; Mazzola, Bruccoleri, & Perrone, 2009).
Our main purpose in this paper is to empirically analyse the relation between the capacity of firms to strategically react to market changing conditions and the networking aptitudes of firms.
We start by reviewing the arguments defending clustering and networking as sources of productive and efficient entrepreneurship. Yet, we emphasize the interconnected nature of those capabilities, arguing the dependence between each other. The ability to network has not only confirmed the positive effects on company performance, we also believe that there are certain 'enablers' necessary for successful cooperation (Hanna & Walsh, 2002, 2008). Firms which do not co-operate, and which do not formally or informally exchange knowledge, limit their long-term knowledge-base and, ultimately, reduce their ability to enter into exchange relationships (Pittaway, Robertson, Munir, Denyer, & Neely, 2004).
More specifically, regarding product and process innovation, positive associations were found in cooperation with customers, suppliers, the public sector, and universities (Freel & Harrison, 2006); although, in some cases, the effects are not as direct because there are sectoral and regional influences in the efficiency with which such networking inputs are translated into innovative outputs (Love & Roper, 2001).
Our empirical analysis is based on the application of a common questionnaire to a sample of 165 SMEs from the Textiles, Clothes and Leather (TCL) sectors belonging to a group of southern European areas: North (Portugal), Valencia (Spain), Macedonia (Greece), and South Italy (Italy). We report data on the use of supplier-distribution-sales networks at the local/regional, national, European and international levels.
Using cluster methods, we aim to identify the different geographic networking profiles among the sample. For each profile, competitive strategies related with market, investments, technology and training are analysed so statistical dependences between these strategies and cluster membership can be tested. We believe that an interdependent relationship occurs between the networking and strategic capacities of firms.
2. Small firm networking
2.1 Clustering and networking as a contribution to productive and efficient entrepreneurship
Literature related to organization theory and most of the publications on clustering have contributed to describe the form and the reasons why organizations and institutions join to better face competitive confrontations. Porter and Sölvell (1998) have explained that a cluster offers an adequate environment for the development of a common language, social bounds, norms, and values, i.e. an advantageous social capital. Additionally, a
cognitive reasoning has been emphasized by Pouder and StJohn (1996) who explained that within a cluster, managers and decision-makers share a wide number of values, cognitive references, perceptions, and experiences, and tend to follow the same patterns of organizational behavior. In practice, this can be highly positive as far as creative and innovative activity is concerned. If all entities within the cluster share the same propensity for creating and innovating, for risk-taking and change, then it can be expected that the whole cluster will show such pattern of creation and innovation. Nonetheless, a strategic myopia can be noticed when firms ritually follow a unique, particular culture and a repetitive set of common choices – a strategic myopia could promote non-innovative attitudes.
A different but also very interesting argument to accept is that micro-behaviors may originate from local grouping rules, and thereby promote networks, as suggested by Foray and Aubin (1998). They defend that an organizational niche, which is also a network structure, can easily integrate any technological complex. Later on, this view was enriched by many scholars who introduced social learning as a determinant (Levinthal & March, 1993). In our view, the speed at which information acquisition is required to take place justifies the fact that informational flows and knowledge flows can be time-consuming and cost-consuming – external economies occurring if networking systems are taking place.
As largely accepted, innovation is a complex activity profiting from knowledge – particularly new knowledge – which results from a cumulative and re-interpretative process. Part of this knowledge reaches the firm from external sources (Cassiman & Veugelers, 2002, 2006) and serves as a crucial factor to promote innovative activity (Rosenberg & Frischtak, 1986).
Over the last decades, the importance of knowledge generated outside the firm for its use has increased significantly, but the simple contact to external sources of knowledge is not enough to succeed in innovative activities.
Many authors described external knowledge flows as an aid to strategic decision-making at the firm level (Cassiman & Veugelers, 2002, 2006; Cohen & Levinthal, 1989). However, the firms have a certain absorptive capacity that limits them or enhances them when facing external knowledge.
The concept of networks facilitates the absorptive capacity of the firm making its external knowledge base a result of other factors such as: the density of firms clustered in a given geographical area; the sector of activity; the social ties; the nature of the knowledge; and the level of IPR (Jaffe, Trajtenberg, & Henderson, 1993; Teece, Pisano, & Shuen, 1997).
There has been a quite intensive discussion on the localized nature of knowledge flows and, consequently, of networks due to the mobility of information and codified knowledge and to the pros and cons of the catching concept of geographical and social proximity (Cohendet, 1997).
In reality, we consider that the most important concept is that the absorptive capacity, so well defined by Cohen and Levinthal (1990), can be a source of a firm’s competitive advantage. A firm’s absorptive capacity depends on its existing knowledge stock, much of which is embedded in its products, processes and people. Thus, a firm’s knowledge base plays both the role of innovation and absorption in a sequence of intertwined actions.
2.2 The importance of networking in Textiles, Clothes and Leather sectors
We believe that networking strategies are mandatory in two ways in TCL industries because:
a) These sectors belong to the so-called supplier-dominated industries, where innovative opportunities are primarily a process of diffusion of best-practice along the value-chain (Cesário, 2012).
b) Both horizontal and vertical links allow firms to create critical mass and exploit standardisation opportunities that should lead to reductions in costs, enhancement of quality and reduction of technological and commercial risks (Cesário, 2011).
Empirical studies across Europe corroborate these arguments. For example, the importance of sourcing and subcontracting was observed by Smith, Pickles, Bucek, Begg, and Roukova (2008) when assessing the capacity of these strategies to sustain European clothing production networks, despite the 'spectre of China'. In fact, the global garment industry is currently being reshaped in dramatic ways through processes of trade liberalization, delocalization and inter-firm and interregional competition. Although the higher labour costs of European firms can induce further rounds of de-localization of garment production towards low-cost production locations, such as China and India, the authors believe that that does not necessarily mean the end to garment production in higher European factor-cost locations if the right supply, distribution and sales networks are developed.
This is truer when considering the fashion industry, where the consistent use of outsourcing means that material production is constantly on the move to low-cost locations (Hauge, Malmberg, & Power, 2009). For firms in European high-cost countries, the creation of value and profitability commonly rests not only on the ability to produce innovative design and brand value, but also on efficient marketing channels, logistics and distribution.
Although we recognise the importance of the social facet of networking (one that is harder to measure), our arguments emphasise the market relations in supply, distribution and sales networks. According to Staber (2011), 'marketless' conceptions of social networks in clusters are overstated and need to be balanced with a stronger concern for the role of competition in the social embeddedness of small firms. Whatever the contents and motivating factors for networking, firms always seek the benefits for their client and resource base, while avoiding collaboration with competitors (Shaw, 2006).
2.3 Going international
As the drivers of globalization are removing barriers which traditionally segmented the competitive environments of small and large firms, firms of all sizes are joining international networks (Dana, 2001). While some sectors often need to internationalise their activities, especially sales, at a very early stage of their development because of limited domestic markets (Cantwell, 1995; Keeble, Lawson, Smith, Moore, & Wilkinson, 1998), others do it in search of technical advances. Nachum and Keeble (2003) argue that firms need to identify a successful balance between localised sources of interaction and those in wider geographic areas, and to establish linkages at these different geographic scales in order for them to compete successfully.
Even when industrial districts are strongly and successfully embedded, international sourcing is hardly prevented as traditional manufacturing industries become more heavily involved in the global arena. The Spanish home-textiles (Pla-Barber & Puig, 2009) and the Italian footwear and apparel industries (Camuffo, Furlan, Romano, & Vinelli, 2007) are good examples.
In manufacturing sectors, as already stated, networking activities are primarily based on vertical relationships such as customer, manufacturer supplier and producer service provider networks, rather than on horizontal linkages such as producer networks and industry-university linkages (Fischer & Varga, 2002), and firms tend to rely on sources of technology from national and, especially, international sources.
In this paper we are particularly interested in analyzing how firms respond differently to changing market conditions according to different networking profiles (regionally, nationally, or internationally oriented).
3. Research Design 3.1 Questions addressed
The aim of this paper is to analyse the relationship between the competitive strategies of firms and their different networking profiles. Therefore, the following research hypotheses are proposed in the paper:
H1: Market strategies vary within different networking profiles H2: Investment Strategies vary within different networking profiles H3: Technological Strategies vary within different networking profiles
H4: Training Policy and Institutional Strategies vary within different networking profiles
3.2 Sampling
Empirically, the analysis is based on the application of a common questionnaire to a sample of 165 SMEs from the Textiles, Clothes and Leather (TCL) sectors (table 1) belonging to the following southern European areas: North (Portugal), Valencia (Spain), Macedonia (Greece), and South Italy (Italy). Appendix 1 gives the sampling procedures. These areas are composed of one or more NUTS II regions and were selected because of their economic vulnerability established in three common features: a) these areas are lagging behind the EU-27 average in terms of gross domestic product (GDP) per capita; b) their heavy industrial tissues are mainly composed of labour-intensive activities, the ones most affected by low-wage competition; and c) their peripheral geographic location constitutes an economic restraint (Cesário, 2012).
Table 1
Sample distribution by focus area and sector
Footwear and Leather Products Textiles and clothes Total North, Portugal (PT) 14 52 66 Macedonia, Greece (GR) 14 34 48
South Italy (IT) - 24 24
Valencia, Spain (SP) 15 12 27
Total 43 122 165
3.3 Data and methodology
Agglomerative hierarchical clustering was used to find similar groups of firms according to the use of different geographical scales (regional, national and international) for supply, distribution and sales networks. The distances between firms were calculated
using the Square Euclidean Distance. The distance between two clusters was defined as the distance between their average values (the centroids).
In order to draw the different networking profiles, the authors used the information provided by firms about the geographical and functional origin and destination of inputs to production and outputs of production. Database variables are presented in appendix 2. In order to detect if the competitive strategies of firms vary across the different networking profiles, four groups of response variables (in appendix 3) were cross tabulated with the cluster membership of each firm.
Competitive Strategies were separated in:
i. Market strategies: firms were asked about the pattern of total sales over the past three years as well as the nature of SME response to changes in total sales.
ii. Investment strategies: here, the questionnaire asks for information on the nature of investment, the sources of funds used to finance investment, the effect of investment on employment, and the desired results of investment for the firm. iii. Technological strategies: firms were asked about the adoption of technology and
the sources of technological knowledge.
iv. Training Policy and policy institutions: finally, firms were asked about their decisions regarding training and the usefulness of existing regional, national and EU policy instruments.
The chi-square statistic is used to test the hypothesis that the competitive strategies of firms are independent from cluster membership. A low significance value (p<0.10) indicates that strategies are significantly different across the different networking profiles. The analysis of the Cramer's V statistic is used to give additional information on the strength of that variation.
4. Results
4.1 Networking profiles
The 165 regions were grouped as described in table 2 (from the initial group of 165 firms, 15 were excluded because of missing values). The networking profile of each group is easily depicted from Graphics 1, 2 and 3. The descriptive statistics by group, in table 2, allow a better characterisation.
Table 2 Descriptive Statistics Cluster 1 N=73 Cluster 2 N=27 Cluster 3 N=50 Total N=150 Employment <= 14 60% 19% 18% 38% 15 – 49 28% 44% 40% 35% 50+ 13% 37% 42% 27% Total 100% 100% 100% 100% Sales (euros) <= 1,600,000 49% 21% 29% 37% 1,600,001 - 12,500,000 19% 25% 42% 28% 12,500,001+ 32% 54% 29% 35% Total 100% 100% 100% 100% Year of establishment <= 1979 26% 33% 39% 32% 1980 - 1989 36% 37% 29% 34% 1990+ 38% 30% 33% 35% Total 100% 100% 100% 100%
Graphic 1
The use of Supply networks by cluster
Graphic 2
The use of Distribution networks by cluster
Graphic 3
The use of Sales networks by cluster
0 0,2 0,4 0,6 0,8 1 Suppliers: local/regional firms Suppliers: national firms Suppliers: EU firms Suppliers: international firm Cluster 1 (N=73) Cluster 2 (N=27) Cluster 3 (N=50) 0 0,2 0,4 0,6 0,8 1 Distributors: local/regional firms Distributors: national firms Distributors: EU firms Distributors: international firm Cluster 1 (N=73) Cluster 2 (N=27) Cluster 3 (N=50) 0 0,2 0,4 0,6 0,8 1 Sales destination: local/regional market Sales destination: national market Sales destination: EU market Sales destination: international market Cluster 1 (N=73) Cluster 2 (N=27) Cluster 3 (N=50)
Cluster 1 is composed of 73 firms with a regional/national network profile. This is the less internationalised group, which mostly develops links with local/regional or national suppliers and customers. Firms in this group are generally smaller than firms in the other groups, in terms of number of employees and value of sales. This group will be labelled as the one with a regionally-based networking profile.
Cluster 2 is composed of 27 firms with a strong international orientation. This group develops strong linkages with European suppliers, distributors and customers, but weaker linkages inside country borders. Firms in this group mostly present higher value of sales due to exports. This group will be labelled as the one with an internationally-based networking profile.
Cluster 3 is composed of 50 firms with a strong market position, both national and in Europe. Firms in this group are generally older and higher-scaled in terms of employees, but not in terms of the value of sales, because a substantial part of sales is absorbed by the national market, at lower prices than exports. This group will be labelled as the one with a nationally and internationally-based networking profile.
4.2 Market, investment, technology and training strategies
The following tables list the square, the Cramer's V and their significances. The chi-square results allow identifying the competitive variables that are not independent from the cluster membership. The observation of Cramer's V allows determining the strengths of the association, when present.
The rule of thumb that 80% of cells should have a count of 5 or more and no cells should have a zero count, was used as reference.
When interpreting the following results, attention should be paid to the fact that significant variables are identified when they are determinant to distinguish between the groups. When a variable is not indicated as significant, that does not mean that that variable is not important for the firms themselves. It means that it is not important to distinguish between the profiles.
4.2.1 Market Strategies
Regarding the variables related with market strategies, three of them revealed to be significantly different (0.1) across the three groups of firms (table 3).
Table 3
Chi square results for Market Strategies
Variable
2 V Sig.H0: Market strategies are independent from cluster membership
Changes in sales 4.511 0.164 0.341
Firm's response to change in sales: increased/decreased capacity 3.476 0.155 0.176 Firm's response to change in sales: sought markets/left existing 9.195 0.251 0.010
Firm's response to change in sales: introduced additional products 14.637 0.317 0.001
Firm's response to change in sales: out-sourced tasks 7.968 0.234 0.019
Firm's response to change in sales: formed partnerships 0.898 0.078 0.638 Firm's response to change in sales: acquired another firm 3.749 0.160 0.153
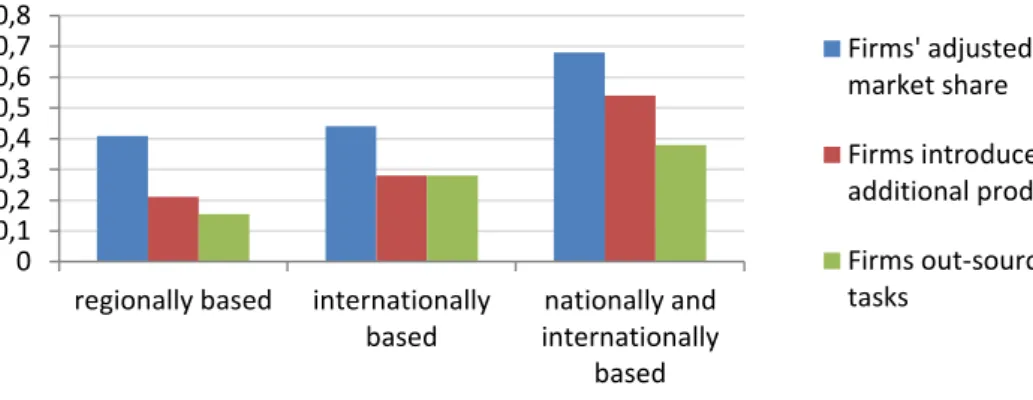
In testing the first research hypothesis, H1, that market strategies vary within different networking profiles, the null hypotheses were rejected for the adjustment of market share (p=0.010), the introduction of additional products (p=0.001) and the outsourcing of tasks (p=0.019) as responses to changes in sales. The most distinguishing variable across the three groups was the introduction of additional products (V=0.317).
Graphic 4 presents the performance of each group concerning these three variables.
Graphic 4
Market strategies by networking profile
It is possible to remark the following:
- The nationally and internationally-based networkers, cluster 3, are the ones that further adjusted (decreased) market share (as shown by 68% of the firms in this group) and introduced additional products in order to preserve their domestic and international demand. Because firms in this group are higher-scaled, this group also presents the greater rates of outsourcing, given the need to subcontract the less profitable tasks in response to negative changes in sales.
- The internationally-based networkers, as well as the regionally-based networkers present less austere responses to negative changes in sales, because both have a more limited action area.
4.2.2 Investment Strategies
From the list of variables related with investment strategies, there are seven with significantly different results (0.1) across the three groups of firms (table 4). In testing the second research hypothesis, H2, that investment strategies vary within different networking profiles, the null hypotheses were rejected for the investment in information technology (p=0.001), the investment in the purchase of patents & licensing (p=0.084), the investment in the development of existing products (p=0.064), the use of community banks or co-operatives (p=0.043) and national banks (p=0.003) to fund investment, the increase in the demand for skills (p=0.022) and the wish to increase market share (p=0.092). The most distinguishing variable across the three groups was the investment in information technology (V=0.303).
0 0,1 0,2 0,3 0,4 0,5 0,6 0,7 0,8
regionally based internationally based nationally and internationally based Firms' adjusted market share Firms introduced additional products Firms out-sourced tasks
Table 4
Chi square results for Investment Strategies
Variable
2 V Sig.H0: Investment strategies are independent from cluster membership
Firm invested in: new plant and equipment? 3.454 0.152 0.178 Firm invested in: information technology? 13.730 0.303 0.001
Firm invested in: the purchase of patents & licensing? 4.964 0.182 0.084
Firm invested in: the development of existing products? 5.491 0.191 0.064
Firm invested in: the development of new products? 1.874 0.112 0.391 Investment funds used: internal funds 0.482 0.059 0.786 Investment funds used: community bank or co-operative 6.280 0.212 0.043
Investment funds used: national bank 11.376 0.285 0.003
Investment funds used: government/ EU funds 1.845 0.115 0.398 Effects on workforce: displacement of existing employees 0.884 0.081 0.643 Effects on workforce: increased demand for higher skilled employees 7.676 0.238 0.022
Effects on workforce: increased demand for unskilled employees 2.952 0.148 0.229 Effects on workforce: increased demand for temporary employees 1.090 0.090 0.580 Effects on workforce: change in the ratio part-time/full-time 3.643 0.164 0.162 Desired investment results: increased labour productivity 0.836 0.078 0.658 Desired investment results: increased market share 4.778 0.187 0.092
Desired investment results: increased profit 0.097 0.027 0.953 Desired investment results: increased technological sophistication 3.834 0.168 0.147
From graphic 5 we observe the following:
- The third group presents higher incidences in terms of investments in IT and in the development of existing products. These investments are made in order to recover market share given the higher network implantation of this group. The use of new technologies also implies the need for higher skilled employees.
- The internationally-based networkers present the higher incidence of investments in the purchase of patents and licensing. This export-oriented group reveals higher preoccupations in attending to an international, and more challenging, demand in terms of quality and innovation.
- The regionally-based networkers reveal some investment efforts in order to increase their limited market share.
Graphic 5
Investment strategies by networking profile
4.2.3 Technological Strategies
In what concerns the variables related with technological strategies, there are six with significantly different results (0.1) across the three groups of firms (table 5).
Table 5
Chi square results for Technological Strategies
Variable
2 V Sig.H0: Technological strategies are independent from cluster membership
Production process is customized/standardized 6.418 0.148 0.170 Technologies adopted: inventory control 2.226 0.122 0.329 Technologies adopted: production process technology 10.082 0.259 0.006
Technologies adopted: product design technology 9.059 0.246 0.011
Technologies adopted: marketing technology 18.217 0.350 0.000
Technologies adopted: web site/internet 15.516 0.322 0.000
Technologies adopted: B to B electronic networks 3.177 0.146 0.204 Sources of technological knowledge: internal personnel 4.537 0.174 0.103 Sources of technological knowledge: customers 3.561 0.154 0.169 Sources of technological knowledge: suppliers 2.089 0.118 0.352 Sources of technological knowledge: industry associations 7.247 0.220 0.027
Sources of technological: universities/colleges 8.796 0.242 0.012
0% 10% 20% 30% 40% 50% 60% 70% 80%
regionally based internationally based
nationally and internationally
based
Firms invested in IT
Firms invested in the purchase of patents and licensing
Firms invested in the
development of existing products Firms increased the demand for higher skills
Firms used national banks to fund investment
Firms want to increase market share
Firms used community banks or co-operative to fund investment
In testing the third research hypothesis, H3, that technological strategies vary within different networking profiles, the null hypotheses were rejected for the adoption of new technologies related with: production processes (p=0.006), product design (p=0.011), marketing (p=0.000) and internet tools (p=0.000). The null hypothesis was also rejected for the use of industry associations (p=0.023) and universities/colleges as sources of technological knowledge (p=0.012).
The most distinguishing variables across the three groups were the adoption of new technologies related to marketing (V=0.350) and internet tools (V=0.322).
From graphic 6 we conclude that:
- The incidence of technological changes presents a clearly decreasing trajectory along the three groups.
- The same trajectory occurs with the use of industry associations as sources of technological knowledge, although regarding university links, regional networkers register a higher incidence than the internationally-based ones, which are primarily oriented for international contacts.
- Regarding the technological variables related with marketing and internet tools, the incidence of investments in such technologies is higher in higher network implantations, with a national and international nature.
- The adoption of production process and product design technologies (such as CAD and CAM) is also less evident along the three groups, which in this case could be explained with the average size of firms in the clusters. The use of such instruments is not frequent in very small domestic firms.
Graphic 6
Technological strategies by networking profile
4.2.4 Training Policy and Institutional Strategies
Concerning the variables related with training policy and institutional strategies, there are eight with significantly different results (0.1) across the three groups of firms (table 6). In testing the fourth research hypothesis, H4, that training policy and institutional strategies vary within different networking profiles, the null hypotheses were rejected for the firm’s upgrade of skills by: industry-organised training programmes (p=0.011), private training agencies (p=0.092), technical training colleges (0.003) and EU funded training schemes (p=0.006). The null hypotheses were also rejected for the
0% 10% 20% 30% 40% 50% 60% 70%
regionally based internationally based
nationally and internationally
based
Firms adopted production process technologies
Firms adopted product design technologies
Firms adopted marketing technologies
Firms adopted website/internet Firms used industry associations as sources of tech. Knowledge Firms used universities/colleges as sources of tech. Knowledge
application/receiving of EU development grants for: retraining (p=0.003/p=0.003) and the expansion of the firm (p=0.029/p=0.038). The most distinguishing variable across the three groups was the use of technical training colleges to provide expertise (V=0.281).
Table 6
Chi square results for Training Policy and Institutional Strategies
Variable
2 V Sig.H0: Training Policy and Institutional Strategies are independent from cluster membership Firm upgraded its workforce skills by: in-firm provision of training 0.708 0.069 0.702 Firm upgraded its workforce skills by: industry-organised training programmes 8.969 0.245 0.011
Firm upgraded its workforce skills by: private training agencies 4.773 0.179 0.092
Firm upgraded its workforce skills by: universities 1.999 0.116 0.368 Firm upgraded its workforce skills by: technical training colleges 11.747 0.281 0.003
Firm upgraded its workforce skills by: EU funded training schemes 10.396 0.264 0.006
Applied to the EU for development grants for: new technology 2.243 0.122 0.326 Applied to the EU for development grants for: retraining 11.711 0.279 0.003
Applied to the EU for development grants for: the expansion of firm 7.061 0.217 0.029
Applied to the EU for development grant for: relocation grants 2.013 0.116 0.331 Get any development grant for: new technology 4.239 0.168 0.120 Get any development grant for: retraining 11.778 0.280 0.003
Get any development grant for: the expansion of the firm 6.526 0.209 0.038
Get any development grant for: relocation grants 0.535 0.060 0.765
From graphic 7 it is possible to remark the following:
- The regionally-based networkers are the ones with a weaker incidence of training programmes. When present, the upgrade of the workforce skills is made by industry-organised training programmes, also revealing a weaker aptitude of this group to develop contacts with other institutions outside the industrial circle, such as colleges or private agencies.
- The internationally-based networkers clearly use their ability for international connections to successfully apply to EU funds for retraining. The use of national linkages for the provision of training is clearly negligible for this group.
- The third group, the one that develops national and international networks, presents a higher incidence of national linkages for the provision of training. When applying to EU grants, firms in this group are the ones that reveal higher concerns with their expansion.
Graphic 7
Training Policy and Institutional Strategies by networking profile
5. Final remarks
From the observation of a sample of TCL firms from Southern Europe, it was possible to identify three different groups with distinguished, geographic networking profiles. For each one of them, competitive strategies related with market, investments, technology and training were analysed.
As expected, we observe differences among the three groups regarding the type of firms (age and size) but also regarding innovativeness, training, use of skills and university and industry links. Similar results were found by Keeble et al. (1998) for technology-intensive sectors.
One of the profiles identified was the nationally and internationally-based networkers, a group that, besides a high level of internationalisation, is also embedded in a successful local networking and technology collaboration (a result also achieved by Keeble et al. [1998]). This group is characterized by older and bigger firms, which make an effort to uphold market share by improving existing products and introducing new ones. These firms are concerned with acquiring new IT technologies and hiring adequately skilled labour to use it. The use of outsourcing is, as expected, an adjusting strategy given the attractive price conditions of material production in low-cost locations (Hauge et al., 2009).
Another profile identified was the internationally-based networkers, a group with a strong export orientation, with higher concerns in attending to an international, and more challenging, demand in terms of quality and innovation, reflected in the type of investments made (patents and licensing) and in the higher valued sales. This group presents good capability for international connections, while paying less attention to national contacts. Similar to Freel (2003), we found that export propensity is positively associated with innovation-related linkages at a higher spatial level.
Finally, it was possible to identify a major group of regionally-based networkers, essentially smaller firms, with few concerns with innovation, new technologies and training and a weaker aptitude to develop contacts with other institutions outside the industrial circle.
Our results allow us to observe that competitive strategies vary across the three groups, indicating that there is a relation between the capacity to improve the geographic scale of
0% 5% 10% 15% 20% 25% 30% 35% 40% 45%
regionally based internationally based
nationally and internationally
based
Firms applied to the EU grants for retraining
Firms used EU funds to provide training
Firms used technical colleges to provide training
Firms used industry-organised training programs
Firms used private agencies to provide training
Firms applied to the EU grants for the expansion of the firm
Firms get EU grants for retraining Firms get EU grants for the expansion of the firm
networking and the capacity to strategically react to market-changing conditions. While the related literature confirms the advantages of networking for the competitiveness of firms, we conclude that not all firms have the ability to develop international or even national contacts. Firms with restricted backward and forward linkages are also the ones with lower technological, training and innovative performances. Another important and related insight regards the requirements of going global: the network scaling-up is related more with quality and innovation, than with scale economies.
The exploitation of marketing networks depends heavily on the openness towards new opportunities which, in turn, depends on the knowledge stock of firms (Cohen & Levinthal, 1990) and on the empowerment of employees to pursue it (Lechner & Dowling, 2003). The resource base of firms is both an input for and an output of networking activity, and that can be either a vicious or a virtuous cycle.
References
Alvarez, I., Marin, R., & Fonfria, A. (2009). The role of networking in the competitiveness of firms. Technological Forecasting and Social Change, 76(3), 410-421.
Arndt, O., & Sternberg, R. (2000). Do manufacturing firms profit from intraregional innovation linkages? An empirical based answer. European Planning Studies, 8(4), 465-485. Camuffo, A., Furlan, A., Romano, P., & Vinelli, A. (2007). Routes towards supplier and
production network internationalisation. International Journal of Operations &
Production Management, 27(3-4), 371-387.
Cantner, U., Conti, E., & Meder, A. (2010). Networks and Innovation: The Role of Social Assets in Explaining Firms' Innovative Capacity. European Planning Studies, 18(12), 1937-1956.
Cantwell, J. (1995). The Globalization of Technology - What Remains of the Product Cycle Model. Cambridge Journal of Economics, 19(1), 155-174.
Cassiman, B., & Veugelers, R. (2002). R&D cooperation and spillovers: Some empirical evidence from Belgium. American Economic Review, 92(4), 1169-1184.
Cassiman, B., & Veugelers, R. (2006). In search of complementarity in innovation strategy: Internal R&D and external knowledge acquisition. Management Science, 52(1), 68-82. Cesário,M. & NoronhaVaz, M.T. (2011). The effects of globalisation on the performance of
labour-intensive industries from southern Europe: the role of localised capabilities,
International Journal of Economics and Management Sciences, 1(4), 53-63.
Cesário,M. &NoronhaVaz, M.T. (2012). "Technological adjustments in textile, clothes and leather industries: an alternative pathway for competitiveness",in C. Karlsson, B. Johansson and R. Stough (eds) Entrepreneurship, Social Capital and Governance, Edward Elgar Publishing. (Forthcoming)
Cohen, W. M., & Levinthal, D. A. (1989). Innovation and Learning - the 2 Faces of R-and-D.
Economic Journal, 99(397), 569-596.
Cohen, W. M., & Levinthal, D. A. (1990). Absorptive-Capacity - a New Perspective on Learning and Innovation. Administrative Science Quarterly, 35(1), 128-152.
Cohendet, P. (1997).“Network, Interactions between Economic Agents and Irreversibilities: the Case of the Choice among Competing Technologies”, in: P. Cohendet, P. Llerene, H. Stahn and G. Umdhauer (eds.), The Economics of Networks, Springer, Berlin, 93-121. Dana, L. P. (2001). Networks, internationalization & policy. Small Business Economics, 16(2),
57-62.
Fischer, M. M., & Varga, A. (2002). Technological innovation and interfirm cooperation: an exploratory analysis using survey data from manufacturing firms in the metropolitan region of Vienna. International Journal of Technology Management, 24(7-8), 724-742. Foray, D.& Aubin, J.P. (1998). “The Emergence of Network Organizations in Processes of
Technological Choice: a Viability Approach”, in: P. Cohendet, P. Llerene, H. Stahn and G. Umdhauer (eds.), The Economics of Networks, Springer, Berlin, 283-290.
Freel, M. S. (2003). Sectoral patterns of small firm innovation, networking and proximity.
Research Policy, 32(5), 751-770.
Freel, M. S., & Harrison, R. T. (2006). Innovation and cooperation in the small firm sector: Evidence from 'Northern Britain'. Regional Studies, 40(4), 289-305.
Hanna, V., & Walsh, K. (2002). Small firm networks: a successful approach to innovation? R &
D Management, 32(3), 201-207.
Hanna, V., & Walsh, K. (2008). Interfirm cooperation among small manufacturing firms.
International Small Business Journal, 26(3), 299-321.
Hauge, A., Malmberg, A., & Power, D. (2009). The Spaces and Places of Swedish Fashion.
European Planning Studies, 17(4), 529-547.
Jaffe, A. B., Trajtenberg, M., & Henderson, R. (1993). Geographic Localization of Knowledge Spillovers as Evidenced by Patent Citations. Quarterly Journal of Economics, 108(3), 577-598.
Keeble, D., Lawson, C., Smith, H. L., Moore, B., & Wilkinson, F. (1998). Internationalisation processes, networking and local embeddedness in technology-intensive small firms.
Lechner, C., & Dowling, M. (2003). Firm networks: external relationships as sources for the growth and competitiveness of entrepreneurial firms. Entrepreneurship and Regional
Development, 15(1), 1-26.
Levinthal, D. A., & March, J. G. (1993). The Myopia of Learning. Strategic Management
Journal, 14, 95-112.
Love, J. H., & Roper, S. (2001). Location and network effects on innovation success: evidence for UK, German and Irish manufacturing plants. Research Policy, 30(4), 643-661. Mazzola, E., Bruccoleri, M., & Perrone, G. (2009). A strategic framework for firm networks in
manufacturing industry: An empirical survey. Cirp Annals-Manufacturing Technology,
58(1), 387-390.
Nachum, L., & Keeble, D. (2003). Neo-Marshallian clusters and global networks - The linkages of media firms in Central London. Long Range Planning, 36(5), 459-480.
Pittaway, L., Robertson, M., Munir, K., Denyer, D., & Neely, A. (2004). Networking and innovation: a systematic review of the evidence. International Journal of Management
Reviews, 5-6(3-4), 137-168.
Pla-Barber, J., & Puig, F. (2009). Is the influence of the industrial district on international activities being eroded by globalization? Evidence from a traditional manufacturing industry. International Business Review, 18(5), 435-445.
Porter, M. & Sölvell, O. (1998). “The role of geography in the process of Innovation and the sustainable competitive advantage of firms”, in: D. Chandler Jr, P. Hagstrom and O. Sölvell (eds.), The Dynamic Firm: The Role of Technology,Strategy and Regions, Oxford, Oxford University Press, 440-458.
Pouder, R., & StJohn, C. H. (1996). Hot spots and blind spots: Geographical clusters of firms and innovation. Academy of Management Review, 21(4), 1192-1225.
Shaw, E. (2006). Small firm networking - An insight into contents and motivating factors.
International Small Business Journal, 24(1), 5-29.
Smith, A., Pickles, J., Bucek, M., Begg, R., & Roukova, P. (2008). Reconfiguring 'post-socialist' regions: cross-border networks and regional competition in the Slovak and Ukrainian clothing industry. Global Networks-a Journal of Transnational Affairs, 8(3), 281-307. Staber, U. (2011). Partners Forever? An Empirical Study of Relational Ties in Two Small-firm
Clusters. Urban Studies, 48(2), 235-252.
Rosenberg, N. & Frischtak, C.R. (1986). “Technological Innovation and Long Waves”, in: C. Freeman (ed.), Design, Innovations and Long Cycles in Economic Development, Frances Pinter, London 5-26.
Teece, D. J., Pisano, G., & Shuen, A. (1997). Dynamic capabilities and strategic management.
Appendix 1 – Sampling Procedures
The questionnaire used in the present research was designed, tested and applied in the scope of the EU FP5 Project RASTEI - Regional Adjustment Strategies to Technological Change in the Context of European Integration - HPSE-1999-00035.
This project aimed to study how local adjustment strategies designed to enhance productivity utilising technological change in labour-intensive industries has affected, and will affect in the future, European non-metropolitan regions in terms of their employment potential.
The results for the Greek, Italian and Spanish firms were generously provided by the project coordinator for the present research. The same questionnaire was applied to the Portuguese sample firms during 2005.
Using common questions and an agreed coding system, the data set allows for the pooling of data by question across a group of European southern regions.
Appendix 2 – Description of database variables for networking profile
Description Codification
Supply, distribution and customers networks
Suppliers: associated local firms Suppliers: other local/regional firms Suppliers: national firms
Suppliers: EU firms
Suppliers: international firms Distributors: associated local firms Distributors: other local/regional firms Distributors: national firms
Distributors: EU firms Distributors: international Customers: local/regional market Customers: national market Customers: EU market
Customers: international market
1=yes; 0=no 1=yes; 0=no 1=yes; 0=no 1=yes; 0=no 1=yes; 0=no 1=yes; 0=no 1=yes; 0=no 1=yes; 0=no 1=yes; 0=no 1=yes; 0=no 1=yes; 0=no 1=yes; 0=no 1=yes; 0=no 1=yes; 0=no
Appendix 3 – Description of database variables for competitive strategies
Description Codification
Market Strategies
Changes in sales
Firm's response to change in sales: increased /decreased capacity Firm's response to change in sales: sought markets/left existing Firm's response to change in sales: introduced additional products Firm's response to change in sales: out-sourced tasks
Firm's response to change in sales: formed partnerships Firm's response to change in sales: acquired another firm
Investment Strategies
Firm invested in: new plant and equipment? Firm invested in: information technology?
Firm invested in: the purchase of patents & licensing?
1 = decreased; 2 = remained about the same; 3 = increased
1=yes; 0=no 1=yes; 0=no 1=yes; 0=no 1=yes; 0=no 1=yes; 0=no 1=yes; 0=no 1=yes; 0=no 1=yes; 0=no 1=yes; 0=no
Firm invested in: the development of existing products? Firm invested in: the development of new products? Investment funds used: internal funds
Investment funds used: community bank or co-operative Investment funds used: national bank
Investment funds used: government/ EU funds
Effects on workforce: displacement of existing employees
Effects on workforce: increased demand for higher skilled employees Effects on workforce: increased demand for less skilled employees Effects on workforce: increased demand for temporary employees Effects on workforce: change in the ratio part-time/full-time Desired investment results: increased labour productivity Desired investment results: increased market share Desired investment results: increased profit
Desired investment results: increased technological sophistication
Technological Strategies
Production process is customized/standardized Technologies adopted: inventory control
Technologies adopted: production process technology Technologies adopted: product design technology Technologies adopted: marketing technology Technologies adopted: web site/internet
Technologies adopted: business to business electronic networks Sources of technological knowledge: internal personnel Sources of technological knowledge: customers Sources of technological knowledge: suppliers
Sources of technological knowledge: industry associations Sources of technological: universities/colleges
Training Policy and Policy Institutions
Firm upgraded its workforce skills by: in-firm provision of training
Firm upgraded its workforce skills by: industry-organised training programmes Firm upgraded its workforce skills by: private training agencies
Firm upgraded its workforce skills by: universities
Firm upgraded its workforce skills by: technical training colleges Firm upgraded its workforce skills by: EU funded training schemes Applied to the EU for development grants for: new technology Applied to the EU for development grants for: retraining
Applied to the EU for development grants for: the expansion of firm Applied to the EU for development grant for: relocation grants Get any development grant for: new technology
Get any development grant for: retraining
Get any development grant for: the expansion of the firm Get any development grant for: relocation grants
1=yes; 0=no 1=yes; 0=no 1=yes; 0=no 1=yes; 0=no 1=yes; 0=no 1=yes; 0=no 1=yes; 0=no 1=yes; 0=no 1=yes; 0=no 1=yes; 0=no 1=yes; 0=no 1=yes; 0=no 1=yes; 0=no 1=yes; 0=no 1=yes; 0=no 1= customized; 2=standardized 1=yes; 0=no 1=yes; 0=no 1=yes; 0=no 1=yes; 0=no 1=yes; 0=no 1=yes; 0=no 1=yes; 0=no 1=yes; 0=no 1=yes; 0=no 1=yes; 0=no 1=yes; 0=no 1=yes; 0=no 1=yes; 0=no 1=yes; 0=no 1=yes; 0=no 1=yes; 0=no 1=yes; 0=no 1=yes; 0=no 1=yes; 0=no 1=yes; 0=no 1=yes; 0=no 1=yes; 0=no 1=yes; 0=no 1=yes; 0=no 1=yes; 0=no