Abstract − This paper applies the concept of fuzzy controller to voltage/VAR control. Cascading Mamdani controllers are used together with sensitivities to keep voltages in an admissible band while avoiding line flows to exceed admissible limits. A small number of iteration steps with a Newton-Raphson power flow routine are enough to recover voltages into admissible bands.
Index Terms − Fuzzy Inference Systems, Voltage/VAR control I. INTRODUCTION
HIS paper describes a new architecture for a DMS module aiming at Voltage/Var regulation in networks with a diversity of possible control devices. This architecture is based on the articulation of cascading fuzzy controllers of the Mamdani type, constituting a fuzzy inference system, with a power flow routine that periodically evaluates the effects of control actions. The fuzzy rules are related to the efficiency of a control action and the set point of each control.
Besides aiming at keeping all voltages inside the allowed band, the fuzzy inference controller must make sure that line flow limits are not violated. With these two concerns in mind, it also aims at retaining controllability of the system, leaving the choice to the operator of establishing the preferred trade-off between keeping controls closer to their nominal value at the possible cost of allowing some flexibility in complying to voltage limit constraints.
Before a final control decision is reached, the controller simulates a series of control steps and interacts with a power flow routine to evaluate the consequences of each move and successively correct and adapt the sensitivities for control efficiency and control margin.
This work is an evolution and an improvement from a previous work [1], where no concern for line flow limits was present. Previous works had already suggested the idea of building a fuzzy reasoning platform to organize a voltage and reactive power controller [2], and in general of introducing fuzzy set concepts in the control of power systems and subsystems [3]. Examples of the application of fuzzy controllers in stability may be found in [4].
The approach of using fuzzy logic concepts in power
Vladimiro Miranda is with INESC Porto, Instituto de Engenharia de Sistemas e Computadores do Porto, and also with FEUP, Faculty of Engineering of the University of Porto, Portugal (email: vmiranda@inescporto.pt).
André Moreira is with FEUP, Faculty of Engineering of the University of Porto, Portugal (email: ee01098@fe.up.pt).
Jorge Pereira is with INESC Porto and also with the Faculty of Economy of the University of Porto, Portugal (email: jpereira@inescporto.pt)
system control appears as an alternative or complement to the use of heavy methods such as simulated annealing [5], evolutionary algorithms or other meta-heuristics for the same purpose of deriving control actions to control voltage levels or reduce losses, because it seems to be some orders of magnitude more efficient in terms of computing effort.
The method aims at correcting voltages – it is not a full reactive optimal power flow and power losses are not optimized. Also, no action on active power injections is performed.
The fuzzy control approach differs from the classical paradigm of optimization in not having an explicit objective function to maximize or minimize. There is therefore no concern on minimizing sums of deviations of voltages to a specified admissible band. However, the action of the controller implements an optimization of a min-max Chebychev metric by minimizing the maximum deviation. This is quite favorable because it tends to improve voltage profiles in the systems by reducing voltage differences among buses.
We will illustrate in this paper the efficiency of the method by applying it to an overloaded IEEE test network and by comparing its performance with an alternative simulated annealing model that has been used in DMS (Distribution Management Systems) of a number of utilities [5]. The application to Distribution Management Systems becomes important in any system where distributed generation is an important factor, an evolution we have been witnessing in Europe and elsewhere.
The robustness of the fuzzy logic approach in extremely difficult convergence conditions remains to be extensively confirmed – however, this is also a challenge to other approaches. However, by quickly providing acceptable operation solutions, the method may be used as an essential building block inside a hybrid of an evolutionary algorithm and a fuzzy controller to achieve either fine tuning in difficult cases or to propose solutions for a Voltage/VAR planning and investment problem. Developments on this way will be proposed in the future.
II. BASIC DATA AND VARIABLES
In a DMS/EMS database, we have available data about lines and network topology, transformers (namely tap-changing), generators or capacitor banks. The database also stores data specified by the operator, such as limits for over- and under-voltage at the nodes of the grid. Furthermore, from
An Improved Fuzzy Inference System for
Voltage/VAR Control
Vladimiro Miranda, Fellow IEEE, André Moreira and Jorge Pereira
T
the SCADA or from the State Estimation module of the DMS/EMS one receives timely information on loads and voltages, as well as the position (state) of controllers in the system. As control devices, we have assumed in this paper that one could act on transformer taps, switching capacitor banks or generator excitation. However, the model does not exclude other forms of control.
The purpose was to design a controller that, in a DMS/EMS environment, would react when sensing that voltage thresholds were being violated. This reaction would mean defining new set points for generator voltage or for transformer or capacitor taps.
The factors to take in account are:
• The “evaluation of severity” of the most violated constraint – the controller will act to eliminate the most severe constraint violation at any time. For voltages, this means that the corresponding node must be identified. When in the presence of voltage violations and line flow violations, the most severe violation will always be a line flow constraint violation.
• The “efficiency” of a control action – to reduce a constraint violation, one has available a set of control actions (one can select any one out of a number of tap-changing transformers, capacitor banks or generators). However, depending on their nature and the location of the respective devices in the network, the impact of each action will be different.
• The “availability for control” of the control action – for instance, using a certain transformer tap to correct some low voltage or some exceeded line limit could be very efficient… if only the “position” of the controlling device were not already at its limit.
Once one defines their universes of discourse, all these factors are interpreted as variables with linguistic grades, usually going from NB – Negative Big to NS − Negative Small, ZE – Zero, PS − Positive Small and PB − Positive Big.
A. Efficiency
Each change in a control position Πj(.) at a node j will have
impact on the voltage value at another node k, and impact on line currents at each line i. A classical way to evaluate such impact is by means of sensitivity coefficients SVkjfor voltage and SFkj for line flows obtained from partial derivative concepts j k V kj V S Π ∂ ∂ = and j i F ij F S Π ∂ ∂ =
However, partial derivatives are local concepts and do not give a correct picture of the shape of the function and of the real impact in a controlled value for larger than infinitesimal changes. This has been well observed in [2], where a scheme based on “Experiment Planning” has been suggested to derive more adequate sensitivities.
In any case, it has been shown that sensitivities evaluated from imposing ∆Π variations in controls and checking the impact on the nodal voltages work better. In our work we did not follow the suggestion of [2] but we actually built
sensitivity matrices by organizing a series of experiments with discrete step changes in each possible controlling variable.
The sensitivity values may be negative or positive and, upon examining their numerical range, they are scaled into an interval [-1,1] generating therefore a signal that becomes associated with a linguistic variable “efficiency” ranging from NB to PB.
There may be two signals for efficiency: one for voltage control and another for line flow control, depending on the objective of the action to be taken.
B. Evaluation of severity in voltage violation
For Voltage control, the condition to be met is Max
k k min
k V V
V ≤ ≤ for all k nodes.
This creates a “dead band” where no control action is required. Outside this band, the severity of the violation ∆ Vk
is proportional to its value – either ∆V=Vk −Vkmin or Max
k k V V V= −
∆ . ∆ can therefore be negative or positive. Vk A plausible interval for violations is defined, say [a,b] and a violation in this interval is made to correspond to a value in an interval [-1, 1]. Values of ∆V below a are mapped to –1 and values above b are mapped to 1. We have, therefore, created a signal SV that may be associated to a linguistic variable
“voltage violation severity”, with values such as NB to PB as before.
C. Evaluation of severity in line flow violation
For line flow violation, the condition to be met is
Max i i min i F F F ≤ ≤
where usually Fimin =−FiMax, representing in this way reverse line flows.
This creates a “dead band” where no control action is required. Outside this band, the severity of the violation ∆ Fk
is proportional to its value, either Fkmin −Fi or Fi −FiMax.
A plausible interval for violations is defined, say [a,b] and a violation in this interval is made to correspond to a value in an interval [-1, 1]. Like before, we have created a signal SF that
may be associated to a linguistic variable “line flow violation severity” with values from NB to PB.
D. Position
A controlling variable Πj is associated with a control range
[
Max]
j
j
Π
Π
min,
and it may be changed within such interval, which includes in a more or less central location the nominal value Πnomj .We have mapped the interval
[
Π ,
minjΠ
nomj]
into[ ]
-1,0 and[
Π
nomj,
Π
Maxj]
into[ ]
0,1 and therefore built a signal called “position” of the control.III. CONTROLLER DESIGN
A. Basic architecture
The Voltage/VAR controller must produce a control command that is a vector of control signals, one for each controlling device. The whole system acts as a Multiple Input – Multiple Output system, because we control voltages in all buses of the network and generate control signals for a number of control devices at the same time.
In our model, each of the controlling device signals is controlled by a controller with the architecture displayed in Figure 1. The control system relies on three Mamdani fuzzy controllers, C1, C2 e C3. Together, they accumulate a rule base. The activation of these rules generates the control signal required for a control device (e.g., a generator excitation, a tap changing transformer or a tap changing capacitor bank).
In all controllers we have used, for simplicity and with good results, triangular fuzzy sets. The universe of discourse of all variables has been partitioned in 5 linguistic values – NB (negative big); NS (negative small); ZE (zero); PS (positive small); PB (positive big). A set of rules has been defined for each Mamdani inference engine in the form of a Fuzzy Associative Memory. violation Voltage control strength C2 - Controller 2 C3 - Controller 3 line saturation control power efficiency Combine both signals in order to obtain the desired Control Action Line control strength efficiency position C1 - Controller 1
Figure 1 – Cascading fuzzy controllers to form the control block used.
The idea to use Mamdani fuzzy controllers for Voltage/VAR control ends up by combining the results obtained from the cascade of C1 and C2 with the results from C3 by following a set of (crisp) rules. Basically, if both control signals, from C2 and C3, suggest a change in a controller position with the same signal, the final Control Action will be the stronger of the two, typically moving the controller position further from the initial position it had. On the other hand if the control signals have opposing signals, the Control Action will be the one suggested by C3 because a signal from C3 means that line current limits are being violated.
These variables representing control signals have been evenly distributed within the interval defining the universe of discourse: [-1, 1] in all cases.
In the fuzzy set operations performed, we have used the
min operator as the T-norm (for intersections and implications) and the Max operator as the S-norm (for union).
The defuzzification method adopted has been the Center of Mass, in all fuzzy controllers. This means that the output of C1 is defuzzified before inputting in C2. And both C2 and C3 signals are defuzzified before combining them to obtain the Control Signal.
The defuzzified control signal output, in the range [-1, 1], is then mapped into the admissible range for the controlling device, i.e., if the controller can support continuous values it makes the change proposed by the control signal, on the other hand if it supports only discrete values the control signal is rounded (with a given probability to the closest value) to fit this requirement.
B. Controller algorithm
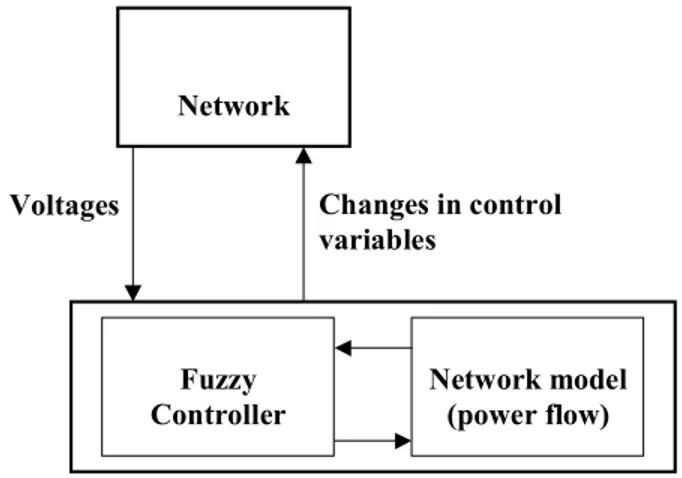
The evaluation of system voltages is done using a power flow routine (in our case, with a Newton-Raphson algorithm), in an iteration loop as represented in Figure 2until some stopping criterion is met.
Network
Network model (power flow) Fuzzy
Controller
Voltages Changes in control
variables
Figure 2– General scheme of the control loop
IV. CONVERGENCE METHOD
The control signal must be scaled up to match the control range of each device. This scaling originates an iteration step size that may be used to determine the end of controller calculations.
In mild cases with a small number of voltage violations the controller easily corrects the bus voltages into an admissible band, only requiring a small number of calls to the power flow routine. However, in more stressed cases, with a system facing overloads, having multiple violations and with limited control capacity (for instance, because only a small number of devices are allowed to operate to correct voltages), one may face a situation where it may not be possible to drive all voltages inside the target “dead band”. It may then happen that forcing some voltage into the admissible band may drive the voltage at another bus to exceed its limit and no feasible solution is found.
In such a case, when this condition of no feasibility is detected, one slowly relaxes (in increments of 0.005 p.u) the constraint defining the amplitude of the dead band, making it
larger step by step. This process will eventually find the minimum width of the dead band that retains a solution with the minimum violation possible and will generate the appropriate controls. This is an extension of the min-max concept because the controller is still trying at all times to minimize the maximum violation.
On the other hand, when a feasible solution exists, this procedure may be inverted to allow narrowing down the dead band limits so that a solution is reached with the voltage profile as flat as possible or desired. It may however not be advisable to try to force the system into too flat voltage profiles because this may come at the cost of large voltage angles with line currents leading to greater power losses.
V. APPLICATION EXAMPLE
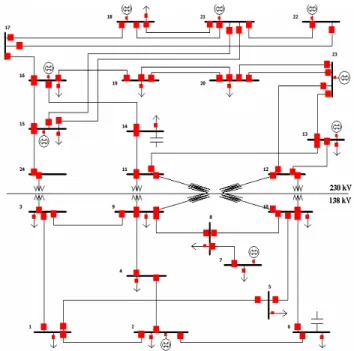
Following the principles described in the previous sections, we have tested the concept over a system based on the 24 bus network known as IEEE RTS (Reliability Test System).
The system is represented by a network with 24 buses, including 9 power injection buses and 15 load buses – see Figure 3. It has 33 branches 5 transformers and 2 capacitor banks.
There are two main voltage levels in the system (230 and 138 kV), and the main power injection comes from an interface with an interconnected transmission system (bus 1). The other power injection sources are generators.
The operator has the possibility to control voltage levels by acting at 16 places: nine generators, five transformer groups (transformers in parallel have their taps changed to the same levels) and two capacitor banks. In order to build the voltage controller, we have prepared 16 control blocks similar to the one in Figure 1 – a block to each control variable (9 for generator voltages, 5 for transformer taps and 2 for capacitor bank taps).
All simulations were performed using a C software environment and with a Newton-Raphson power flow routine.
The total load is defined in two scenarios:
o BS (base case scenario), with 3000 MW, 500 MVAr o HL (high load) with 125% of BS load
The target voltage bandwidth is of 5% or [0.95, 1.05] p.u.. Line current limits were set to (1 p.u. ⇔ 100 A):
o HC – high line capacity scenario: 5 p.u. o MC – moderate line capacity: 3 p.u o LC – low line capacity: 2,5 p.u.
Several simulations were performed, with different control options:
o CN – Controllers starting at nominal positions o CM – Controllers starting at their maximum position o Cm – Controllers starting at their minimum position o CR – Controllers started with random initialization
We have calculated the sensitivity coefficients for node voltages relative to the 16 controlling variables, and built the required matrices.
Figure 3– Single line diagram of the IEEE RTS test system.
Figures 5 and 6 present the bus voltage profile and the line current profile before and after the controller action, in the base case, with line limits set to the LC scenario (low limit of 250 A or 2.5 p.u.) and the starting position of control devices in their nominal values.
Before controller action, the analysis of case {BS/HC} shows that many node voltages (20%) are below the limit of 0.95 p.u. determined as the admissible threshold (see Figure 4), with no line flow violations. A power flow violation in line 10 is however detected in case {BS/LC} – see Figure 5. In these simulations, we have allowed generator excitation to play a role in controlling voltages, with extreme efficiency (less than 10 calls to the Newton-Raphson routine needed).
In a more severe test, we allowed only the action of transformer taps and capacitor banks to try to keep voltages and line currents within limits, the use of generator excitation not being allowed. The following tables 1 and 2 summarize the analysis of the results obtained in all the runs for the cases listed above. In table 1, columns “Fuzzy”, we find the number of iterations (calls to the Newton-Raphson routine) required in order to reach a solution.
Figure 4 – Voltage profile before and after the control action proposed by the fuzzy controller system in case {BS-CN/LC}
Figure 5 – Current profile before and after the control action proposed by the fuzzy controller system in case {BS-CN/LC}
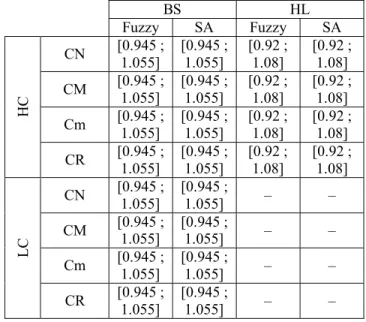
Table 2, columns “Fuzzy”, present the final best bandwidth that it was possible to reach with the action of the controller. The cases where no feasible solution was met are marked with “–”, meaning that no solution was found satisfying the line current constraint. These are cases with high load and low line flow capacity.
In order to compare with an alternative method, we show in the same tables the number of calls to the Newton-Raphson routine needed by a Simulated Annealing (SA) method to reach a comparable solution. This routine [5] is currently integrated in a commercial DMS platform and used by a number of utilities in the world. One may observe that the Fuzzy Controller demands a computer effort that is less than one order of magnitude of the effort required by the Simulated Annealing approach. Furthermore, in no case could the SA routine find a better solution than the one found by the controller, and no feasible solution was discovered by the SA also when the Fuzzy controller did not find one.
The number of iterations shown in Table 1 for the Fuzzy Controller in case BS (base case load) correspond to the number of iterations needed to find the first solution satisfying the requirement of having all voltages inside the minimum width voltage band possible. An additional number of iterations is in general performed to confirm that such band cannot be narrowed. For testing purposes, we have allowed the algorithm to continue calculating until the arbitrary total of 121 iterations in each case, and in all cases no solution with better (narrower) voltage profile was discovered.
TABLE 1 – NO. ITERATIONS (CALLS TO THE NEWTON-RAPHSON ROUTINE) UNTIL CONVERGENCE – CASES IDENTIFIED IN THE TEXT
BS HL Fuzzy SA Fuzzy SA CN 52 395 34 484 CM 74 653 57 748 Cm 38 258 19 224 HC CR 76 471 45 608 CN 21 380 – – CM 35 718 – – Cm 71 247 – – MC CR 29 515 – –
TABLE 2 – VOLTAGE BANDWIDTH GUARANTEED – CASES IDENTIFIED IN THE TEXT BS HL Fuzzy SA Fuzzy SA CN [0.945 ; 1.055] [0.945 ; 1.055] [0.92 ; 1.08] [0.92 ; 1.08] CM [0.945 ; 1.055] [0.945 ; 1.055] [0.92 ; 1.08] [0.92 ; 1.08] Cm [0.945 ; 1.055] [0.945 ; 1.055] [0.92 ; 1.08] [0.92 ; 1.08] HC CR [0.945 ; 1.055] [0.945 ; 1.055] [0.92 ; 1.08] [0.92 ; 1.08] CN [0.945 ; 1.055] [0.945 ; 1.055] – – CM [0.945 ; 1.055] [0.945 ; 1.055] – – Cm [0.945 ; 1.055] [0.945 ; 1.055] – – LC CR [0.945 ; 1.055] [0.945 ; 1.055] – –
We illustrate this in Figure 6, for the {BS-HC-CN} case, presenting a graph of the value of the voltage violation at the worst node along iterations. As we can see the worst voltage violation is converging to zero but with oscillations: forcing a certain voltage in a certain node inside the admissible band was forcing out other voltages in other nodes. In these cases where no feasible solution is met for a specified band, we use a min-max approach that relaxes the constraint defining the amplitude of the band. In the tests performed, this relaxation was done after 120 iteration steps.
In figure 7 we are able to see the controller reaching a solution for the [0.945; 1.055] bandwidth in 52 iterations, which is the first time we manage to find a point where all voltages are inside the nominal admissible band [0.95; 1.05] p.u. We also see that from there on, in no iteration the violation value became zero, so no feasible solution has been found for the bandwidth [0.95; 1.05] p.u. – until the bandwidth was increased in iteration 121 to [0.945; 1.055] and the violation became zero.
Figure 6 – Evolution of the worst voltage violation along iterations in the {BS-HC-CN} case. The oscillations reveal that pushing down this violation must be pushing up a violation at another node. Convergence is achieved at iteration 121 when the admissible bandwidth is increased by 0.05 p.u.
VI. CONCLUSIONS
This paper demonstrates the feasibility of using a cascading
Worst voltage violation”
0 0.05 0.1 0.15 0.2 0.25 1 10 19 28 37 46 55 64 73 82 91 100109 118 Deiation from adm. band
set of fuzzy controllers of the Mamdani type to build a voltage control system to be integrated in a DMS/EMS environment.
The model developed gives place to an extremely efficient procedure that only requires a small number of power flow runs to reach a good solution.
As a first order approach, it demonstrates great superiority over methods that search for optimal controls by using heavy meta-heuristic algorithms such as simulated annealing – and one reasonably expects that the same competitive advantage will be shown against any evolutionary algorithm. These ones may require hundreds to thousand of evaluations using a load flow routine, while the Fuzzy Control system only requires typically a very low number.
This speed superiority is especially observed in cases where the network is not particularly stressed, when generation excitation is also allowed to contribute to voltage control and when no line current violations are detected. In these cases, a one digit number of iterations has been observed.
Because it is a method relying on sensitivities, one cannot hide that there is the theoretical possibility it may get trapped in local optima. This possibility, however, also exists in other methods.
Another interesting feature of the concept developed is the possibility of using (in a limited extent) the reactive power dispatch to avoid line overload. The fuzzy controller takes care of both aspects: voltage/VAR control and line overload.
The report presented in this paper confirms the results obtained by other researchers that the application of concepts of fuzzy inference to the Voltage/VAR control and loss minimization problems is an excellent approach. Furthermore, one demonstrates that there is no need for a complex model building a fuzzy rule base and an inference engine: simply cascading Mamdani controllers achieves a very good result.
VII. REFERENCES
[1] V. Miranda and P. Calisto, “A fuzzy inference system to voltage/VAR control in DMS - distribution management systems”, in Proceedings
of PSCC – Power Systems Computation Conference, Sevilla, Spain,
May 2002
[2] Marcio Junges, “Fuzzy Logic in voltage and reactive power control in power systems” (in Portuguese, “Lógica fuzzy em controle de tensão e potência reativa em sistemas de potência” ), M.Sc. Thesis, Pontifícia Universidade Católica de Minas Gerais, no. 621.31J95|T - PucMinas Library, Belo Horizonte, Brazil, 2000
[3] Petr Ekel, Luiz Terra, Marcio Junges, Vladimir Popov “Fuzzy technology in the design, planning and control of power systems and subsystems”, Proceedings of EUFIT’98 - European Congress on
Intelligent Techniques and Soft Computing, vol.2., pp. 1126-1130,
Aachen, Germany, 1998
[4] “Electric Power Applications of Fuzzy Systems” (book), ed. Mohamed
El-Hawary, IEEE Press Series on Power Engineering, 1998
[5] Jorge Pereira, J. Tomé Saraiva, Maria Teresa Ponce de Leão,
“Identification of operation strategies of distribution networks using a simulated annealing approach", Proceedings of IEEE Budapest
Power Tech'99, paper BPT99-357-17, August 1999
VIII. BIOGRAPHIES
Vladimiro Miranda (M’90-SM’04-F’05) received his graduation, Ph.D. and Agregado degrees from the Faculty of Engineering of the University of Porto, Portugal (FEUP) in 1977, 1982 and 1991, all in Electrical Engineering.
In 1981 he joined FEUP and currently holds the position of Professor Catedrático (Full Professor). He is also currently Director of INESC Porto. He has authored many papers and been responsible for many projects in areas related with the application of Computational Intelligence to Power Systems
André Moreira received his graduation from FEUP in 2006 in Electrical and Computer Engineering, and worked at INESC Porto as young researcher in the Power Systems Unit.
Jorge Pereira received his graduation in Applied Mathematics and Computer Science from the Faculty of Sciences of the University of Porto and MSc. and PhD. degrees in Electrical Engineering and Computers (Power Systems) from FEUP, in 1995 and 2002. He is now Assistant Professor at the Faculty of Economy of the University of Porto and Senior Researcher at INESC Porto. His interests are related with the development of DMS systems, application of soft computing techniques and tariffs due for the use of transmission and distribution networks