American Journal of Applied Sciences 1 (4) 354-357, 2004 ISSN 1546-9239
© Science Publications, 2004
354
Simulation of Voltage Stability and
Alleviation Through Knowledge Based System
1
A. Arunagiri and
2B. Venkatesh
1Faculty of Engineering,
2Faculty of Engineering and Technology,
Multimedia University, Cyberjaya, 63100, Malaysia
Abstract: Modern power systems are large sized and rapidly growing. They require constant attention to monitor their performance. Attention is also required to ensure that the voltage stability margin of the power system is above a desired level. In order to achieve the objective, this study proposes a knowledge-based system. It computes using simple Fast De-Coupled Load Flow (FDLF), the state of a power system. Thereafter, the power system is subjected to an additional load at a certain power factor. If the power system collapses, then additional capacitor that needs to be switched on is computed by an iterative procedure. This is done for different load levels and tabulated. Thereafter, in the actual usage, based upon the computed Table, given any load one may determine the level of compensation required to avert voltage collapse.
Key words: Voltage Stability, Voltage Collapse, Knowledge-Based System
INTRODUCTION
Voltage instability in a power system occurs due to lack of reactive power. It occurs either at the sources due to var output limit or inability of the network to deliver the real power due to lack of local reactive power at the network location. The first form of voltage instability is source dependent. The second form of voltage instability is network dependent[1, 2].
A system enters the state of voltage instability when an increase in load demand or change in system condition causes a progressive and uncontrollable fall of voltage. Load variations or contingencies in general cause voltage collapse. In this study voltage collapse due to load variations is considered.
Numerous methods have been proposed for alleviating voltage instability. These methods predominantly use Jacobian sensitivities for improving voltage stability margin[3-5]. These methods are considered the change in real and reactive power controllers to improve voltage stability margin. However they require a lot of computation and time.
In this study, the load on a particular bus is increased until the voltage collapse occurs. Then the minimum reactive power to be injected at the particular load bus is calculated by an iterative method. The same procedure is repeated for different load conditions and the corresponding Kvar to be injected has been calculated. This helps to form an expert system database, which used effectively to alleviate voltage instability.
Effect of Compensation: Compensation consists of injecting reactive power to improve power system
operation. More specifically keep voltages close to nominal values, reduce line currents and hence network losses. Reactive power compensation also contributes to the voltage stability margin enhancement. Compensation is provided by either capacitors installed in series with transmission lines or shunt elements connected to a particular load bus. In this study shunt compensation technique is adopted to improve the voltage stability margin. Shunt Compensation: The connection of shunt capacitors is the simplest and most widely used form of compensation. To investigate its effect in some detail, a simple system is shown Fig. 1. It combines the effect of line charging susceptance B1 with that of an adjustable
shunt compensation susceptance BC.
The maximum deliverable power under power factor cosφ is given as below:
(
)
2 2
th MAX
th c 1
cos E 1 cos E
P
1 sin 2X 1 B B X1 sin 2X
ϕ ϕ
= =
+ ϕ − + + ϕ (1)
and the corresponding load voltage:
(
)
th MAXP
c 1
E 1 1
V
1 B B X 2 1 sin
2 1 sin
= =
− + + ϕ
+ ϕ (2)
(
)
th
c 1
1
E E
1 B B X
=
− + (3)
(
)
th
c 1
1
X X
1 B B X
=
American J. Appl. Sci., 1 (4), 354-357, 2004
355 Fig. 1: Simple Transmission Line Diagram
Fig. 2: PV Curves for a Power System
Line resistance is neglected. PMAX and VMAXP
increase by the same percentage when network capacitances are taken into account and/or capacitive compensation is added.
Figure 2 shows a situation where as load power increases, more shunt compensation has to be added in order to keep the voltage within the limits shown by the dotted lines (typically 0.95 p.u. And 1.05 p.u. Respectively). The resulting PV curve is shown in a thick line[6].
Thus it is clear that the addition of shunt compensation improves voltage stability margin of a power system. When the system is stressed, switching in more capacitive compensation helps to deliver more real power.
MATERIALS AND METHODS
Sometimes, the power system is operated at higher load than expected. In such situations, the extra load may cause voltage collapse. Adding an additional capacitive compensation may alleviate this situation.
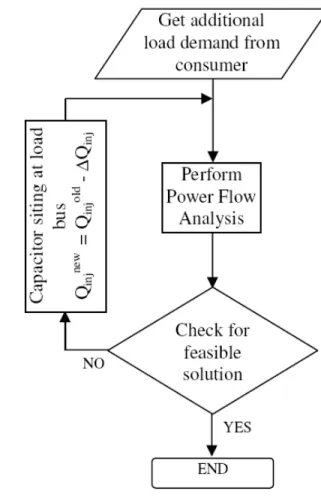
Fig. 3: Flow chart of the Proposed Method
The following are steps that are followed in the alleviation process. They are also given in Fig. 3 as a flow chart:
1. First add more load as desired to the specified bus. 2. Solve the load flow equations using fast de-coupled
load flow method.
3. Determine whether a converged solution is obtained.
4. If the solution is converged, then there is no need for capacitive compensation.
5. If there is no feasible solution for the power flow equations, then corrective action is taken through the next step.
6. Select an appropriate value for the addition of capacitive compensation at the desired bus. 7. Go to step 2 and repeat steps 2 to 6.
The algorithm given above is simple. It uses the fast decoupled load flow algorithm for the solution of power flow equations. This makes the proposed algorithm computationally efficient.
American J. Appl. Sci., 1 (4), 354-357, 2004
356 may relate the change in reactive power injection to change in bus voltage:
I II
I
Q B
V
∆ =
∆ (5)
where, BII is the i th
diagonal element of B'' matrix. This allows simple computation of required ∆Q to improve the bus voltage. The change in bus voltage is taken as 0.1 p.u.
Thus every time step 6 is processed the reactive power injection is increased by the following equation:
new old inj inj inj
Q =Q − ∆Q (7)
RESULTS AND DISCUSSION
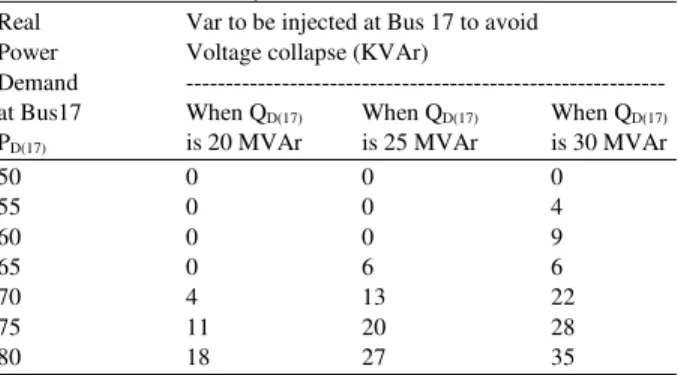
The algorithm was tested upon the standard IEEE 30- bus system. The load was increased as Bus Number 17. The real power demand was increased from a value of 50 MW to 80 MW in steps of 5 MW. The reactive power demand at the same bus was kept constant at either 20 Mvar or 25 Mvar or 30 Mvar. For each case considering the three values of reactive power demand, the minimum required capacitive compensation were computed to maintain feasibility of power flow equations. This result is documented in Table 1. The results are graphically shown in Fig. 4. It may be observed that as the real power demand increases for a constant reactive power demand, the capacitive compensation is not required until a particular real power demand value is reached. Thereafter, an approximately linear curve is obtained from the relation between real power demand and the required reactive power compensation to alleviate possible voltage collapse.
It may be also observed from this graph that as the reactive power demand increases, the capacitive compensation value increases in the same real power demand.
The results of the load flow equations for convergent case and divergent case are shown in Table 2 and 3 respectively.
Knowledge based system: Table 1 of the study gives the relation between real power demand and the expected compensation for a given reactive power demand. This procedure may be adopted for computation of required capacitive compensation for an expected real power demand at all the buses of the power system. Thereafter, for a given condition, when the system real power load increases at particular bus, the required capacitive compensation may be computed directly from this relation.
Fig. 4: Relation between Real Power Demand and Table 1: Var Calculation by Iterative Method
Real Var to be injected at Bus 17 to avoid Power Voltage collapse (KVAr)
Demand --- at Bus17 When QD(17) When QD(17) When QD(17) PD(17) is 20 MVAr is 25 MVAr is 30 MVAr
50 0 0 0
55 0 0 4
60 0 0 9
65 0 6 6
70 4 13 22
75 11 20 28
80 18 27 35
Table 2: IEEE 30 Bus-bus Convergent Case Power Flow Solution By Newton Raphson Method Maximum Power Mismatch = 0.00029591 Number of Iterations = 14
American J. Appl. Sci., 1 (4), 354-357, 2004
357 Table 3: IEEE 30 Bus-bus Divergent Case
Power Flow Solution By Newton Raphson Method Maximum Power Mismatch = 0.00029591 Number of Iterations = maximum
Bus Voltage Angle Load Generation No. Mag. degree MW Mvar MW Mvar 1 0 0 103.59 14.04 2 21.7 12.7 80 24.15 3 2.4 1.2 0 0 4 7.6 1.6 0 0 5 94 19 50 18.42
6 0 0 20 24
7 22.8 10.9 0 0 8 30 30 20 39
9 0 0 0 0
10 5.8 2.0 0 0 11 0 0 20 24 12 11.2 7.5 0 0 13 No solution 0 0 20 240 14 6.2 1.6 0 0 15 8.2 2.5 0 0 16 3.5 1.8 0 0 17 9 5.8 0 0 18 3.2 0.9 0 0 19 9.5 3.4 0 0 20 2.2 0.7 0 0 21 17.5 11.2 0 0 22 0 0 0 0 23 3.2 1.6 0 0 24 8.7 6.7 0 0 25 0 0 0 0 26 3.5 12.3 0 0 27 0 0 0 0 28 0 0 0 0 29 2.4 10.9 0 0 30 10.6 11.9 0 0
The relation between the required capacitive compensation QCi and the expected increased real
power demand PDi for a given reactive power demand
QDi may be computed from a generic equation as:
( )
( )
Ci Di Di Di
Q = α Q ∗P + β Q (8)
This equation is the approximate straight line representation between required capacitive compensation for an expected real power demand at the given reactive power demand. The constants α and β, are the functions of the reactive power demand QDi.
CONCLUSION
This study reports an iterative approach to determine the shunt Var compensation required for maintaining voltage stability of a power system working under stressed conditions for different load conditions. The study also provides a knowledge based system to determine the Var compensation required to maintain voltage stability of the system for any real and reactive power requirement at a particular bus of the system. The voltage stability assessment and Var calculations were carried out on IEEE 30-bus system and the results are presented.
REFERENCES
1. Gao, B., G. K. Morrison and P. Kundur, 1992. Voltage stability evaluation using modal analysis. IEEE Trans. On Power System, 7: 1529-1542. 2. Venkatesh, B., H. B. Gooi and Rakesh Ranjan,
2002. Effect of Minimizing VAr Losses on Voltage Stability Margin in a Unified OPF Framework. IEEE Power Engineering Review Letters, pp. 45-47.
3. Venkatesh, B., H. B. Gooi and A. Arunagiri, 2003. Unified OPF Method for Maximizing Voltage Stability Margin using Successive Fuzzy LP. Int. J. Electric Power Sys. Res., 64: 119 - 128.
4. Venkatesh, B., Rakesh Ranjan and A. Arunagiri, 2003. On-line ANN Memory model based method for Unified OPF and Voltage Stability Margin Maximization. Accepted for publication in the Int. J. Electric Power Components and System, USA, 31: 453-465.
5. Venkatesh, B., G. Sadasivam and M. Abdullah Khan., 2000. A new optimal reactive power scheduling method for loss minimization and voltage stability margin maximization using successive multi-objective fuzzy LP technique. IEEE Transactions on Power Systems, 15: 844 - 851.