MSC in Finance
Master’s Final Work – Dissertation
Capital Structure and Risk Mitigation in the
Renewable Energy Sector. The Public-Private
Partnership experience in Cabo Verde
Bruno Miguel Delgado Gomes Lopes
MSC in Finance
Master’s Final Work – Dissertation
Capital Structure and Risk Mitigation in the
Renewable Energy Sector. The Public-Private
Partnership experience in Cabo Verde
Author: Bruno Miguel Delgado Gomes Lopes
Supervisor: Maria Rosa Vidigal Tavares da Cruz Quartin Borges
Acknowledgements
I would like to thank my supervisor Prof. Rosa Borges for the valuable guidance and for all the constructive feedback.
My acknowledgement to Cabeolica representatives that allowed me to study and share relevant information regarding the project’s risk and capital structure. This project is indeed a milestone in our country and our region.
Most important, I would like to thank my family. My parents for the education and for being responsible for who I am, my sisters for always being there when I need them and my wife and daughters for all the love and understanding.
Abstract
Understanding Capital Structure has been a continuing concern, with a significant amount of research done, different models developed and various activity sectors extensively analyzed. However, there are not many studies with focus on the capital structure in the renewable energy sector and its relation to risk mitigation.
This study’s main purpose is to contribute to research on the capital structure in the renewable energy sector, especially in the case of PPPs, and to find whether these firms follow any of the classical capital structure theories and whether there is a relationship between their capital structure and risk mitigation, using as methodology the case study of a PPP wind power company funded through project finance and responsible for more than 20% of the energy produced in Cabo Verde, a small island developing state in Africa.
In the case analyzed, our results can possibly suggest that (i) “pecking order” and “trade-off theories” partially explain the leverage and (ii) risk mitigation instruments in place, including the equity and financing partners involved, legal and contractual guaranties and regulatory framework, partially explain the leverage and significant share of participation of private investors.
Keywords: Capital Structure, Public-Private Partnership, Risk Mitigation, Renewable Energy
Resumo
Entender a estrutura de capital tem sido uma preocupação constante, com um volume significativo de investigação efetuada, diferentes modelos desenvolvidos e vários sectores de atividade amplamente analisados. No entanto, não existem muitos estudos com o foco na estrutura de capitais no sector das energias renováveis e a sua relação com a mitigação de risco.
Este estudo teve como principal objetivo contribuir para a investigação sobre a estrutura de capital no setor das energias renováveis, particularmente no caso das PPPs e procurar entender se estas empresas seguem alguma das teorias clássicas de estrutura de capital e se se existe alguma relação entre estrutura de capital e a mitigação de risco, utilizando como metodologia o estudo de caso de uma empresa de energia eólica que resulta de uma PPP, financiada através de project finance e responsável por mais de 20% da eletricidade produzida em Cabo Verde, um pequeno estado insular em desenvolvimento em África.
Os resultados não foram conclusivos, entretanto, no caso analisado, poderão eventualmente sugerir que (i) as teorias de “pecking order” e “trade-off” explicam parcialmente a alavancagem financeira e (ii) os instrumentos de mitigação de risco em vigor, incluindo os investidores e financiadores envolvidos, as garantias legais e contratuais e o quadro regulatório, poderão justificar parcialmente a alavancagem financeira e a elevada participação dos investidores privados.
Palavras-Chave: Estrutura de Capital, Parceria Público-Privada, Mitigação de Risco, Energia Renovável
Table of Contents
1. Introduction ... 1
1.1 Overview ... 1
1.2 Purpose and relevance ... 3
1.3 Preliminary hypothesis ... 4
1.4 Brief summary of previous research on the subject ... 5
1.5 Structure ... 5
2. Literature Review ... 6
2.1 Capital Structure ... 6
2.2 PPP and Risk Mitigation ... 9
3. The case of the PPP experience in Cabo Verde ... 15
3.1 Electricity and Renewable Energy sector in Cabo Verde ... 15
3.2 Cabeólica Project ... 18
4. Methodology ... 24
5. Results ... 26
6. Conclusions ... 33
6.1 Main Conclusions ... 33
6.2 Limitations and Further Research ... 35
List of Tables
Table I: Summary of Risks and Mitigation Instruments Table II: Key Indicators for Electricity Sector in Cabo Verde Table III: Main Stakeholders of the project
Table IV: Cabeólica’s Balance Sheet 2012-2014 Table V: Cabeólica’s Income Statement 2012-2015
Table VI: Cabeólica’s Key Financial and Technical Indicators Table VII: Cabeólica’s Leverage Indicators
Table VIII: Leverage Indicators from EU and US Companies Table IX: Cabeólica’s Risks and Mitigation Instruments
List of Graphs
Graph 1: Installed Capacity
Graph 2: Installed Capacity by Source
1. Introduction
1.1 Overview
The growing need for energy and the consequent increase of the energy infrastructure gap, at a worldwide scale and particularly in developing countries, the price volatility of energy commodities, which has caused a persistent search for energy independence, and greater global environmental awareness have together led to a stronger commitment by governments to develop renewable energy sources and mitigate the alarming increase in greenhouse emissions. The Kyoto protocol and the recent COP 21 meeting in Paris are the most relevant results of this commitment.
On top of this, the recent economic crisis has put significant pressure on the need to determine an efficient capital structure that can enable firms to finance large infrastructure assets. This crisis has, at the same time, reduced some countries’ ability to finance infrastructure through public debt, particularly renewable energy infrastructure, which usually requires large amounts of upfront investment upfront. The ability to implement an efficient capital structure and the option for Public-Private Partnerships (PPP) arise as important topics for this ever-growing investment gap.
In the specific case of Cabo Verde, the PPP model for renewable energy investment played and will most probably continue to play a critical role because:
(ii) the country has a particularly vulnerable economy, importing most of the goods consumed and with oil derivatives as the main individual item of its regular imports according to the INE – National Institute of Statistics (trading statistics for the 1st quarter of 2016);
(iii) being a small island developing state, it is specially exposed to the consequences of climate change;
(iv) feasibility of renewable energy projects without public subsidy is possible since the country has good wind and solar resources and, being an island state, it has high electricity production costs when using conventional fuel-based power;
(v) the country’s public debt is very high, above 115% of GDP already in 2015, and is expected to increase in 2016 according to the World Bank country overview (2015), limiting government investment ability; (vi) there was a need for specific financial and technical expertise from the
private sector, but the risks associated with the lack of sound financials from the state-owned utility company and the lack of an adequate legal and regulatory framework also requires government direct participation in the contracts for necessary guarantees.
In fact, recent investments have increased renewable energy penetration in the country from 2% in 2010 to 25% in 2015. The Cabeolica wind power PPP in particular is responsible for 21% of the country’s energy consumption, positioning itself as one of the highest wind power penetration rates in the world, a PPP of reference in Africa and a leading company in the West African region. For a relatively small project in a small sub-Saharan African country, the importance
and impact of this project as the first and only commercial-scale Wind Power PPP operating in Sub-Saharan Africa (excluding South Africa) is indeed outstanding.
1.2 Purpose and relevance
For the reasons stated above, capital structure is indeed important for companies investing in large infrastructure assets, especially in the case of renewable energy where capital costs represent most of the total costs and where adequate risk mitigation and allocation between its investors and between investors and lenders becomes a critical success factor.
The purpose of this study is precisely to understand the capital structure in the renewable energy sector, especially in the case of PPPs, and to find whether these firms follow any of the classical capital structure theories and whether there is a relation between their capital structure and risk mitigation.
Capital structure theories have been studied extensively, but we understand that there are not many studies focusing on the capital structure of PPPs in the renewable energy sector, not many studies investigating its relationship with risk mitigation, something particularly critical to this sector, and definitely not many case studies in sub-Saharan Africa and small island developing states, places where the energy infrastructure gap is most significant and where, in many cases, renewable energy investment makes perfect sense.
We understand that studying the capital structure and risk mitigation instruments of this specific case study also has significant practical relevance as it might help better understand the reasons for the company’s success and the key features that can ensure replicability in sub-Saharan Africa.
1.3 Preliminary hypothesis
Applying the investigation made on this field to our particular case study, we expect the results from our case study to potentially indicate that “pecking order” and “trade-off” theories partially explain the capital structure decision and that risk mitigation instruments in place are relevant to the capital structure, since equity partners chosen, legal and contractual guaranties in place and regulatory framework can potentially increase the share of participation of private investors and the level of debt obtained from Lenders in renewable energy companies. Therefore, we formulate the following hypothesis on our study:
Capital Structure
Hypothesis 1 - The capital structure in the case study is likely to follow “pecking order theory”.
Hypothesis 2 - The capital structure in the case study is likely to follow “trade-off theory”.
Hypothesis 3 - Leverage in the case study is likely to be similar to leverage of larger companies of the same industry in developed and larger economies. Risk Mitigation
Hypothesis 4 – Leverage of the case study is positively related with Risk Mitigation.
Hypothesis 5 – Private investors’ equity share in the case study is positively related to Risk Mitigation.
1.4 Brief summary of previous research on the subject
In this study, we analyzed the most relevant previous research related to Capital Structure and to Public-Private Partnership, particularly the main concepts and theories, risks and mitigation instruments, and we took into consideration the specific characteristics of the renewable energy sector. We started by analyzing the most widespread capital structure theories, particularly Modigliani & Miller’s (1958) “irrelevance theory”, the “trade-off theory” and the “pecking order theory”, and studied the concept, characteristics and main risks associated with a PPP and its financing, as well as consensual studies about mitigation instruments for PPP, with particular interest in renewable energy and developing countries.
1.5 Structure
We first review the relevant literature related to our study, particularly that related to the concepts of capital structure, PPP and risk mitigation, and we then analyze the renewable energy sector in Cabo Verde and the Cabeolica case in more detail. Here, we try to understand if this case follows any of the classical capital structure theories and whether there is a relation between its capital structure and risk mitigation. Finally, we reach possible conclusions and we highlight the limitations of this study and suggest further research.
2. Literature Review
2.1 Capital Structure
Capital structure has been studied extensively for the last 50 years, with research focused essentially on searching for the determinants of an optimal capital structure. The research on this field started with the considered classical theories and particularly with Modigliani & Miller’s (1958) “irrelevance theory,” which assumed perfect financial markets and the non-existence of taxes and bankruptcy costs and indicated that a firm’s capital structure is irrelevant to its value, hence denying the existence of an optimal capital structure. Later, Modigliani & Miller (1963) recognized that some assumptions of the initial “irrelevance theory” were unrealistic and introduced the importance of tax and leverage, creating the “trade-off theory,” later complemented by others, namely Stiglitz (1969), Jensen & Meckling (1976), Jensen (1986) and Stulz (1990).
The “trade-off theory” assumed that (i) there are tax benefits related to leverage, since interest paid is deductible for corporate tax purposes and therefore increases the firm’s value, referred to as tax shields, (ii) there are various bankruptcy costs related to leverage, therefore there is a limit for leverage and (iii) there are agency costs related to conflict between stakeholders. In summary, firms should find an equilibrium between tax shields and bankruptcy costs, but also take agency costs into consideration. Furthermore, Frank & Goyal (2008) clarify the difference between static and dynamic trade-off theories, suggesting that the first theory considers a single period and the latter a larger time frame
and that, with time, firms deviate from their original capital structure target, considering the influence of expectations and adjustment costs.
Finally, it is of particular interest for our study to note that “trade-off theory” defends that firms’ leverage increases with size, profitability and tangibility and that there is a positive correlation between a firm’s leverage and its industry median leverage. Firms with tangible assets are in a position to provide collateral for debts, so these firms can raise more debt. Larger and highly profitable firms are able to obtain high debt ratio as they are less likely to enter into bankruptcy.
Further research was conducted on the initial assumption that all stakeholders had access to the same information and, as a result, the “pecking order theory” first introduced by Donaldson (1961), and later popularized by Myers & Majluf (1984), was based on the key idea of asymmetric information. The understanding was now that owners and managers of the firms have access to more information about their firms’ risk and values than outside investors do, generating preference for internal (retained earnings) to external financing and debt to equity if external financing is required. In summary, debt to equity ratios only change with the need for external funds and not for the search for an optimal capital structure.
In more recent studies about determinants of the capital structure, Harris & Raviv (1991) consider that leverage increases with fixed assets, non-debt tax shields, firm size and investment opportunities and decreases with volatility, advertising expenses, probability of bankruptcy, profitability and uniqueness of the product offered, while according to Rajan & Zingales (1995), leverage is positively
correlated with tangibility of assets and size and negatively correlated with price-to-book ratio and profitability.
Most relevant to our specific study is the research already done about how capital structure is influenced by the industry, namely by Toy et al (1974), who studied industrial firms in four developed countries, Talberg et al (2008), who studied firms in multiple industries in the United States, and Frank & Goyal (2009), who also studied firms in multiple industries in the United States. The influence of regulation was also studied, namely in Bradley et al (1984), which indicated that firms in the regulated electric sector in the United States tend to have high leverage ratios. Dias & loannou (1995), Wooldridge et al (2001) and Bakatjan et al (2003) studied models of appropriate capital structures for privately financed infrastructure projects in United States and Turkey.
Moreover, Saeed (2007) studied listed firms in the energy sector in Pakistan from 2001 to 2005 and tested the data obtained with “trade-off,” “pecking order” and “agency costs” theories and found that “trade-off” and “pecking order” theories could partially explain financing decisions in the energy sector, with “pecking order theory” being most evident.
Later, Lino (2014) studied wind power projects in Portugal and found that these companies are usually funded through Project Finance by creating a new and independent company that owns the assets, which, together with the fact that they usually benefit from long-term feed-in tariffs, enable these projects to present high debt ratios of roughly 70% or more.
More recently, Ricciardi (2016) reached relatively similar conclusions by suggesting that capital structures of United States’ firms follow “pecking order theory” and that capital structures are very much dependent on long-term guarantees that firms are able to provide to lenders, including Power Purchase Agreement (PPA), feed-in tariff, collateral assets and government subsidies.
2.2 PPP and Risk Mitigation
The existing literature provides a wide range of definitions for the concept of Public- Private Partnership. One of the most consensual definitions is from the Organization for Economic Co-operation and Development (OECD; 2008), which defines PPP as an “…agreement between the government and one or more private partners (which may include the operators and the financers) according to which the private partners deliver the service in such a manner that the service delivery objectives of the government are aligned with the profit objectives of the private partners and where the effectiveness of the alignment depends on a sufficient transfer of risk to the private partners”. In the case of Cabo Verde, the concept of PPP is first introduced and defined by Decree-law 46/2005 of July 4 as “the contract or union of contracts in which private entities, referred to as private partners, undertake on a long-term basis and before a public partner, to ensure the development of an activity aimed to satisfy a collective necessity, where the funding and responsibility for investment and operation are attributed, all or in part, to the private partner”
Some authors have specifically studied PPP capital structures, namely (i) Moszoro & Gasiorowski (2008), who proposed the existence of an optimal capital
structure for PPPs and assumed that it might be optimal for the public partner to become a shareholder in the Special Purpose Vehicle (SPV) as well, since the optimal capital structure of a PPP lies within the borders defined by the lower interest rate spread influenced by the participation of public partners and the potential savings from private management, and (ii) Zhang (2005), who proposed a model to optimize the capital structure and evaluated the project’s financial viability when it is subject to construction risk, bankruptcy risk and other economic uncertainties. According to this author, an optimal capital structure is determined to safeguard the distinct interests of both equity holders and debt lenders.
It is, however, consensual that PPPs are usually funded through a project finance solution, creating an SPV with significant leverage and in which the primary guarantee for lenders is not the collateralized asset or a specific investor guarantee, but the capacity to ensure future operation cash flows of the SPV. The SPV is, therefore, an independent business, legally and financially created by sponsors using equity or mezzanine debt, used to isolate financial risk.
These specific characteristics of Project Finance are studied in detail by different authors, namely Gatti, S. (2008). In addition, previous literature, namely Grout (1997), Allan (1999), Valila (2005) and Robinson H. et all (2010) have also reached consensus regarding the following main characteristics of PPPs, with focus on risk sharing:
The risk sharing between the public and the private partners in order to achieve optimal risk allocation and with the rationale that risks should be allocated to the entity that is most able to manage them;
The long-term involvement of the private partner in providing public services or assets to meet public interest objectives;
The existence of different project phases, including essentially design, finance, construction and operation;
Private partner should contribute with experience, innovation and management skills and make use of project finance to fund all or a substantial part of the project.
Equally important and consensual are the following features of the PPP:
Can most commonly have the nature of Build-Own-Operate-Transfer (BOOT) or Build-Own-Operate (BOO). According to Grimsey & Lewis (2004), a BOOT is an arrangement whereby a facility is designed, financed, operated and maintained by a concession company and ownership rests with the concessionaire until the end of the concession period, at which point ownership and operating rights are transferred to the government (normally without charge), whereas in a BOO arrangement the developer is responsible for design, funding, construction, operation and maintenance of the facility during the concession period, with no provision for transfer of ownership to the government. Hence the difference lies on the ownership staying with the SPV company or being transferred to the public sector;
Work better with experienced and transparent partners and with clear and consistent legal and regulatory framework and
Should only be adopted if they are expected to deliver better Value For Money (VFM) when compared to traditional procurement methods. According to Devpryia (2006), assessing the VFM means comparing the cost of developing
the project under a PPP model with the risk-adjusted cost if developed traditionally by public sector.
It is also commonly accepted, namely by Van Herpen (2002), Grimsey & Lewis (2002) and Bertelli & Smith (2010), but also by PwC (2005), that the advantages of PPPs are essentially related to risk sharing, construction and operation costs efficiency, delivery time, innovation and management skills, as well as to the fact that its risks are associated with high transaction costs, deficient objective alignment and cooperation between the partners and increased cost of financing to the private sector.
The Capital Structure research scope has also evolved to include risk analysis in privately financed infrastructure projects. Previous literature has focused on identifying categories of risk involved, determining the partner best placed to manage these risks and suggesting adequate risk mitigation instruments.
Tinslay (2000) identifies 14 different categories of risk for infrastructure projects, namely supply/inputs risk, market risk, foreign exchange risk, operating risk with technical, cost and management components, environmental risk, infrastructure risk, force majeure risk, completion risk, engineering risk, political risk, participant risk, interest rate risk, syndication risk and legal risk. Later, Ng & Loosemore (2007) studied four categories of risk: political, legal, economic/financial and technical/project specific.
Perhaps more consensual is the study carried out by Grimsey & Lewis (2002) identifying nine main risks: technical risk related to engineering and design failure; construction risk associated to quality standards, budget overrun or delays; operational risk related to increased operation and maintenance costs; revenue risk related to a shortfall in terms of quantity or volatility of prices; financial risk related to inadequate hedging of revenue and financing cash flows; Force Majeure risk related essentially to natural catastrophes; regulatory/political risk related to legal and political uncertainty; environmental risk related to impacts and hazards; and project default risk related to failure from a combination of the afore-mentioned risks.
According to Li et al (2005), risk allocation refers to a primary measure of assignment between the public and the private partners, while according to Shen et al (2006) and Wang et al (2009), risk allocation is one of the most important advantages of PPPs, as it enables public and private partners to share risk and is a prerequisite for a successful PPP.
Although risk allocation strategies and risk mitigation instruments can differ significantly as a factor of the context of the specific country, sector and project, several investigations, including recent comprehensive studies by leading institutions, specifically focusing on (i) Sub-Saharan Africa and PPP, namely The Economist Intelligence Unit (2015) and (ii) Sub-Saharan Africa and Renewable Energy, including AfDB - African Development Bank (2015), World Bank (2016) and IRENA - International Renewable Energy Agency (2016), have proposed to identify the most common risks and recommend mitigation instruments to deal
with those risks that we understand to be most relevant to this study and which, therefore, we summarize in the following table:
Table I
Summary of Risks and Mitigation Instruments
Finally, regarding the role of multilateral development banks in risk mitigation, some authors, namely Hainz and Kleimeier (2006), Matsukawa and Habeck (2007) and World Bank (2016), have referred to the risk reduction role of these institutions through credit enhancement, experienced professional assistance and helping governments perform necessary reforms. Basílio (2011), meanwhile, has even studied, through an empirical approach, the specific relationship between the participation of these institutions and the legal and political risk in greenfield PPP projects.
Risk Category Mitigation Instrument
Design Risk Government to promote all preliminary studies necessary before procurement of private partners.
Technical and Construction Risk Turnkey EPC contact Operational Risk Long term Maintenance Agreement
Financial Risk (Liquidity and hedging) Interest rate swap, currency derivatives and liquidity facility Commercial/Collection Risk Sovereign guarantee specially in developing countries given usual poor
financial situation of public buyer
Legal and Regulatory Risk International Arbitration and Change Change in Law clauses Revenue Risk Long term Power Purchase Agreement and possible Take or pay
Political Risk Involvement of DFI and MDB and possible World Bank political risk guarantee
3. The case of the PPP experience in Cabo Verde
3.1 Electricity and Renewable Energy sector in Cabo Verde
Cabo Verde is an archipelago some 600 km off the west coast of Africa with ten islands, nine of which are inhabited, and is part of the Sub-Saharan Africa region where, according to the World Bank (2016), about 600 million people still lack access to electricity. Besides the struggles common to the region, like all small island developing states Cabo Verde faces specific geographic, economic and environmental challenges related essentially to its insularity (separate small grids and high transport costs, preventing an economy of scale) and the particular impact of climate change. Cabo Verde has no relevant natural resources and is dependent on the outside world for most things, including energy.
Despite these significant challenges and the relevant vulnerabilities that the electricity system still faces, related essentially to high electricity costs and technical and non-technical losses, the country has registered significant improvement in key electricity coverage indicators and is leading the way for other sub-Saharan countries and small island developing states with regards to energy independence and sustainability through a high penetration rate of renewable energy, predominantly wind. Indeed, according to a study done by the African Development Bank and published on the Energy Research & Social Science Journal, Mukasa et al (2015), seven of the eight completed wind energy projects in sub-Saharan Africa are pilot projects with the only project operating at a commercial scale being the Cabeólica wind farm in Cabo Verde.
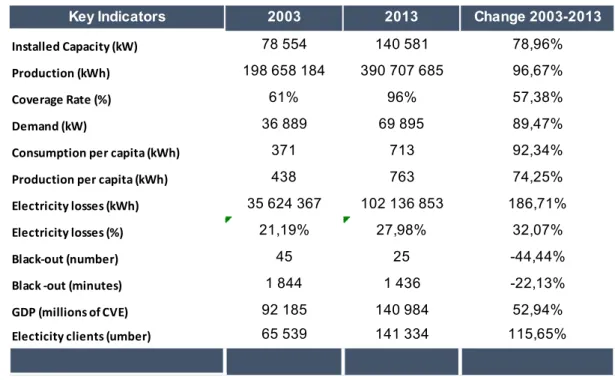
Table II
Key Indicators for Electricity Sector in Cabo Verde
Source: Directorate General of Energy of Cabo Verde, Statistics of the Electricity Sector, 2014 Graph 1
Source: Directorate General of Energy of Cabo Verde, Statistics of the Electricity Sector, 2014
Key Indicators 2003 2013 Change 2003-2013
Installed Capacity (kW) 78 554 140 581 78,96%
Production (kWh) 198 658 184 390 707 685 96,67%
Coverage Rate (%) 61% 96% 57,38%
Demand (kW) 36 889 69 895 89,47%
Consumption per capita (kWh) 371 713 92,34%
Production per capita (kWh) 438 763 74,25%
Electricity losses (kWh) 35 624 367 102 136 853 186,71%
Electricity losses (%) 21,19% 27,98% 32,07%
Black-out (number) 45 25 -44,44%
Black -out (minutes) 1 844 1 436 -22,13%
GDP (millions of CVE) 92 185 140 984 52,94%
Electicity clients (umber) 65 539 141 334 115,65%
78.55 79.21 73.89 85.34 104.29 140.98 2003 2005 2007 2009 2011 2013
Installed Capacity
Installed Capacity (kW)Cabo Verde has not yet implemented the unbundling of its electricity system, as the public utility company, Electra, SARL, remains responsible for most of the production but also holds the concession for transmission, distribution and commercialization. However, it has already accepted special cases of Independent Power Producers (IPP), including two IPP based on wind Energy: Cabeólica, with a 25.5 MW installed capacity, and Electric Wind, with a 0.5 MW installed capacity. The energy sector in Cabo Verde comprises fuel/diesel-based conventional generation, but also a proportion from renewables - wind and solar photovoltaic (PV), given its high solar potential and the fact that the country is in the path of the North-Easterly trade winds, with consistent wind speeds of about 9m/s, therefore resulting in considerable wind potential.
Graph 2
Source: Directorate General of Energy of Cabo Verde, Statistics of the Energy Sector, 2014
The government of Cabo Verde recognized the financial and environmental problems of diesel-based power generation and attempted for almost a decade to capitalize on the country’s wind energy potential. Later, in 2007, the
Government invited Cabeólica’s developer, InfraCo Africa Ltd., to conduct initial detailed studies that concluded that it was feasible to install wind capacity. Cabeólica was set up, supporting the ambitious government target of a 25% renewable energy penetration rate by 2012 and 50% by 2020.
In Cabo Verde the government body that promotes and supervises public-private partnerships is the Ministry of Finance through the Unit for Privatization and PPP. So far, Cabeólica remains the only energy PPP and the only relevant PPP currently operating in the country, hence the focus of our study on this grid-connected wind IPP.
3.2 Cabeólica Project
We selected Cabeólica, S.A. because of its leading role as the only operating commercial scale wind PPP in sub-Saharan Africa. The information included in this section is essentially based on available Annual Reports, but also news articles and personal interviews with the company’s CEO and CFO.
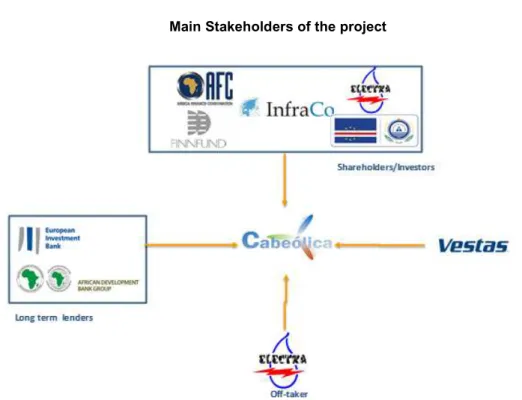
Cabeólica, SA (Cabeólica) is a wind IPP company established in Cabo Verde in 2009, resulting from a PPP between the government of Cabo Verde, Electra, SARL (the local public utility company) and private institutional partners, initially InfraCo Africa Ltd. (a donor-funded project development company that supports early-stage infrastructure projects in Africa) and later FINNFUND – Finnish Fund for Industrial Corporation (a Finnish development finance institution) and Africa Finance Corporation (a Pan-African development financing institution) as major investors.
Table III
Main Stakeholders of the project
Source: Based on Cabeólica’s Annual Reports
The implementation of the project was indeed challenging due to major technical difficulties during the development and construction phases, related essentially to different and isolated power grids and logistical problems related to limitations with ports, roads and locally available equipment. Financial challenges where also important due essentially to the small scale of the project and the difficult financial situation of the sole client and local utility company, Electra, SARL.
Despite the challenges, the construction phase began in December 2010, and since July 2012 the project has been fully operational and supplying clean energy to about 360,000 people, or 72% of the country’s population.
Cabeólica represents an investment of € 61 million, 30% Equity from the private investors and 70% Debt from lenders EIB-European Investment Bank (2/3) and
AfDB - African Development Bank (1/3), which enabled the construction of four wind farms with a total installed capacity of 25.5 MW through 30 V52 Vestas wind turbines, being 11 wind turbines in the island of Santiago, 9 in Sal, 7 in São Vicente and 3 in Boa Vista.
The debt obtained from the lenders, EIB and AfDB, represented a total of € 42 million with a tenor of 14 years and a fixed interest rate, including as collateral the mortgage of the wind farms, a pledge of the shares and a debt service reserve account. The Equity was funded through normal shares, share equivalent loans (an equity instrument) and subordinated investor loans, considered as equity for financing purposes.
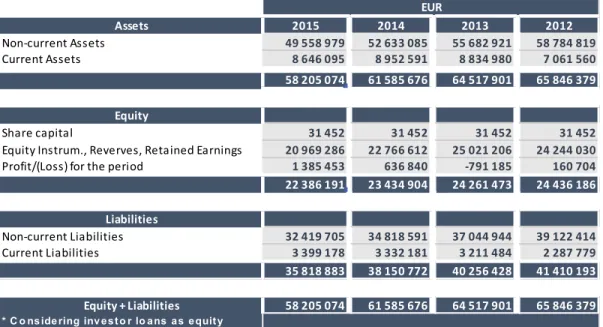
Table IV
Cabeólica’s Balance Sheet 2012-2015
Source: Cabeólica’s Annual Reports 2013-2015
Assets 2015 2014 2013 2012 Non-current Assets 49 558 979 52 633 085 55 682 921 58 784 819 Current Assets 8 646 095 8 952 591 8 834 980 7 061 560 58 205 074 61 585 676 64 517 901 65 846 379 Equity Share capital 31 452 31 452 31 452 31 452
Equity Instrum., Reverves, Retained Earnings 20 969 286 22 766 612 25 021 206 24 244 030 Profit/(Loss) for the period 1 385 453 636 840 -791 185 160 704 22 386 191 23 434 904 24 261 473 24 436 186 Liabilities Non-current Liabilities 32 419 705 34 818 591 37 044 944 39 122 414 Current Liabilities 3 399 178 3 332 181 3 211 484 2 287 779 35 818 883 38 150 772 40 256 428 41 410 193 Equity + Liabilities 58 205 074 61 585 676 64 517 901 65 846 379
* C o ns ide ring inv est o r lo ans as equit y
Table V
Cabeólica’s Income Statement 2012-2015
Source: Cabeólica’s Annual Reports 2013-2015
Cabeólica is financially self-sustainable with no public financial support. The energy produced is sold to its sole client, the local public utility company named Electra, SARL, based on a 20 offtake agreement which establishes a minimum take or pay amount to be purchased and a price incentive scheme based on amount purchased resulting in a base price and discounted tier 1 and tier 2 prices. This guaranteed long-term income stream generated by the offtake agreement is a key factor for its financial success.
Income 2015 2014 2013 2012 Sales 10 516 731 10 474 073 9 983 059 8 454 641 Other Revenues 550 172 12 853 13 404 85 712 Financial Income 60 837 69 064 70 276 62 377 11 127 740 10 555 989 10 066 739 8 602 730 Expenses
Operation, Maintenance and other expenses -2 011 092 -1 873 342 -2 345 767 -1 696 567
Depreciation -3 085 539 -3 083 854 -3 083 209 -2 763 878 Financial Expenses -4 645 656 -4 961 953 -5 428 948 -3 981 581 -9 742 287 -9 919 149 -10 857 924 -8 442 026 Results EBITDA 9 055 811 8 613 583 7 650 696 6 843 785 EBIT 5 970 273 5 529 729 4 567 487 4 079 907 Profit 1 385 453 636 840 -791 185 160 704 EUR
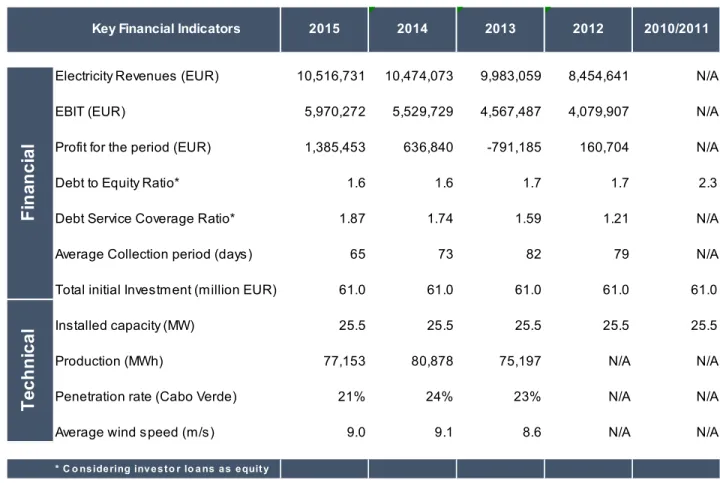
Table VI
Cabeólica’s Key Financial and Technical Indicators
Source: Cabeólica’s Annual Reports 2013-2015
Regarding risk mitigation and in accordance with best practices, the company has a list of important contractual instruments in place, including:
Long term PPA with take or pay clauses, ensuring long term revenue stream with fixed price and a minimum quantity to be invoiced to the off-taker - Electra, SARL;
EPC – turnkey construction and installation agreement and long term SAA – maintenance agreement with the world leading manufacturer - Vestas, ensuring quality and timely construction process and continuous availability of the wind turbines for production;
Key Financial Indicators 2015 2014 2013 2012 2010/2011
Electricity Revenues (EUR) 10,516,731 10,474,073 9,983,059 8,454,641 N/A
EBIT (EUR) 5,970,272 5,529,729 4,567,487 4,079,907 N/A
Profit for the period (EUR) 1,385,453 636,840 -791,185 160,704 N/A
Debt to Equity Ratio* 1.6 1.6 1.7 1.7 2.3
Debt Service Coverage Ratio* 1.87 1.74 1.59 1.21 N/A
Average Collection period (days) 65 73 82 79 N/A
Total initial Investment (million EUR) 61.0 61.0 61.0 61.0 61.0
Installed capacity (MW) 25.5 25.5 25.5 25.5 25.5
Production (MWh) 77,153 80,878 75,197 N/A N/A
Penetration rate (Cabo Verde) 21% 24% 23% N/A N/A
Average wind speed (m/s) 9.0 9.1 8.6 N/A N/A
* C o nsidering inv es to r lo a ns as equit y
T ec h n ic a l F in an c ia l
Development and Investment Agreement between Investors, ensuring that all rights and obligations of both private and public partners are clear and that corporate governance is in line with global best practices, issues particularly important in a PPP;
Finance and Common Terms Agreement with Lenders, ensuring an adequate information reporting process and strict authorizations needed;
Escrow and Account Bank Agreement with banks, ensuring an immediate cash cushion in case of commercial default by the client, but also that all funds are held properly and in institutions with an adequate credit rating.
Besides the contractual instruments, other factors also play an important risk mitigation role for Cabeólica, including:
The maturity of the technology used, as wind technology itself is one of the most mature renewable energy technologies available, while the V52 wind turbines used are one of the most mature and robust manufactured by Vestas; Institutional and transparent public and private partners, as private partners
are international DFIs and the public partner had clear political will for renewables and is seen as an example of transparency in the region, ranked 40 out of a total 170 countries according to Transparency International; Experienced advisers, as Cabeólica’s private investors have extensive
international experience in relatively similar business structures and the external consultants used were top level, almost all of them based in London; Comprehensive insurance policies, including property damage, business
4. Methodology
The methodology used is a case study of a single and unique case, in which we analyzed the capital structure and risk mitigation instruments, especially trying to understand the behavior of the capital structure, as well as the possible relation to risk mitigation.
To carry out our study, after defining the research questions, we researched capital structure theories with a focus on the classical “trade-off” and “pecking order” theories and obtained previous industry analysis in order to seek patterns regarding leverage and participation of private investors. Meanwhile, we also analyzed previous studies performed on risk sharing and mitigation on similar industry and business structures and tried to find risk mitigation instruments in place and possible relationships with capital structure.
The following step was to obtain quantitative and qualitative data from the selected company – Cabeólica - through annual reports from years 2013 to 2015, news articles and interviews with key personnel, forming the basis for our analysis. Quantitative data relates to all measurable data, whereas qualitative data is defined by Denzin & Lincoln (2000) as text and narratives.
The last step was to analyze all the data collected from the case study, compare it with the literature review and identify similar patterns. This process was
consistent with the three-phase process proposed by Dube & Pare (2003), specifically Research design, Data collection and Data Analysis.
Concerns still persist about the choice for a case study approach, related to the lack of rigor in research and the fact that they might provide little basis for scientific generalization. However, according to Yin (1994), case studies, like experiments, are generalizable to theoretical propositions and not to populations or universes. In this sense, the case study, like the experiment, does not represent a ”sample” and the investigator’s goal is to expand and generalize theories (analytic generalization) and not to enumerate frequencies (statistical generalization). According to the concepts introduced by the same author, we can consider that the approach used in our study should be considered a qualitative approach with descriptive and holistic characteristics.
Different strategies and guidelines have been proposed to evaluate the rigor of qualitative data. However, perhaps the most consensual is from Yin (1994) that proposes 4 different tests. Applying these tests to our case study, it is fair to confirm that the construct validity is ensured by the use of multiple data sources and confirmation of data with key personnel. Internal validity is ensured essentially by the pattern matching approach used, external validity is ensured because although a single case is used, the same patterns have been tested in the industry in developing and larger countries, while reliability is ensured by appropriately documenting the research procedures.
5. Results
Despite the limitations liable to arise from an analysis of a single case study, we did find for this specific case, patterns already described in previous literature. We focused on two classical theories – the “trade-off” and “pecking order” theories - and tried to confirm if they explain the capital structure behavior characteristics of our case study.
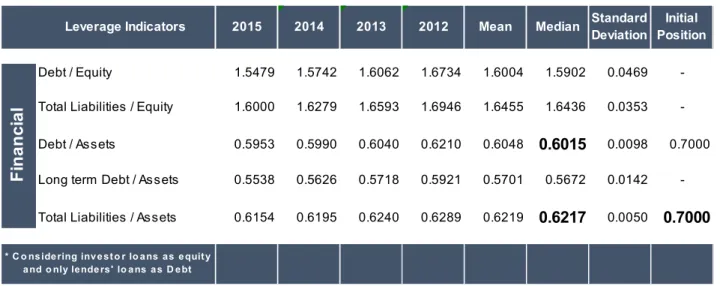
In analyzing Cabeólica’s financial data, with a particular focus on leverage, the most important highlight is the fact that this SPV is highly leveraged, initially using the maximum proportion of debt usually accepted by the Lenders (70%). This means a positive correlation between Cabeólica’s initial leverage (Debt to Equity 70%/30%) and the initial leverage of the industry as proposed by the “trade-off theory” and described by previous studies, namely Lino (2014). In another perspective, it is worth noting that Cabeólica demonstrates that it is possible to obtain a similar leverage proportion from high profile lenders to that of renewable energy companies located in developed or larger countries, studied by multiple authors and described in the literature review.
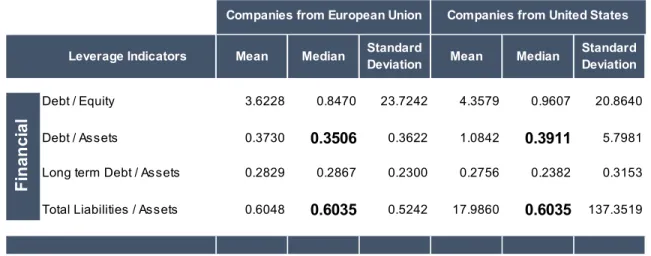
Tables VII and VIII illustrate the similarity between Cabeólica’s leverage and the leverage of renewable energy companies from the European Union (EU) and the United States (US). Since the means for the EU and US companies are affected by outliers and by volatility evidenced through significant standard deviation, it is more appropriate to use median for comparison purposes.
In a broader sense, leverage should be measured as total liabilities to assets, as it includes all different categories of assets and liabilities. Although total liabilities might include items which are not precisely debt in the narrow sense and total assets might include items other than tangible assets, given different tax and accounting realities, complex financial instruments used and the fact that lenders will analyze the full financial position of the company and not only debt and tangible assets, we understand that total liabilities to assets is an important indicator. However, debt to equity and debt to assets is also often considered in previous literature as they focus on the most important items for financing purposes.
Table VII
Cabeólica’s Leverage Indicators
Source: Cabeólica’s Annual Reports 2013-2015
Leverage Indicators 2015 2014 2013 2012 Mean Median Standard Deviation
Initial Position
Debt / Equity 1.5479 1.5742 1.6062 1.6734 1.6004 1.5902 0.0469
-Total Liabilities / Equity 1.6000 1.6279 1.6593 1.6946 1.6455 1.6436 0.0353
-Debt / Assets 0.5953 0.5990 0.6040 0.6210 0.6048 0.6015 0.0098 0.7000
Long term Debt / Assets 0.5538 0.5626 0.5718 0.5921 0.5701 0.5672 0.0142 -Total Liabilities / Assets 0.6154 0.6195 0.6240 0.6289 0.6219 0.6217 0.0050 0.7000
F in a n c ia l
* C o ns ide ring inv e st o r lo a ns as e quity a nd o nly lende rs' lo a ns a s D e bt
Table VIII
Leverage Indicators from EU and US Companies
Source: Ricciardi (2016), Sample of renewable energy companies obtained from Thomson Reuters database, being 33 from the EU and 17 from the US
Cabeólica presents a very similar total liabilities to assets ratio and a relatively higher debt to assets ratio. Debt to assets ratio and, especially, debt to equity ratio might be affected by the fact that the data from Cabeólica corresponds to the very early stage of operations – the first four years – while the data from EU and US uses a wider period and a more mature phase of a group of companies that includes those starting with newly-built plants as well as companies that buy businesses already in operation.
It is also possible to observe that in the initial phase when there was a need for external funds and the company had little or no internal funds, the investors chose debt over equity, maximizing the debt leverage up to the limit allowed by the lenders. This is consistent with the “pecking order theory,” which states that firms prefer internal financing to external financing and debt to more equity due to information asymmetries between insiders and outsiders to the firm.
Leverage Indicators Mean Median Standard
Deviation Mean Median
Standard Deviation
Debt / Equity 3.6228 0.8470 23.7242 4.3579 0.9607 20.8640
Debt / Assets 0.3730 0.3506 0.3622 1.0842 0.3911 5.7981
Long term Debt / Assets 0.2829 0.2867 0.2300 0.2756 0.2382 0.3153 Total Liabilities / Assets 0.6048 0.6035 0.5242 17.9860 0.6035 137.3519
F in a n c ia l
The “trade-off theory” states that possible explanations for high leverage could be the size and the fact that this type of company has tangible and highly collateralized assets. However, when considering the specificity of this project, especially the fact that it is only 30 turbines of 850 KW each installed in 4 different islands in a small island developing state in West Africa, it is possible to conclude that it is a very small SPV and its assets, albeit tangibles, are not as collateralized as comparable assets in developing or larger countries where there is an active market, and that, therefore these aspects cannot explain the leverage. These results are, however, consistent with the extended form of “pecking order theory”.
In the particular case of Cabeólica, it is fair to recognize that the high leverage (70%) and the high proportion of private partners in Cabeólica’s equity (roughly 90%) is also strongly related to predictability of cash flow, because of a long-term PPA, the legal and regulatory stability of the country, contractual guarantees and other risk mitigation instruments in place. This is comparable to results from different studies referred to in our literature review, including recent specific studies about capital structure in the renewable energy sector carried out by Lino (2014) and Ricciardi (2016), and on risk allocation and mitigation in renewable energy sector in Sub-Saharan Africa carried out by AfDB (2015), World Bank (2016) and IRENA (2016).
Nevertheless, the option to have significant participation of private investors in Cabeólica can also be partially related to limited public funds to invest in the energy sector together with high level of public debt. High public debt is unfortunately a usual characteristic of developing countries in sub-Saharan
Africa, and in the case of Cabo Verde, although mostly concessional, the public debt has been increasing since the global economic and financial crisis of 2007-2008 and is definitely a concern given the following levels:
Graph 3
Source: BCV – Central Bank of Cabo Verde
With regards to risk sharing and risk mitigation, it is possible to highlight that Cabeólica did share risks between private and public partners using its PPP capital structure and did indeed implement instruments to mitigate all relevant risks commonly described in previous literature, including technical, construction, operational, financial, environmental & social, commercial, legal & regulatory, revenue, political, project default and force majeure.
The following table analyses the most relevant risks faced by Cabeólica, the risk allocation strategy, as well as the risk mitigation instruments in place, and is consistent with best practices described in recent studies and referred to in our literature review, including Basílio (2011), The Economist / Intelligence Unit (2015) AfDB (2015), World Bank (2016) and IRENA - International Renewable Energy Agency (2016). 0 20 40 60 80 100 120 140 2006 2007 2008 2009 2010 2011 2012 2013 2014 2015
Table IX
Cabeólica’s Risks and Mitigation Instruments
Besides the importance that the risk sharing and implementation of all relevant mitigation instruments must have had in the success of the project and in defining its capital structure, another important factor often neglected in previous literature because it is applicable essentially in developing states, is the fact that the participation of multilateral development banks, in this case EIB and AfDB, acts as an effective mitigation instrument for legal and political risk. In fact, as these
Allocation Risk Category Mitigation Instrument
Technical Risk Mature technology and experienced consultants Construction Risk Turnkey EPC contact with experienced manufacturer
Operational Risk Long term Maintenance Agreement
Financial Risk (Liquidity and hedging) Interest rate swap included in Financing contracts, local currency pegged with currency used for Financing and liquidity facility available. Environmental & Social Risk Experienced Consultants and all necessary studies performed in
advance
Commercial/Collection Risk Escrow Account, the fact that the lenders are MDB and partial guarantee given poor financial status of public buyer Legal and Regulatory Risk International Arbitration and Change in Law clauses in the contracts
Revenue Risk Long term Power Purchase Agreement with Take or pay clause. An alternative would be feed-in tarifs.
Political Risk Involvement of EIB and AfDB as Lenders and possible World Bank political risk guarantee
Project Default
Political will from public partner, Involvement of high profile and experienced institutional Private partners (DFI), Parasocial Agrement between Investors and Common Terms Agreement with Lenders, both
with strict corporate governance and reporting standards Force Majeure Risk Comprehensive Insurance Policies and considering Force Majeure
clause in the contracts
P rv a te P a rt n e r P u b lic P a rt n e r S h a re d
entities are usually privileged financial and policy partners for most developing states, their influence for compliance of public entities towards contractual and legal framework is of utmost importance. It is important to note, however, that this aspect is consistent with the study performed by Basílio (2011).
Finally, it is worth highlighting the fact that the project is a successful and pioneering project in sub-Saharan Africa most probably because of the following conditions that set the project apart from similar projects in the region:
Risk allocation and risk mitigation instruments in place in accordance with the most consensual theories (see table IX)
Stable and transparent political, social, legal and regulatory framework Predictability of Cash Flow with long-term PPA
Participation of Multilateral Development Banks (MDB) as Lenders as a key instrument to mitigate political risk
High profile experienced and transparent private partners, in particular Development Financial Institutions (DFI), increase transparency and alignment of goals between public and private
Experienced advisers (legal, financial, technical)
Mature technology and experienced technology partner (EPC&SAA)
This successful set of conditions is consistent with previous studies indicated in the literature review related to the benefits and risks of PPPs carried out by Grimsey & Lewis (2002), Bertelli & Smith (2010), PwC (2005), Shen et al (2006) and Wang et al (2009) and more recent studies on risk mitigation and allocation in renewable energy sector in Sub-Saharan referred to previously in this chapter.
6. Conclusions
6.1 Main Conclusions
With the objective of understanding capital structure and risk mitigation on renewable energy PPPs, in particular to find whether a specific case study follows any of the two classical capital structure theories and whether there is a relationship between its capital structure and risk mitigation, we studied the case of a PPP wind power company funded through project finance and located in Cabo Verde, a small island developing state located in sub-Saharan Africa.
Applying the investigation made in this field to this particular case study, they potentially suggest that “pecking order” and “trade-off” theories can partially explain the leverage decision and that risk mitigation instruments in place can also partially explain the high leverage and significant share of participation of private investors.
It is considered that the results suggest an alignment with the “pecking order theory” assuming asymmetric information since in the initial phase when there was a need for external funds and the company had no internal funds, the investors chose debt over equity, maximizing debt leverage. In addition, although there has been no significant investment since the initial phase, there is a continuous slight decrease of the initial debt and all small investments and shy growth are being achieved using internal funds, showing that, when available,
there is a preference for internal funds over debt. In addition, the fact that the high leverage is obtained despite small size and tangible but not highly collateral assets, also reinforces the fact that the capital structure behavior is comparable to “pecking order theory”.
The initial leverage of 70% also suggests the “trade-off theory,” as this theory defends taking advantage of debt for tax purposes up to a limit where bankruptcy costs start to become more relevant, and indicates that there is a positive correlation between a firm’s leverage and its industry median leverage. In fact, various studies done in the renewable energy sector in developed countries have come to the same conclusion, but this study is important as it shows the same leverage applicable in a similar sector in a small developing country.
When comparing the capital structure of this PPP with the risk mitigation instruments in place, the results suggest that capital structure, in particular the high leverage and the significant share of participation of private investors, can be influenced by the risk mitigation instruments in place, including the existing legal and contractual guarantees, regulatory framework and equity and financing partners chosen.
We understand that, by focusing on a specific case in sub-Saharan Africa, previous studies carried out on the subjects of capital structure and risk mitigation on the renewable energy sector located in larger or more developed countries, the present study leaves relevant suggestions and insights for this specific reality.
6.2 Limitations and Further Research
We understand that a relevant limitation might be the fact that our conclusions were based on the analysis of a single case, as Cabo Verde has only one PPP project and the project analyzed is also the first and only commercial-scale wind power PPP operating in the entirety of sub-Saharan Africa. It is therefore clear that the conclusions obtained are only directly related to one specific reality and arguable that multiple case studies of similar situations or an empirical study based on a significant sample would probably lead to stronger results and conclusions.
We also recommend future research to analyze the specific effect of institutional ownership, particularly DFI, on Capital Structure decision in PPPs in the renewable energy sector.
References
Allan, J. (1999). “Public-Private Partnerships: A review of the Literature and Practice”. Public Policy Paper 4. Saskatchewan Institute of Public Policy, University of Regina
Bakatjan, S., Arikan, M. & Tiong, R. (2003). “Optimal Capital Structure Model for BOT Power Projects in Turkey”. Journal of Construction Management and Engineering, ASCE, 129, 89-97
Basílio M. (2011), “Infrastructure Public-Private Partnerships Risk factors and Agents’ Participation”. Universidade Técnica de Lisboa
Bertelli, A. M. & Smith C. (2010). “Relational Contracting and Network Management. Journal of Public Administration Research and Theory, 20, 21–40 Bradley, M., Jarrell, G & Kim, E. (1984). “On the Existence of an Optimal Capital Structure: Theory and Evidence”. The Journal of Finance, 39, 857-878
Denzin N. & Lincoln Y. (2000). “Handbook of Qualitative Research”. Sage Publications
Devapriya, K. (2006). “Governance Issues in Financing of Public-Private Partnerships Organizations in Network Infrastructure Industries”. International Journal of Project Management, 24, 557-565
Dias A. & Ioannou P. (1995). “Debt Capacity and optimal Capital Structure for privately financed infrastructure projects”. Journal of Construction Engineering and Management
Directorate General of Energy, Ministry of Economy and Employment of Cabo Verde (2014). “Statistics of the Energy Sector”
Donaldson, G. (1961). “Corporate Debt Capacity: A Study of Corporate Debt Policy and the Determination of Corporate Debt Capacity”- Harvard Business School, Harvard university
Dube L. & Pare G. (2003). “Rigor in Information Systems Positivist Case Research: Current Practices, Trends and Recommendations” MIS Quarterly, 27 Frank, M. & Goyal, V. (2008). Trade-off and Pecking Order Theories of Debt. Handbook of Empirical Corporate Finance, Amsterdam: Elsevier Science, 135-202
Frank, M. & Goyal, V. (2009). Capital Structure Decisions: Which Factors Are Reliably Important?. Financial Management, 38(1), 1-37
Gatti, S. (2008). “Project Finance in Theory and Practice: Designing, Structuring and Financing Private and Public Projects”. Elsevier
Grimsey, D. & Lewis, M.K. (2002). “Evaluating Risks of Public-Private Partnerships for Infrastructure Projects. International Journal of Project Management. 20, 107-117
Grimsey, D. & Lewis, M.K. (2004). “PPP – The Worldwide Revolution in Infrastructure Provision and Project Finance”. Edward Elgar Publishing
Grout, P. (1997). “The Economics of the Private Finance Initiative”. Oxford Review of Economic Policy 13 (4), 53–66
Harris, M. & Raviv, A. (1991). “The Theory of Capital Structure”. Journal of Finance, 46, 297-354.
IRENA (2016). “Unlocking Renewable Energy Investment: The role of Risk Mitigation and Structured Finance”. Available on
http://www.irena.org/DocumentDownloads/Publications/IRENA_Risk_Mitigation _and_Structured_Finance_2016.pdf
Jensen, M. & W. Meckling (1976). “Theory of the firm: Managerial Behavior, Agency Costs and Ownership Structure”. Journal of Financial Economics, 3, 305-360
Jensen, M. (1986). “Agency Costs of Free Cash Flow, Corporate Finance and Takeovers”. American Economic Review, 76, 323-329
Li, B., Akintoye, A., Edwards, P. & Hardcastle C. (2005), “The Allocation of Risk in PPP/PFI Construction Projects in the UK”. International Journal of Project Management 23, 25-35
Lino, L. (2014). “VaR em Parques Eólicos – Modelização de Risco de Vento, Risco de Taxa de Juro e Risco Soberano”. Universidade Católica Portuguesa Ministry of Finance (2005). Decree Law nº 46/2005, July 4, 2016. Boletim Oficial Modigliani, F. & Miller, M.H. (1958). “The Cost of Capital, Corporation Finance and the Theory of Investment”. American Economic Review, 48, 261–297 Modigliani, F. & Miller, M.H. (1963). “Corporate Income Taxes and the Cost of Capital: A Correction”. The American Economic Review, 53, 433-443
Moszoro, M. & Gasiorowski, P. (2008). “Optimal Capital Structure of Public Private Partnerships”. IMF Working paper, International Monetary Fund, 1-13 Mukasa, A., Mutambatsere, E. Arvanitis, Y & Triki, T. (2015).“Wind Energy in Sub-Saharan Africa: Financial and Political Causes for the Sector’s
Under-Development”. African Development Bank – AfDB. Journal of Energy Research and Social Science
Myers, S. & Majluf, N. (1984). Corporate Financing and Investment Decisions when firms have information that investors do not have. Journal of Financial Economics, 13(2), 187-221
Ng, A. & Loosemore, M. (2007), “Risk Allocation in the Private Provision of Public Infrastructure”. International Journal of Project Management, 25, 66-76
OECD (2008). “Public-Private Partnership: In Pursuit of Risk Sharing and Value
for Money” OECD Publishing. Available on:
http://dx.doi.org/10.1787/9789264046733-en
PricewaterhouseCoopers (2005). “Delivering the PPP Promise, A Review of PPP Issues and Activity”
Rajan, R.G. & Zingales, L. (1995). “What do we know about capital structure? Some Evidence from International Data”. Journal of Finance, 50, 1421-1460. Ricciardi, L. (2016). “Understanding Capital Structures for Companies in the Renewable Energy Market”. Universidade Católica Portuguesa
Robinson, H., Carrillo, P., Anumba, C. & Patel, M. (2010). “Governance & Knowledge Management for Public-Private Partnerships”. Wiley-Blackwell Saeed, A. (2007). “The Determinants of Capital Structure in Energy Sector”, School of Management, Blekinge Institute of Technology.
Shen, L., Platten, A. & Dang, X. (2006), "Role of Public-Private Partnership to Manage Risk in Public Sector Project in Hong Kong". International Journal of Project Management. 24, 587-594
Stiglitz, J. E. (1969). “A Re-Examination of the Modigliani-Miller Theorem”. The American Economic Review, 59, 784-793
Stulz, R. (1990). Managerial Discretion and Optimal Financing Policies. Journal of Financial Economics, 26, 3-27
Talberg, M., Winge, C., Frydenberg, S. & Westgaard, S., (2008). “Capital Structure Across Industries”, International Journal of the Economics of Business, 15, 181-200
The Economist & Intelligence Unit (2015). “Evaluating the Environment for Public-Private Partnerships in Africa”
Tinsley, R. (2000). Advanced Project Financing - Structuring Risk. Euromoney Books
Toy, N., Stonehill, A., Remmers, L., Wright, R. & Beekhuisen, T. (1974). “A Comparative International Study of Growth, Profitability and Risk as Determinants of Corporate Debt Ratios in the Manufacturing Sector”, Journal of Financial and Quantitative Analysis, 9, 875-886
Valila, T. (2005). “How Expensive are Cost Savings? On the Economics of PPPs”. The European Investment Bank Papers 10 (1), 94–119
Van Herpen (2002). Public-Private Partnerships, The Advantages and Disadvantages Examined. Association for European Transport
Wang, W. & Dai, D. (2009), "Risk Allocation Mechanism for Public-Private Partnership (PPP) Projects", IEEE
Wooldridge, S., Garvin, M. & Miller, J. (2001). “Effects of accounting and budgeting on capital allocation for infrastructure projects”. Journal of Management Engineering, 17, 86–94
World Bank (2016). “Independent Power Projects in Sub-Saharan Africa, Lessons from Five Key Countries”. Available on
https://openknowledge.worldbank.org/handle/10986/23970
Yin R. (1994). “Case Study Research. Design and Methods”. Sage Publications Zhang, X., (2005). “Financial viability analysis and capital structure optimization in private public infrastructure projects”. Journal of Construction Engineering and Management, 131, 656–668