A simple ESR identification methodology for Electrolytic Capacitors conditon monitoring
10
0
0
Texto
(2) COMADEM 2007. most expensive components in power electronic circuits and, according to MIL-HDBK 217F standard (1995 cited Lahyani et al. 1998, Venet et al. 2002 and Imam et al. 2005), they have the highest probability of failure at ambient temperature of 25ºC and under rated conditions, and are also responsible for more than half of the breakdowns. Unfortunately, the expected life of electrolytic capacitors is limited and determined by their internal temperature. In fact, among several factors that can cause electrolytic capacitors to fail, the most influential factor on their operational life is heat and the life of electrolytic capacitors is strongly dependent on the operating temperature as described in the technical note (Evox Rifa, a). Failure mechanisms of non-solid electrolytic capacitors have been described in the literature by researchers: Harada et al. (1993), Gasperi (1996), Stevens et al. (2002), Imam et al. (2005) and Parler (a). The internal failure mechanisms are multiple and complex in their interactions and must be considered as a complete system (Stevens et al., 2002), but in simple terms the life of electrolytic capacitors depends on the operating temperature and is determined by ratio of the electrolyte solution evaporation used in their fabrication. The deterioration caused by this evaporation is reflected in electrical parameters such as capacitance, leakage current and the equivalent series resistance (ESR). Actually, as the volume of the electrolyte decreases, ESR increases and capacitance decreases. Additionally, the increase in ESR has a cumulative effect since the increase in ESR leads to temperature increased and this in turn leads to further evaporation of the electrolyte (Sankaran et al., 1997). Thus, the rise of temperature depends on the ESR value and rms current of the capacitor apart from other factors. Hence, the current through the capacitor causes power loss due mainly to the ESR and the temperature inside the capacitor rises linearly with this power loss which is given by (Irms)2×ESR. Therefore, among others parameters, ESR is of paramount importance as far as the end of life of electrolytic capacitors is concerned. Although an old-rule-of-thumb referred in a technical paper by Lauber (1985 cited Gasperi, 1996), has described that the end of life is when the capacitor has lost about 40% of its electrolyte, the rise of the ESR value is usually used to define the end of life of an electrolytic capacitor. For instance, Evox Rifa (a) defines end of life of their electrolytic capacitors when ESR becomes higher than two times the initial value. According to (Parler, b), Cornell Dubilier uses EIA standard IS-749 which specifies capacitor lifetime as that time at which 10% of the capacitors have failed due to parametric failure and no more than 10% due to open or short circuit which means, as far as the parametric failure is concerned, that the life time of the capacitor is over, when the ESR is above 200% its initial value (Cornell Dubilier). Furthermore, life is generally defined in (Parler a) as the time to which a certain level of parametric degradation occurs and, as a practical matter, this is usually the time required for the ESR to reach double or triple its initial value or limit. Typical values of ESR range from 10 mΩ to 1 Ω, and ESR is inversely proportional to capacitance for a given rated voltage. Furthermore, not only ESR increases (and capacitance decreases) as the capacitor ages, but also it varies with frequency. ESR frequency and temperature variation is described in (Parler, a) and also shown in (Evox Rifa, b) and (Aeloíza et al., 2005). At frequencies above few kHz, ESR is the predominant factor in the capacitor’s impedance according to (Evox Rifa, b), (Venet et al., 2002) and (Aeloíza et al., 2005). Due to all it was said so far, special attention has been paid to fault diagnosis and conditioning monitoring of this critical component being the works achieved by Aeloíza et al. (2005), Imam et al. (2005), Maddula and Balda (2005), Amaral and Cardoso (2004b), Ondel et al. (2004) and Venet et al. (2002) just some recent examples. The electrolytic capacitor conditioning has been investigated by several methods. Most of them are based on the ESR evaluation (Harada et al., 1993), (Gasperi, 1996), (Gasperi, 1997), (Sankaran et al., 1997), (Lahyani et al., 1998), (Venet et al., 2002), (Amaral and Cardoso, 2004a) and (Aeloíza et al., 2005) among others. Venet et al. (2002) realized a circuit to signal the worn-out state of electrolytic capacitors online, based on ESR evaluation and in (Aeloíza et al., 2005) a real time diagnostic method is presented to estimate their deterioration condition. A method based on an adaptive filter modelling using the LMS algorithm is described in (Imam et al., 2005). This paper presents a simple ESR identification methodology for electrolytic capacitors condition monitoring in view of preventive maintenance to signal the need of maintenance and or replacement. The identification methodology is based on a continuous-time model and some recursive prediction error methods, namely, Kalman filter, gradient and recursive least squares algorithms.. 76.
(3) Faro, Portugal, June 13 – 15, 2007. THE IDENTIFICATION METHODOLOGY The Model The model used for the ESR estimation of electrolytic capacitors is very simple and is derived directly from the simplified equivalent circuit of an electrolytic capacitor shown in figure 1.. vc ic. ESR. C. Figure 1: Simplified equivalent circuit of an electrolytic capacitor. An equation for this equivalent circuit can be written as follows:. vc (t ) = ESR × ic (t ) +. 1 ic (t )dt C∫. (1). The above equation can also be written as: dvc (t ) ic (t ) di (t ) − = ESR × c dt C dt. (2). y (t ) = ϕ (t ) T θ. (3). or, in a general form:. where: y (t ) =. dv c (t ) ic (t ) di (t ) − , ϕ (t ) = c and θ = ESR . dt C dt. The model given by (3) is called linear regression and would be a very simple single-input single-output model if the input and output could be measured. In fact this virtual input and virtual output can not be measured directly because they depend on the first derivatives of the voltage and current of the capacitor. Nevertheless, even though they can not be measured they can be computed as described below and this fact is used to develop a new identification methodology for ESR estimation. In the continuous-time model described by (2) the first derivatives of the capacitor voltage and current are. computed by using a recursive filter which can be obtained from the following formula (Harrison and Stoten, 1995): dx 1 n −1 = ∑ C i x(t k − iTs ) (4) dt t =tk Ts i =0. A particular filter is derived from (4) when a set of weighing coefficients, Ci, is chosen. These weights can be found in (Harrison and Stoten, 1995) which are determined after Taylor’s series expansion of (4) to m+1 terms with m = {1, 2, L , n}, with m being the order of the filter and n the number of points used in the computation. Harrison and Stoten (1995) also present the minimum error and optimum {n,m} for a range of fs/fp and X/δx. fs and fp are the sampling frequency and signal frequency whereas X is the signal magnitude and δx denotes the size of the quantum to which x is subject. In the tests carried out in this work the coefficients [11 − 18 9 − 2] / 6 were used successfully with very good results. Thus, considering these coefficients, the output and linear regression of (3) are given as follows: y (k ) =. i (k ) 1 (11vc (k ) − 18vc (k − 1) + 9vc (k − 2) − 2vc (k − 3) ) − c 6Ts C. (5). 77.
(4) COMADEM 2007. ϕ (k ) =. 1 (11ic (k ) − 18ic (k − 1) + 9ic (k − 2) − 2ic (k − 3) ) 6Ts. (6). The Algorithms. A recursive prediction error method, which is well described, for instance, in (Ljung, 1999) was used and can be summarized as follows: ) 1. ψ (k + 1) = ∂y (k , θ ) / ∂θ θ =θ) ( k ) (7a). P(k )ψ (k + 1) ψ (k + 1) P(k )ψ (k + 1) + Rm ) ) ) 3. θ (k + 1) = θ (k ) + L(k + 1)( y (k + 1) − y (k + 1) ). 2. L(k + 1) =. (7b). T. (7c). 4. P(k + 1) = P(k ) − L(k + 1)ψ T (k + 1) P(k ) + Rs. (7d). 5. Go to 1. ) In this general recursive prediction error algorithm, ψ (k + 1) is the gradient of the predicted output, y , with respect to a parameter vector, θ , and L(k) is the gain matrix that affects both the adaptation gain and the direction in which the updates of parameters θ are made and can be chosen following several approaches as referred in (Ljung, 1999). A typical approach to the adaptation issue is to assume a model for the parameters variation in which the parameters vary with the time in a random way, that is:. θ (k + 1) = θ (k ) + rs (k ). (8). {. }. rs (k ) is assumed to be white Gaussian noise with covariance matrix, Rs = E rs (k )rs (k ) T . Thus, Rs(k) denotes the covariance matrix of the system noise and expresses the lack of confidence in the estimated ) ) T can be parameters, essentially, due to errors in the system model. P(k ) = E θ (k ) − θ (k ) θ (k ) − θ (k ) interpreted as the covariance matrix of the estimation error.. {(. )(. )}. Let us consider a single-output system described by a linear regression which can be written as: y (k ) = ϕ T (k )θ (k ) + rm (k ). (9). ϕ (k ) is the regression vector and rm (k ) is the measurement noise. In this case Rm = E{rm (k ) 2 } is a scalar. If the system has more than one output ϕ (k ) is the regression matrix and rm (k ) is the. {. }. measurement noise vector being Rm = E rm (k )rm (k ) T the covariance matrix of the measurement noise vector and expresses the lack of confidence in the new measurements. The natural prediction of the output ) ) is y (k + 1) = ϕ T (k + 1)θ (k ) and its gradient with respect to θ , ψ (k + 1) , becomes exactly ϕ (k + 1) . Although a linear regression has been used for the algorithm explanation, it can also be applied to the general case (Ljung, 1999). Taking into account the above considerations, the recursive prediction error method corresponds to the Kalman filter approach to the referred adaptation and is known as Kalman filter (KF) algorithm. Another approach to the adaptation issue is to allow the gain to be computed as follows: L(k + 1) = γ Iψ (k + 1) or L(k + 1) =. 78. γI ψ (k + 1). 2. (10).
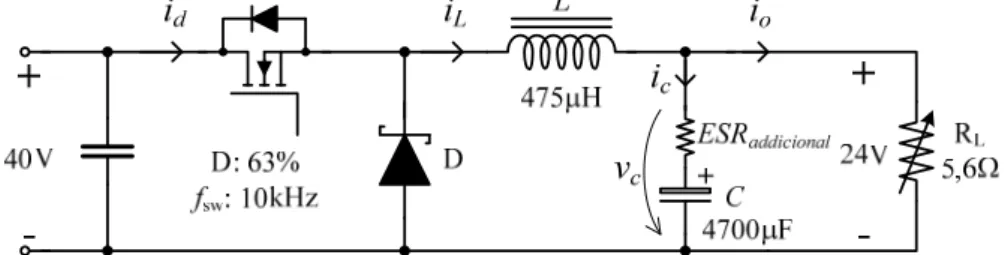
(5) Faro, Portugal, June 13 – 15, 2007. where I is the identity matrix. In these cases the recursive prediction error method given by (7) corresponds to the (unnormalized or normalized) gradient method (UG or NG) with gain γ. A third approach is obtained when old measurements are exponentially discounted with a memory horizon given by τ = 1 /(1 − λ ) , where λ is called forgetting factor. In this case, with Rm=λ, Rs=0 and dividing P(k+1) by λ in step 4, of the recursive prediction error method given by (7) is the forgetting factor approach and also correspond to the recursive least squares (RLS). The three algorithms described above (KF, UG or NG, and RLS) are used in this work for the ESR estimation of electrolytic capacitors. The Experiment and Experimental Setup. A step down converter was used to carry out the experiments regarding the ESR estimation of electrolytic capacitors. In the step down converter, shown in figure 2, the load was held constant, the switching frequency was set to 10 kHz and the duty cycle was adjusted to 0.63 in order to obtain a 24 V output voltage for a 40 V input voltage. A 50 V, 4700 μF electrolytic capacitor was used. The current and voltage across the electrolytic capacitor were acquired with a sampling frequency of 100 kHz. Before the estimation procedure, using the algorithms referred above, these signals are reconstructed off line with linear interpolation with a step of 1μs to perform precise computations of their first derivatives. In order to simulate the ESR increase (aging) of the electrolytic capacitor additional resistance was introduced in series with the capacitor which is represented by ESRadditional in figure 2.. Figure 2: Step down converter used in simulation and experimental results.. The Model Validation. The model validation was carried out by means of several simulations and experimental tests implemented in MATLAB with Simulink®. This section presents some simulation results for validation purposes. Figure 3 shows the ESR estimation using Kalman filter (KF), unnormalized gradient (UG) and recursive least squares with a forgetting factor (RLS) algorithms. Providing that the computation step of the derivatives is small the results are very good as can be seen in figure 3 for (a) ESR=20mΩ, (b) ESR=40 mΩ, (c) ESR=80 mΩ and (d) ESR=160 mΩ. The algorithms were initialized as shown in table 1. KF Rs=1e-18 Rm=1 θ(0)=0 P(0)=1e-10. UG Gain=1e-10 θ(0)=0. RLS. λ=0.995. θ(0)=0 P(0)=1e-10. Table 1: Initialization of the algorithms.. 79.
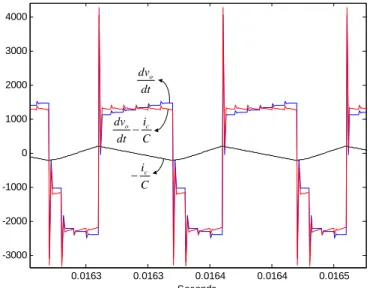
(6) COMADEM 2007. 0.025. 0.045 0.04 RLS UG KF. 0.035. 0.0215 RLS UG KF. 0.021. 0.01. Estimated ESR. 0.015. 0.042. 0.03. 0.022. 0.0205 0.02. 0.0415 RLS UG KF. 0.041. 0.025 Estimated ESR. RLS UG KF. Estimated ESR. Estimated ESR. 0.02. 0.02 0.015. 0.0405 0.04 0.0395 0.039. 0.0195 0.0385. 0.019. 0.01. 0.005. 0.038 0.018 0.0182 0.0184 0.0186 0.0188 0.019 0.0192 0.0194 0.0196 0.0198 0.02 Seconds. 0.0185. 0.005. 0.018 0.018 0.0182 0.0184 0.0186 0.0188 0.019 0.0192 0.0194 0.0196 0.0198 0.02 Seconds. 0. 0. 0.002 0.004 0.006 0.008. 0.01 0.012 0.014 0.016 0.018 Seconds. 0. 0.02. 0. 0.002 0.004 0.006 0.008. (a) 0.18. 0.08. 0.16 RLS UG KF. RLS UG KF. 0.14 0.0815. 0.081. RLS UG KF. 0.0805 Estimated ESR. 0.05 0.04. 0.08. 0.0795. 0.079. 0.03. 0.1615. 0.1. 0.1605. 0.161. 0.08. 0.16 0.1595. 0.1585 0.158 0.018 0.0182 0.0184 0.0186 0.0188 0.019 0.0192 0.0194 0.0196 0.0198 0.02 Seconds. 0.04. 0.01. RLS UG KF. 0.159. 0.06. 0.0785 0.018 0.0182 0.0184 0.0186 0.0188 0.019 0.0192 0.0194 0.0196 0.0198 0.02 Seconds. 0.02. 0.162. 0.12 Estimated ESR. 0.06. Estimated ESR. 0.07. Estimated ESR. 0.02. (b). 0.09. 0. 0.01 0.012 0.014 0.016 0.018 Seconds. 0.02. 0. 0.002 0.004 0.006 0.008. 0.01 0.012 0.014 0.016 0.018 Seconds. 0.02. 0. 0. 0.002 0.004 0.006 0.008. (c). 0.01 0.012 0.014 0.016 0.018 Seconds. 0.02. (d). Figure 3: ESR estimation using KF, UG and RLS algorithms: (a) ESR=20 mΩ, (b) ESR=40 mΩ, (c) ESR=80 mΩ and (d) ESR=160 mΩ.. 4000 3000. dvo dt. 2000 1000. dvo ic − dt C. 0. − -1000. ic C. -2000 -3000 0.0163. 0.0163. 0.0164 Seconds. 0.0164. 0.0165. Figure 4: Illustration of the sensitivity of estimated ESR with respect to errors in C. Actually, the gain of the unnormalized gradient starts with 1e-10, as indicated in table 1, but decreases exponentially to 1e-12. This is done to improve the dynamic of the algorithm during the convergence period, on the one hand, and to reduce the noise in the estimated ESR after that period, on the other hand.. 80.
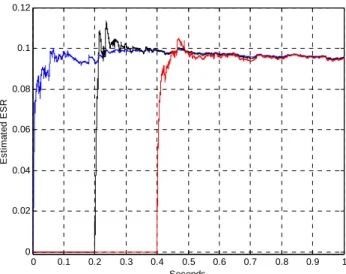
(7) Faro, Portugal, June 13 – 15, 2007. Beforehand, an important drawback of the model given by (2) could be the sensitivity of the ESR estimation with respect to errors in the capacity. Fortunately, this do not happen since the second term of the first member of (2), that is –ic(t)/C, contributes with just a small amount to the output of the model when compared with the first term, dvc (t ) / dt . This is illustrated in figure 4. The Experimental Results. When experimental data is used for ESR estimation in view of electrolytic capacitor conditioning monitoring as describe in the introduction section, there are two aspects to be considered. First, the convergence time of the algorithms becomes much longer and, second, the estimation using the RLS algorithm with a forgetting factor less than 1 is too noisy, even with a high value of the forgetting factor as shown in figure 5. The data was acquired with an additional resistance (ESR) of 50 mΩ. Due to this, and since the forgetting factor approach with λ=1 corresponds to Kalman filter algorithm as shown previously, only the estimations obtained with gradient and Kalman filter algorithms are presented with experimental data. Hence, in figure 6, the estimation of the ESR with an additional resistance of 50 mΩ, using the Kalman filter algorithm, is shown for different starting instants of computation. Both algorithms, KF and UG have similar behaviour. However, even though the UG is simpler it requires an initial gain higher to have similar convergence to the KF. Several tests were achieved regarding ESR estimation with the UG and KF algorithms. To simulate the electrolytic capacitor aging (ESR increase) additional resistance was introduced in series with the capacitor. Table 2 shows the results of several tests performed for this purpose. The values presented correspond to the average of the estimated values during the last 100 ms. Most of the results are also illustrated in figure 7. Although the real value of the ESR is unknown both algorithms show a good consistency. Moreover, the estimation error decrease as the ESR increases which is better for the electrolytic capacitor aging monitoring.. 0.12. 0.2 lambda=0.999 lambda=1. 0.18. 0.1. 0.16 0.14. Estimated ESR. Estimated ESR. 0.08 0.12 0.1 0.08. 0.06. 0.04. 0.06 0.04. 0.02. 0.02 0. 0 0. 0.05. 0.1. 0.15. 0.2. 0.25. Seconds. Figure 5: Illustration of the ESR estimation with forgetting factors 0.999 and 1 (RLS).. 0. 0.1. 0.2. 0.3. 0.4. 0.5 0.6 Seconds. 0.7. 0.8. 0.9. 1. Figure 6: Illustration of the ESR estimation with KF for different starting instants.. 81.
(8) COMADEM 2007. ESR+Additional resistance (mΩ) ESR+0 ESR+25 ESR+50 ESR+70 ESR+90 ESR+164 ESR+267 ESR+322 ESR+544 ESR+820. ESR estimated with UG (mΩ) 41.6 69.3 98.9 120.0 132.5 193.9 289.2 344.4 606.9 912.5. ESR estimated with KF (mΩ) 42.4 69.2 98.6 120.2 133.9 193.4 289.4 344.1 606.1 912.4. 0.09. 0.09. 0.08. 0.08. 0.07. 0.07. 0.06. 0.06. Estimated ESR+0.025. Estimated ESR. Table 2: ESR estimation (with additional resistance - ESR) using unnormalized gradient (UN) algorithm and Kalman filter (KF) algorithm.. 0.05 0.04 0.03. 0.05 0.04 0.03. 0.02. 0.02. 0.01. 0.01. 0. 0. 0. 0.05. 0.1. 0.15. 0.2. 0.25 0.3 Seconds. 0.35. 0.4. 0.45. 0.5. 0. 0.05. 0.1. 0.15. 0.18. 0.16. 0.16. 0.14. 0.14. 0.12. 0.12. 0.1 0.08 0.06. 0.35. 0.4. 0.45. 0.5. 0.35. 0.4. 0.45. 0.5. 0.1 0.08 0.06. 0.04. 0.04. 0.02. 0.02. 0. 0 0. 0.05. 0.1. 0.15. 0.2. 0.25 0.3 Seconds. (c). 82. 0.25 0.3 Seconds. (b). 0.18. Estimated ESR+0.09. Estimated ESR+0.05. (a). 0.2. 0.35. 0.4. 0.45. 0.5. 0. 0.05. 0.1. 0.15. 0.2. 0.25 0.3 Seconds. (d).
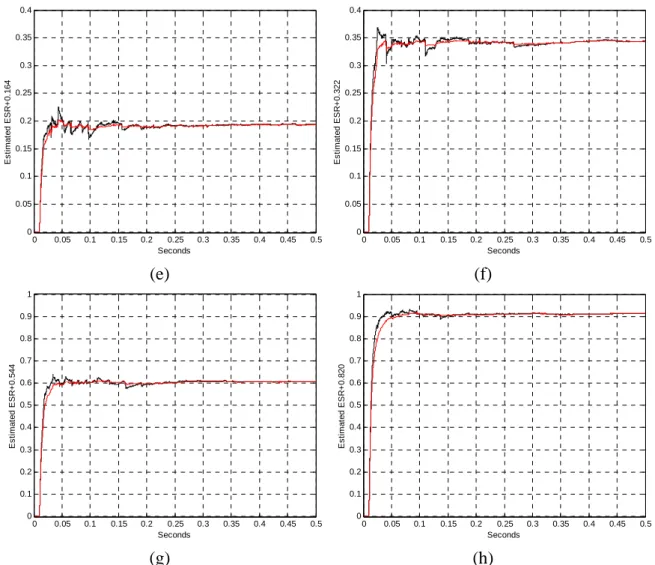
(9) 0.4. 0.4. 0.35. 0.35. 0.3. 0.3 Estimated ESR+0.322. Estimated ESR+0.164. Faro, Portugal, June 13 – 15, 2007. 0.25 0.2 0.15. 0.25 0.2 0.15. 0.1. 0.1. 0.05. 0.05. 0. 0 0. 0.05. 0.1. 0.15. 0.2. 0.25 0.3 Seconds. 0.35. 0.4. 0.45. 0.5. 0. 0.05. 0.1. 0.15. 0.25 0.3 Seconds. 0.35. 0.4. 0.45. 0.5. 0.35. 0.4. 0.45. 0.5. (f). 1. 1. 0.9. 0.9. 0.8. 0.8. 0.7. 0.7. Estimated ESR+0.820. Estimated ESR+0.544. (e). 0.2. 0.6 0.5 0.4 0.3. 0.6 0.5 0.4 0.3. 0.2. 0.2. 0.1. 0.1. 0. 0 0. 0.05. 0.1. 0.15. 0.2. 0.25 0.3 Seconds. (g). 0.35. 0.4. 0.45. 0.5. 0. 0.05. 0.1. 0.15. 0.2. 0.25 0.3 Seconds. (h). Figure 7: ESR estimation using KF and UG algorithms: (a) ESR+0 mΩ, (b) ESR+25 mΩ, (c) ESR+50 mΩ, (d) ESR+90 mΩ, (e) ESR+164 mΩ, (f) ESR+322 mΩ, (g) ESR+544 mΩ and (h) ESR+820 mΩ.. CONCLUSIONS. Electrolytic capacitors are a critical element in power electronic systems. In most cases, despite of their advantages, they are the most life-limiting device. The deterioration caused by evaporation of the electrolyte is reflected by the increase of the equivalent series resistance (ESR). This leads to the temperature increased and this in turn leads to further evaporation and increase of ESR. This paper presented a simple ESR identification methodology for electrolytic capacitors condition monitoring in view of preventive maintenance. The identification methodology is based on a very simple continuous-time model given by (2), and some recursive prediction error methods. As far as the estimation algorithms is concerned, the Kalman filter, gradient and forgetting factor approaches were investigated. Kalman filter and unnormalized gradient algorithms proved to be suitable with experimental data. The forgetting factor approach requires a forgetting factor 1 (which corresponds to the RLS) and gives the same results of Kalman filter algorithm. Even though the model uses the computation of first derivative of the capacitor’s voltage and current, by means of suitable filters, the identification methodology produces very good results with experimental data. The proposed identification methodology only uses the capacitor’s voltage and current measurements. Even though it was validated for a step down converter, it is also suitable for different power converter topologies and can be used as a condition monitoring procedure in preventive maintenance or can be implemented for the same purpose as part of the control.. 83.
(10) COMADEM 2007. REFERENCES AELOÍZA, E.C., KIM, J.H., RUMINOT, P. AND ENJETI, P.N., 2005. A real time method to estimate electrolytic capacitor condition in PWM adjustable speed drives and uninterruptible power supplies. In: IEEE, ed. 36th Power Electronics Specialists Conference, 12-16 June, Recife, 2867-2872. AMARAL, A.M.R. AND CARDOSO, A.J.M., 2004a. Use of ESR to predict failure of output filtering capacitors in boost converters. In: IEEE, ed. 2004 INTERNATIONAL SYMPOSIUM ON Industrial Electronics, 4-7 May 2004, vol. 2, Ajaccio, 1309-1314. AMARAL A.M.R. AND CARDOSO, A.J.M., 2004b. FAULT DIAGNOSIS ON SWITCH-MODE POWER SUPPLIES OPERATING IN DISCONTINUOUS MODE. In: IEE, ed. 2nd International Conference on Power Electronics, Machines and Drives, 31 March-2 April, Edinburgh, 197-202. CORNELL-DUBILIER. Application http://www.cde.com/appguide/.. Guide,. Aluminum. Electrolytic. Capacitors. EVOX RIFA, (a). Life-limiting factors in electrolytic http://www.evoxrifa.com/europe/technotes_electrolytics.htm. capacitors. EVOX RIFA, (b). Electrolytic Capacitors Application http://www.evoxrifa.com/europe/technotes_electrolytics.htm. Guide. [online]. [online].. [online].. Available. Available. from:. Available. from:. GASPERI, M.L., 1996. Life prediction model for aluminum electrolytic capacitors. In: IEEE, ed. 31st Industry Applications Society Annual Meeting, 6-10 October, vol. 3, San Diego, 1347-1351. GASPERI, M.L., 1997. A method for predicting the expected life of bus capacitors. In: IEEE, ed. 32nd Industry Applications Society Annual Meeting, 5-9 October 1997, vol. 2, New Orleans, 1042-1047. HARADA, K., KATSUKI, A., FUJIWARA, M., 1993. Use of ESR for Deterioration Diagnosis of Electrolytic Capacitors. IEEE Transactions Power Electronics, vol. 8 (4), 355-361. HARRISON, A.J.L. AND STOTEN, D.P., 1995. Generalized Finite Difference Methods for Optimal Estimation of Derivatives in real-Time Control Problems. Journal of Systems and Control engineering, Proc Instn Mech Engrs vol. 209, 67-78. IMAM, A.M., HABETLER, T.G., HARLEY, R.G. AND DIVAN, D.M., 2005. Condition monitoring of electrolytic capacitor in power electronic circuits using adaptive filter modelling. In: IEEE, ed. 36th Power Electronics Specialists Conference, 12-16 June 2005 Recife, 601-607. LAHYANI, A., VENET, P., GRELLET, G. AND VIVERGE, P.J., 1998. Failure prediction of electrolytic capacitors during operation of a switchmode power supply. Transactions on Power Electronics, vol. 13 (6), 11991207. LJUNG, L., 1999. System Identification – Theory for the User. 2nd ed. New Jersey: Prentice Hall. MADDULA, S.K. AND BALDA, J.C, 2005. Lifetime of electrolytic capacitors in regenerative induction motor drives. In: IEEE, ed. 36th Power Electronics Specialists Conference, 12-16 June 2005 Recife, 153-159. ONDEL, O., BOUTLEUX, E. AND VENET, P., 2004. A decision system for electrolytic capacitors diagnosis. In: IEEE, ed. 35th Power Electronics Specialists Conference, 20-25 June 2004 Aachen, 4360-4364. PARLER, S.G., Jr.., (a). Selecting and Applying Aluminum Electrolytic Capacitors for Inverter Applications [online]. Available http://www.cde.com/tech/. PARLER, S.G., Jr.., (b). Reliability of CDE Aluminum Electrolytic Capacitors [online]. Available http://www.cde.com/tech/. SANKARAN, V., REES, F., AVANT, C., 1997. Electrolytic Capacitor Life Testing and Prediction. In: IEEE, ed. 32nd Industry Applications Society Annual Meeting, October 5-9 New Orleans, 1058-1064. STEVENS, J.L., SHAFFER, J.S. AND VANDENHAM, J.T., 2002. The Service Life of Large Aluminum Electrolytic Capacitors: Effects of Construction and Application. IEEE Transactions on Industry Applications, September/October, vol. 38 (5), 1441-1446. VENET, P., PERICE, F., EL-HUSSEINI, M.H. AND ROJAT, G., 2002. Realization of a Smart Electrolytic Capacitor. IEEE Industry Applications Magazine, Jan|Feb, 16-20.. 84.
(11)
Imagem
Documentos relacionados
Este trabalho buscou avaliar a contribuição do Projeto de Educação Ambiental PEA do Programa Bahia Azul na construção de conhecimentos e no desenvolvimento de valores e
De qualquer forma, por esses e outros debates que ainda provocam a cidade, a “verdade” sobre o que foi e é a história da Estrutural ainda é objeto de
creation of an online network for continual professional training and career development for Food Scientists and Technologists in Europe. ( information on
Da maneira como Husserl retoma Descartes, apropriando-se dele e apontando seus sucessos e falhas, Levinas toma as meditações e uma ideia fundamental ao argumento ontológico
Os professores necessitam de um guia na identificação das ideias dos alunos nas áreas em que não ainda existe pesquisa. Mas mesmo em áreas em que há pesquisa
O estudo teve a duração de sete (7) meses, durante os quais as atletas foram avaliadas através dos seguintes testes: Teste de avaliação da composição corporal
remetem para fundamentos científicos e técnicos das ciências biológicas ou para situações dilemáticas no contexto da prestação dos cuidados de saúde em que
We report here a very simple methodology based on a set of tri-, tetra- and pentanucleotide repeat microsatellites which allows the si- multaneous study of microsatellite instabil-
