TiO
2
thin film synthesis from complex precursors by
CVD, its physical and photocatalytic properties
V. G. Besserguenev,
1,†R. J. F. Pereira,
1M. C. Mateus,
1I. V. Khmelinskii,
1R. C. Nicula,
2and E. Burkel
21Algarve University, Campus de Gambelas, 8000-117 Faro, Portugal 2University of Rostock, FB Physik, August-Bebel-Str. 55, 18055 Rostock, Germany
Abstract. Photocatalytic TiO2films on glass and quartz plates were obtained by the chemical vapour
deposition using Ti(dpm)2(Opri)2complex compound (CC-CVD method) in a standard vacuum apparatus
at 1.2–2.0× 10⁻⁴mbar. The substrate temperature was stabilised in the range of 450–600◦C. The growth
rate varied from several nanometres to several dozen of nanometres per minute. Structural information on
TiO2 thin films was obtained from synchrotron radiation experiments. High-resolution grazing incidence
X-ray diffraction (GIXRD) experiments were performed at the high-resolution powder diffractometer at the DESY/HASYLAB beamline B2 (Hamburg, Germany). Thin films deposited on either single-crystal Si wafers
or on amorphous quartz substrates were analysed. The photocatalytic activity of the TiO2thin films was
studied using a photocatalytic reactor. The fungicide Fenarimol was chosen as chemical indicator and its degradation kinetics was followed by High-Performance Liquid Chromatography (HPLC).
1. INTRODUCTION
Great interest has been recently provoked by the tech-nology of water purification of organic compounds, such as pesticides, using photocatalysis by semicon-ductors, such as titanium dioxide (TiO2). This tech-nology typically reduces toxic organic compounds to non-toxic inorganic compounds, such as carbon diox-ide, water, ammonium or nitrates, and chloride ions.
In order to avoid the use of TiO2powder, which en-tails later separation from water, various researchers started to investigate ways of immobilising TiO2 parti-cles, for example in thin film form [1, 2]. Actually the thin film technique is becoming a standard for prepa-ration of TiO2-based photocatalysts. One of the advan-tages of thin film photocatalysts is that the catalyst layer may be connected to an external power source to reduce the recombination of UV-activated electrons and holes and thus, the efficiency of the catalyst is in-creased [3].
Among the modern methods of thin solid film preparation, the method of Chemical Vapour Deposi-tion (CVD) is one of the most flexible, applicable when it is necessary to prepare doped films or multi-layer structures. In addition, CVD in vacuo will permit, to easily combine sulphides of metals with oxides to pre-pare multi-layer conducting/photocatalytic structures like In2S3(In2O3: S)/TiO2[4].
It is generally believed that the presence of a ready-made fragment of the material to be deposited (such as O− Ti − O) in the source molecule accelerates the kinet-ics of thin film growth, and effectively permits to reduce the synthesis temperature. Moreover, the O− Ti − O
†E-mail: vbess@ualg.pt
groups promote the oxide phase formation irrespective on the O2presence in the gas phase [5].
One of the important problems is the selection of the optimum source compounds for TiO2films. Among them TiO(dpm)2, Ti(OR)4 and Ti(dpm)2(OR)2 were used [6, 7]. Lately, Ti(dpm)2(OPri)2 (dpm = 2,2,6,6-tetramethylheptane-3,5-dione, Pri= isopropyl) found a
wide application as a starting compound for TiO2 con-taining films prepared by different methods (MOCVD, sol-gel, sputtering) [8, 9]. Data on the thermal be-haviour in condensed phase of some commercially available samples of this substance have recently been reported [10, 11].
The main purpose of the present paper is to study the growth processes of TiO2thin films and their struc-tural properties using the Ti(dpm)2(OPri)2complex as CVD precursor and to study the photocatalytic activity of the resulting films.
In this work, the fungicide Fenarimol—{α-(2- chlorophenyl)-α-(4-chlorophenyl)-5-pyrimidine-metha-nol}—was chosen as chemical indicator. Its photochem-ical behaviour in aqueous solutions under sunlight has been studied in our laboratories, including kinet-ics and photoproducts, and is now reasonably well known [12–15], thus making its chemical behaviour in the photocatalytic TiO2system a good starting point. These experiments were also compared with kinetics studies in aqueous TiO2 suspensions irradiated by sunlight or by a Xenon arc lamp.
2. EXPERIMENTAL
The thermal properties and the thermal decomposition reaction of Ti(dpm)2(OPri)2in vacuum were described in detail earlier [16].
The TiO2 films were obtained in a standard vac-uum apparatus (∼ 5 × 10⁻⁷mbar). Vaporisation was conducted from an open surface evaporator. The tem-perature of the vapour source was varied in the range of 90–210◦C, and the substrate temperature was sta-bilised in the range of 450–600◦C. The pressure of the volatile decomposition products of the starting com-pound was 1.2–2.0× 10⁻⁴mbar depending on the de-position parameters, with the system working in the molecular vapour stream regime. The size of the vac-uum chamber allowed the evaporator—substrate dis-tance to be varied from several centimetres to 40 cm.
Different types of glass and fused quartz plates of 78.5 cm2were used as substrates. All substrates were cleaned carefully using a specially developed procedure right before loading. The film thickness was determined by weight. It was found to be between 100 and 300 nm. The growth rate could be varied from several nanome-ters to several tens of nanomenanome-ters per minute.
The High-resolution grazing incidence X-ray diffrac-tion (GIXRD) method was used to study the crystal structure of the prepared samples. The GIXRD exper-iments were performed at the high-resolution pow-der diffractometer at the DESY/HASYLAB beamline B2 (Hamburg, Germany). We used grazing incidence angles
αibetween 0.9 and 1.0 degrees. The synchrotron radi-ation wavelength was λ= 0.11371 nm.
A photoreactor apparatus was developed in order to follow the kinetics of Fenarimol degradation with and without photocatalytic action of the TiO2thin films (see Figure 1). The volume of the irradiated solution was 7.9 ml with 1 mm optical thickness; a water filter with fused quartz windows was used in order to avoid an ex-cessive heating of the solution. The photocatalytic pro-cess in water requires the presence of O2 as electron acceptor, thus a continuous flow of air was injected by means of an air pump.
The light intensity has been measured using a Sola-Scope I spectroradiometer (Solatell) and a IL700 A radiometer (International Light) with a SEE240 UVB
Air escape and solution sampling Quartz Disk with TiO2film inside
Air injection by an air pump Quartz Disk without film Water Filter Xenon Lamp Quartz Disk (a) (b) Plastic support
Figure 1. Sample solution irradiation diagram. (a)
photore-actor cell profile view; (b) photorephotore-actor cell front view.
detector (sensitivity curve maximum at 294 nm, half power points at 282 and 304 nm). The photon flux in-tensity of 3.45 Ein h−1l−1 used in the quantum yield calculations was obtained integrating the spectrora-diometer results in the 280–340 nm range and taking into account the illuminated reactor area of 75.4 cm2 and its total volume of 10.4 cm3. The wavelength range was limited by the spectrum of the lamp and by absorp-tion of the deposited film. The exact spectral shape of the TiO2film absorbance curve was not accounted for in the light intensity calculations and might introduce 20% of error into the absolute quantum yield values.
Fenarimol (Riedel, 99.7%) 5 mg/l solutions were pre-pared in bidistilled water.
Before irradiation, the Fenarimol solution was left in contact with the reactor cell about 12 h in the dark in order to achieve the adsorption equilibrium of the pesticide between the solution and the cell surfaces.
During irradiation, 100 µl samples were taken every 0.5 h or 1 h, and immediately analysed with a HPLC sys-tem (Merck-Hitachi 655A-11 syssys-tem with 655A-22 UV detector) under the following experimental conditions: LichroCART 125-4 column; Lichrospher 100 RP-18, 5 µm; acetonitrile eluent (Merck Lichrosolv) 65%, bidis-tilled water 35%; 1.1 ml/min flow; detection at 220 nm. Eleven different types of TiO2thin films, deposited on different substrates at different temperatures, were tested (Table 1). The total irradiation time was between 3 and 5 hours for each sample.
To compare the reaction rates to that of the TiO2 P25 powder (Degussa), the same amount by weight (7 mg) was deposited on a quartz substrate, by evap-oration from a TiO2aqueous suspension, and tested in the same way.
3. RESULTS AND DISCUSSION
3.1. Preparation and studies of TiO2 films. The
structural phases that can be formed in a titanium diox-ide sample are the amorphous phase, the metastable crystalline forms, brookite and anatase, and the high-temperature stable anatase phase [17]. The three metastable forms all occur in nature, although rutile is the most common. It should be noted that other oxides, Ti2O, TiO, Ti2O3, Ti3O5 and TinO2n−1 (n = 4, . . . , 10) may be formed at low oxygen concentrations.
The transition from the amorphous to the anatase form usually requires temperatures close to 300◦C. The phase transition anatase→ rutile occurs in the
range 600–800◦C upon heating of a TiO2powder sam-ple [18, 19], the reverse transition does not occur upon cooling because of the high activation energy. In the case of bulk samples, the anatase-to-rutile phase tran-sition occurs at temperatures over 800◦C.
Beyond the well-known use of the metastable anatase phase in a broad range of photocatalytic pro-cesses, supporting evidence for the enhanced catalytic
Table 1. TiO2thin-films deposition conditions.
Sample identification Substrate Film Thickness (nm) Deposition Temp (◦C)
R1 Glass (2 mm) 100 450 R2 Glass (2 mm) 90 420 R3 Glass (2 mm) 110 480 R4 Glass (2 mm) 200 450 R5 Striped Glass 11 450 R6 Quartz 170 435 R7 Quartz 60 465 R8 Quartz 85 450 R9 Quartz 25 400 R10 Quartz 240 450 R11 Quartz 200 520 R12 Ceramic Glass 100 450 R13 Ceramic Glass 170 465
activity of nanostructured mixed-phase titania was re-cently found [20]. Therefore, one of our preliminary aims was to determine the optimal deposition and pro-cessing parameters that would lead to the formation of either single-phase anatase or anatase-rutile phase mixtures in the thin film samples.
Although previous CVD deposition runs on ordi-nary glass substrates at 520–550◦C, have produced polycrystalline anatase modifications as verified by X-ray qualitative analysis [16], further attempts to repro-duce this polycrystalline form on other substrates, that would be stable at the deposition temperature, were not successful.
Single-phase rutile (R) films were obtained after CVD deposition at temperatures close to 500◦C (Fig-ure 2) on Si wafer substrates. Post-synthesis annealing does not modify the structure of the as-deposited films since rutile is the stable high-temperature phase.
For samples deposited on fused quartz substrates, a representative grazing incidence X-ray diffraction pat-tern is shown in Figure 3. Along with Bragg reflections corresponding to the major (R) rutile phase, several
(220) (211) (210) (111) (200) (101) (110) B2@HASYLAB (May 2001) intensity/arb. units CC-CVD TiO2/Si sample S5 (rutile) 20 25 30 35 40 2Θ/deg.
Figure 2. GIXRD pattern of as-deposited TiO2 film on Si
wafer substrate. Single-phase rutile films are obtained in
the as-deposited state. Deposition temperature 520◦C, film
thickness≈ 500 nm.
low-intensity anatase diffraction peaks could also be detected. Further annealing of these TiO2films in order to increase the oxygen thin film content, lead to the dis-appearance of the minor anatase phase (A)—Figure 4, so that single-phase rutile films were obtained. For several samples thermally annealed at approx. 900◦C, prefer-ential orientation along the 110 crystallographic direc-tion could be noticed (Figure 4, top).
In order to investigate in more detail the texture effects present in thin-film samples annealed at high-temperatures above the anatase-to-rutile transition, a series of X-ray diffraction experiments were per-formed at the BW4 wiggler beamline (DESY/HASYLAB) using two-dimensional image-plate detectors. A stan-dard Al2O3(NIST-647a) powder reference sample was used for the energy calibration of the incoming syn-chrotron radiation beam and of the detector-sample distance.
The image-plate X-ray diffraction pattern of a mul-tilayer sample after annealing for 2 hours at 650◦C shows only weak preferred orientation effects (Fig-ure 5). This indicates that thick (750 nm) homogeneous
R(220) R(211) R(210) R(111) R(200) A(004) A(103) R(101) TiO2(Q55)
rutile (R) + anatase (A) R(110) 80 60 40 20 0 20 25 30 35 40 norm. intensity( %) 2Θ/deg.
Figure 3. GIXRD pattern of as-deposited TiO2 film on
quartz. Both rutile (R, dominant phase) and anatase (A)
phases are present. Deposition temperature 450◦C, film
R(110) R: rutile intensity/arb. units CC-CVD TiO2(Q55a, Q55b) 20 25 30 35 40 R(220) R(211) R(210) R(101) R(220) R(210) R(111) R(200) R(101) T = 900◦C T = 650◦C B2@HASYLSB(GIXRD, 5.2001) 2Θ/deg.
Figure 4. GIXRD pattern of TiO2films annealed at 650◦C
(bottom) and 900◦C (top) respectively. Single-phase rutile
films are obtained (sample Q55, glass substrate).
(110) (101) (200) (111) (210) (211) (220) (002) (310)
Figure 5. Image-plate diffraction pattern of the Q65
sam-ple(quartz substrate, deposition temperature 520◦C,
thick-ness 750 nm) after 2 hours at 650◦C.
films may nevertheless be produced by CC-CVD deposi-tion followed by an adequate post-synthesis annealing procedure.
Our results demonstrate a shift to lower tempera-tures for rutile deposition compared with the usually 700◦C for TiO2 powder formation by annealing, thus we tried to use a lower deposition temperature to ob-tain the anatase form. However, the Ti(dpm)2(OPri)2
precursor doesn’t decompose below 400◦C so that TiO2 could not be deposited at too low temperatures.
3.2. Phocatalytic activity of TiO2 films. At
present, the mechanism of photocatalytic activity is not well understood. The schematic concept of the photocatalytic reaction which includes the valence electron excitation in semiconductor materials and the formation of H• and OH• radicals on the material surface does not explain why TiO2is a better photocat-alyst than other semiconductors like ZnO, Fe2O3, MgO etc. Moreover, TiO2materials synthesised using differ-ent methods [21, 22] exhibit differdiffer-ent photocatalytic properties. Indeed, materials synthesised by the sol-gel method with an essentially amorphous structure and the 75/25 anatase/rutile structural ratio show a pho-tocatalytic activity comparable with the Degussa P25 TiO2(80/20 anatase/rutile ratio) but higher than that of the pure anatase powders. These studies suggest that photocatalytic performance should be dependent on several parameters including the particle size, the surface area and the ratio between the anatase and rutile crystal phases.
Rutile, however, has generally been assumed to have larger crystallite size and lower photocatalytic activity as compared to anatase. The difference in the lattice structure causes different mass densities and electronic band structures of the two TiO2forms. As a result, the band gap increases and the band edges shift to larger redox potentials making the anatase form of TiO2 a much better catalyst than the rutile form. However, opinions are divided as regards the reasons for the observed activity decrease resulting from annealing the powder samples between 600 and 700◦C, accompanied by anatase transformation into rutile. Some authors [18] believe this is due to the grad-ual increase of the rutile fraction when the annealing temperature is increased. However, Mills et al., explain the catalytic activity decrease by a drop in the spe-cific surface area of the TiO2 due to particle sinter-ing, rather than to the anatase to rutile transforma-tion, which occurs at temperatures above 700◦C [19]. This means that there exists a reasonable correlation between photocatalytic activity and the surface area of the particles in the dispersion. On the other hand, some authors indicated that the rutile phase of TiO2might be active or inactive according to the TiO2synthesis conditions [23].
Considering the polemics arising from the previous discussion, it was also important to test the catalytic activity of the rutile thin films, obtained by CVD depo-sition using the Ti(dpm)2(OPri)2complex as TiO2 pre-cursor.
The problem of the rutile 110 surface activity was recently studied both experimentally and theoreti-cally. Based on the experimental results, it has been variously proposed that water adsorbs (a) molecularly
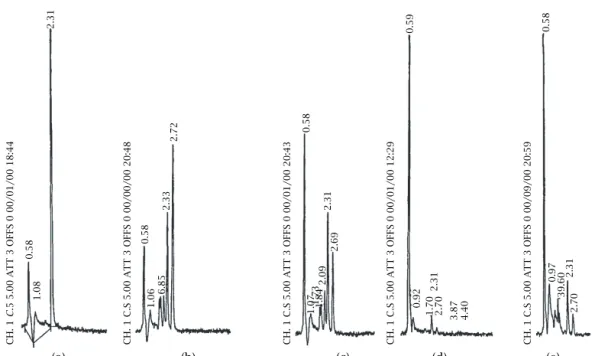
2.70 2.31 39.60 0.97 C H .1C .S 5.00 ATT 3 OFFS 0 00/09/00 20:59 0.58 4.40 3.87 2.70 2.31 1.70 0.92 0.59 C H .1C .S 5.00 ATT 3 OFFS 0 00/01/00 12:29 2.69 2.31 2.09 1.841.73 1.07 0.58 C H .1C .S 5.00 ATT 3 OFFS 0 00/01/00 20:43 2.72 2.33 6.85 1.06 0.58 C H .1C .S 5.00 ATT 3 OFFS 0 00/00/00 20:48 2.31 1.08 0.58 CH. 1 C .5 5.00 ATT 3 OFFS 0 00/01/00 18:44 (e) (d) (c) (b) (a)
Figure 6. Degradation of Fenarimol (5 mg/l, in water) monitored by HPLC. (a) Before irradiation. (b) 3 h of irradiation, no
photocatalist. (c) 3 h of irradiation in contact with TiO2thin film deposited on ceramic glass at 450◦C by CVD. (d) 2.5 h of
irradiation in contact with a TiO2thin film deposited in quartz by evaporation of water from a TiO2suspension. (e) 1.5 h
of irradiation in contact with a TiO2water suspension. Notes: The TiO2amounts in the water suspensions and on the
ceramic glass were identical. Chromatographic peak retention times: 0.58 - non-retained compounds; 2.31 - Fenarimol; 2.70 - Fenarimol photoproduct resulting from direct photodegradation; smaller peaks - other degradation products.
on the 110 surface and only dissociates at defect sites [24], (b) dissociatively at low coverages and thereafter molecularly [25], (c) ether molecularly or dissociatively depending on temperature [26]. One point of consensus is that if dissociation does occur, it is only at small concentrations. It was recently cal-culated by I. D. Lindan, et al. [27], using first principles density-functional methods that a monolayer of H2O on the rutile 110 surface would contain water in both molecular and dissociated forms. With this results it is possible to conclude that the 110 surface should be photocatalytically active. As it was already mentioned, the CVD thin films annealed at high temperatures have the same 110 crystal orientation, so it should be expected this 110 termination would be also present in films prepared at lower temperatures.
One can note that the film thickness varies with the variation in substrate and temperature (Table 1). The three simultaneous variables make it difficult to get a clear quantitative picture for the Fenarimol degradation velocity. For example the fungicide adsorption degree may also be influenced. Instead, more valuable infor-mation can be obtained comparing the photoproducts formation by chromatographic analysis.
Previous studies have shown that Fenarimol, when irradiated by sunlight or by a Xenon lamp, photo-degrades into several photoproducts [15], which suf-fer further degradation into minor and polar molecules
eluted within the solvent peak of the chromatogram and indistinguishable in our analysis conditions.
The photocatalytic activity of our TiO2thin-films was estimated by the growth of the chromatographic peak of the non-retained compounds. This peak increases not only due to the decreasing area of the Fenarimol peak, but above all due to the degradation of all the intermediary photoproducts. In our photore-actor two concurrent degradation processes occur— direct photodegradation and photocatalytic degrada-tion, thus the chemical stability of the intermediate photoproducts will depend on the photocatalytic activ-ity of the TiO2thin films.
Of all the films tested, the TiO2 films prepared at 450◦C on ceramic glass substrates were the only samples to exhibit the photocatalytic activity. Figure 6 shows a typical chromatogram of different samples: not irradiated (a), irradiated without TiO2(b) and irradiated in contact with TiO2 (Degussa P25) (d,e). It is worth noticing that Figure 3 shows evidence of a mixed TiO2 structure with a small amount of the anatase, instead of the pure rutile form observed in the other deposi-tion condideposi-tions. Considering that the other thin films have shown no evidence of photocatalytic activity, we attribute the catalytic effect of the R12 sample (Table 1) to the slight amount of anatase present.
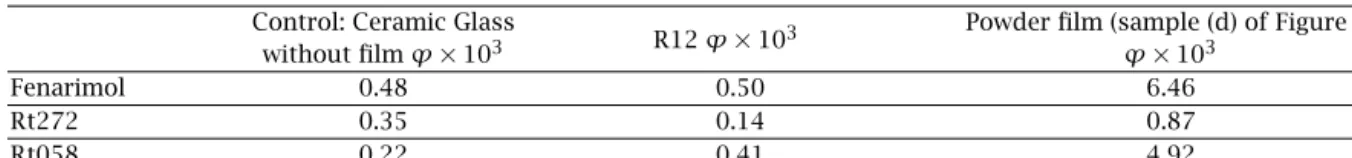
Table 2 presents the quantum yield data for the R12 sample as compared to the control and the Degussa P25
Table 2. Quantum yields ϕ for Fenarimol photolysis and product formation. The products are labeled according to
chro-matographic retention times.
Control: Ceramic Glass
R12 ϕ× 103 Powder film (sample (d) of Figure 6)
without film ϕ× 103 ϕ× 103
Fenarimol 0.48 0.50 6.46
Rt272 0.35 0.14 0.87
Rt058 0.22 0.41 4.92
Note: The product concentrations were quantified assuming equal absorbance values for all the compounds involved, a reasonable assumption given that the total area of all the peaks remains constant within 20%. Additional errors of the quantum yields are due to the uncertainties related to the exact film absorption spectrum, as explained in the text.
powder results. The quantum yields were calculated based on the photon flux measurements. These data demonstrate that the product formation yields sum up to give Fenarimol decomposition yield within 20%, which lies within the margin of error of the equal ab-sorbance assumption made in product quantification— see the note to the Table. These data show the photo-catalytic activity of the R12 sample, manifested in the product ratio change: the Rt272 product is formed with lower relative yield, while the Rt058 product—with a higher relative yield, as compared to the control. This is the same tendency as we see in the product ratio char-acteristic of the TiO2film obtained from the Degussa P25 powder, as opposed to the control, where only the direct photolysis takes place.
4. CONCLUSIONS
The use of the complex compound Ti(dpm)2(OPri)2, as precursor for TiO2thin films deposition using the CC-CVD method, with deposition temperatures between 400 and 520◦C, leads to the formation of TiO2 rutile phase, which shows no photocatalytic activity. The sam-ple R12 shows photocatalytic activity, however quite low as compared to the P25 powder, which we attribute to low anatase contents.
Further effort is in progress to improve the anatase phase deposition, taking advantage of alternative tech-niques such as plasma and photo-assisted CC-CVD methods.
ACKNOWLEDGEMENT
The authors are grateful to Fundação para a Ciên-cia e Tecnologia for the finanCiên-cial support given in the framework of the projects POCTI/43520/FIS/2000, 423/DAAD-ICCTI and project II-01-64 (HASYLAB) and to Degussa Portugal for the TiO2powder samples.
REFERENCES
[1] R. W. Mattews, J. Phys. Chem. 91 (1987), 3328. [2] A. Fujishima, T. N. Rao, and D. A. Tryk, Journal of
Photochemistry and Photobiology - C: Photochem-istry Reviews 1 (2000), 1.
[3] H. T. Chang, N.-M. Wu, and F. Zhu, Wat. Res. 34 (2000), 407.
[4] V. G. Bessergenev, E. N. Ivanova, Yu. A. Ko-valevskaya, S. A. Gromilov, V. N. Kirichenko, and S. V. Larionov, Inorganic Materials 32 (1996), 592. [5] A. E. Turgambaeva, A. F. Bykov, V. V. Krisyuk, and
I. K. Igumenov, J. Phys. IV France 9 (1999), 8. [6] T. Kawahara, M. Yamamuka, J. Tanimura, M.
Taru-tani, T. Kuroiwa, T. Horikawa, and K. Ono, Jpn. J. Appl. Phys. 36 (1997), 5874.
[7] M. Yamamuka, T. Kawahara, T. Horikawa, and K. Ono, J. Appl. Phys. 36 (1997), 2555.
[8] F. Ando, H. Shimizu, I. Kobayashi, and M. M. Okada, Jpn. J. Appl. Phys. 36 (1997), 5820.
[9] H. Yamazaki, T. Tsuyama, I. Kobayashi, and Y. Sug-imori, Jpn. J. Appl. Phys. 31 (1992), 2995.
[10] H.-K. Ryu, J. S. Heo, S.-I. Cho, and S. H. S. H. Moon, Fundamental Gas-Phase and Surface Chemistry of Vapour-Phase Materials Synthesis, (M. D. Allen-dorf, M. R. Zachariah, L. Mountziaris, and A. H. McDaniel, Eds.), vol. 98, The Electrochemical Soci-ety Proceedings Series, Pennington, NJ, PV, 1998, p. 329.
[11] H.-K. Ryu, J. S. Heo, S.-I. Cho, and S. H. Moon, J. Electrochem. Soc. 146 (1999), 1117.
[12] M. C. D. A. Mateus, A. M. Silva, and H. Burrows, Journal of Photochemistry and Photobiology - A: Chem. 80 (1994), 409.
[13] M. C. D. A. Mateus, A. M. Silva, and H. Burrows, Spectrochimica Acta Part A: 53 (1997), 2679 . [14] M. C. D. A. Mateus, A. M. Silva, and H. Burrows,
Water Research 34 (2000), 1119.
[15] M. C. D. A. Mateus, A. M. Silva, and H. Burrows, Chemosphere 3 (2002), 363.
[16] V. G. Bessergenev, I. V. Khmelinski, R. J. F. Pereira, Krisuk, V. V. A. E. Turgambaeva, and I. K. Igume-niov, Vacuum 64 (2002), 275.
[17] D. M. Adams, Inorganic Solids, J. Wiley & Sons, U.S.A., 1974, p. 72.
[18] L. G. Devi and G. M. Krishnaiah, Journal of Photo-chemistry and Photobiology - A: Chem. 121 (2000), 141.
[19] A. Mills and S. Morris, Journal of Photochemistry and Photobiology - A: Chem. 71 (1993), 285. [20] F. J. Huai, China Chem. Lett. 2 (1997), 149. [21] B. Malinowska, J. Walendziewski, D. Robert, J. V.
Weber, and M. Stoparski, 2nd European Meeting on “Solar Chemistry and Photocatalysis: Environmen-tal Applications”, comm. O4, 2002.
[22] Y. Bessekhouad, D. Robert, and J. V. Weber, 2nd European Meeting on “Solar Chemistry and Photo-catalysis: Environmental Applications”, comm. O9, 2002.
[23] A. Sclafani, L. Palmisano, and M. Schiavello, J. Phys. Chem. 94 (1990), 829.
[24] M. A. Henderson, Surf. Sci. 355 (1996), 151. [25] M. B. Hugenschmidt, L. Gamble, and C. T.
Campbell, Surf. Sci. 302 (1994), 329.
[26] R. L. Kurtz, R. Stockbaumer, T. E. Madey, E. Roman, and J. L. Segovia, Surf. Sci. 218 (1989), 178. [27] P. J. D. Lindan, N. M. Harrison, and M. J. Gillan, Phys.
Submit your manuscripts at
http://www.hindawi.com
Hindawi Publishing Corporation
http://www.hindawi.com Volume 2014
Inorganic Chemistry
International Journal ofHindawi Publishing Corporation
http://www.hindawi.com Volume 2014
Photoenergy
Hindawi Publishing Corporation
http://www.hindawi.com Volume 2014
Carbohydrate
Chemistry
International Journal ofHindawi Publishing Corporation
http://www.hindawi.com Volume 2014
Journal of
Chemistry
Hindawi Publishing Corporation
http://www.hindawi.com Volume 2014
Physical Chemistry
Hindawi Publishing Corporation http://www.hindawi.com
Analytical Methods
in Chemistry
Journal of Volume 2014 Bioinorganic Chemistry and ApplicationsHindawi Publishing Corporation
http://www.hindawi.com Volume 2014
Spectroscopy
International Journal ofHindawi Publishing Corporation
http://www.hindawi.com Volume 2014
The Scientific
World Journal
Hindawi Publishing Corporation
http://www.hindawi.com Volume 2014
Medicinal Chemistry
Hindawi Publishing Corporationhttp://www.hindawi.com Volume 2014
Chromatography
Research International
Hindawi Publishing Corporationhttp://www.hindawi.com Volume 2014
Applied Chemistry
Journal ofHindawi Publishing Corporation
http://www.hindawi.com Volume 2014
Hindawi Publishing Corporation
http://www.hindawi.com Volume 2014
Theoretical Chemistry
Journal ofHindawi Publishing Corporation
http://www.hindawi.com Volume 2014 Journal of
Spectroscopy
Analytical Chemistry
Hindawi Publishing Corporation
http://www.hindawi.com Volume 2014
Journal of Hindawi Publishing Corporation
http://www.hindawi.com Volume 2014
Quantum Chemistry
Hindawi Publishing Corporationhttp://www.hindawi.com Volume 2014
International
Electrochemistry
International Journal ofHindawi Publishing Corporation
http://www.hindawi.com Volume 2014
Hindawi Publishing Corporation
http://www.hindawi.com Volume 2014