Artigo
*e-mail: [email protected]
ELECTRODEPOSITION OF GOLD FROM FORMALDEHYDE-SULFITE BATHS: BATH STABILITY AND DEPOSITS CHARACTERIZATION
Juliana L. Cardoso* e Sebastião G. dos Santos Filho
Escola Politécnica, Universidade de São Paulo, Av. Prof. Luciano Gualberto, 158, trav. 3, Bl. A, 05508-900 São Paulo - SP, Brasil
Recebido em 29/7/10; aceito em 18/11/10; publicado na web em 18/2/11
It was investigated Au(I)-sulite baths containing formaldehyde. As a result, high stability was achieved for baths containing formaldehyde concentration close to 10 mL L-1 with a lifetime superior to 600 days. On the other hand, cyclic voltammograms
indicated that the increase of formaldehyde concentration in the bath promotes decreasing of the maximum cathodic current, so that, if the formaldehyde concentration is high, the surface areal concentration of gold will be low. Also, the lowest surface roughness was obtained for 10 mL L-1 of formaldehyde.
Keywords: electrodeposition; formaldehyde; gold bath.
INTRODUCTION
Cyanide based gold baths have been widely used for gold plating, because of the high stability constant of cyanide with gold ([Au(CN)2]-, K
f = 38.3 mol L
-1 );1 although its toxicity.1 Non-cyanide
baths have been developed to overcome the problem of toxicity, most of them based on Au(I)-sulite complex.2,3-7 Different reducing
agents are commonly add to the Au(I)-sulite bath, as thiourea,5,6
hypophosphite,4,6 borohydride,6 dimethylamine borane (DMAB),6
hydrazine6 and formaldehyde.2,6,8 Redox potentials of all reducing
agents are negative, showing dependence with pH ranging from 4 to 14, except when thiourea is added to the bath.6,9
Au(I)-sulite baths can be unstable, due the low stability cons-tant of the Au(I)-sulite complex ([AuSO3]
-, K
f = 12.3 mol L -1;
[Au(SO3)2]3-, K
f = 26.8 mol L
-1),which may cause a disproportional
reaction from Au(I) to Au(III).1,3 However, the increase of the pH
makes Au(I)-sulite baths more stable since the amount of free sulite ions decreases.1
Formaldehyde has been used as additive in baths for electro- and electroless plating over the past decades8,10,11-14 because of its
electrocatalytic oxidation effect on various metals, including Pd, Ag, Au, Ni, Pt, Cu, and Ir, described by the following chemical equations:8,12
HCHO + 3 OH-→ HCOO- + 2 H 2O + 2 e
- (1)
or
HCHO + 4 OH-→ HCOO- + 3 H 2O + 2 e
- (2)
In addition, formaldehyde has been used as reducing agent in Au(I)-sulite baths8,10,12 for gold electroless deposition. Although
mixed deposition using gold electroless and electroplating reported on literature,15 details about bath stability and deposits characteristics
were not presented yet. Considering this lack, the purpose of this paper is to investigate the inluence of formaldehyde on the stability of Au(I)-sulite baths and its role on the growth characteristics of the electroplated gold.
EXPERIMENTAL
Baths were prepared from chemicals of analytical grade or better, and Milli-Q deionized water (18.2 MΩ cm), using anhydrous sodium sulite (Na2SO3), 35% formaldehyde (HCHO) solution and potassium tetrachlorourate (III) (KAuCl4). All baths were fresh, and a magnetic
stirrer was used for bath agitation. pH was measured using pHmeter (pHbanc II from Tekna).
Cyclic voltammetry was performed using a CV-50W potentiostat from BAS and a glass cell. All the experiments were performed at room temperature (25 ± 2 ºC). Prior to the measurements, nitrogen gas were bubbled through the bath during 30 min and, following, it was kept lowing near the bath surface. Potential was ranged from –100 to –1200 mV and was cycled 3 times at 1 mV s-1.
The employed working electrode was a metalized Si wafers with evaporated Ti and Au layers, 14.0 and 50.8 nm thick, respectively. The area of the working electrode exposed to the bath was 0.923 cm2,
delimited with tape (Scotch, 3M) and they were previously dipped in 1 HF (49%):20 H2O (d-HF) during 100 s and washed in deionized water (5 min). The counter-electrode was a Pt wire and the reference was an Ag/AgCl electrode (3 mol L-1 KCl).
The voltammograms were recorded for baths with 5 g L-1 of
KAuCl4 and 1, 10 or 100 mL L-1 of HCHO. Also, baths with 5 g L-1
of KAuCl4, 60 g L -1 of Na
2SO3 and 1, 10 or 100 mL L
-1 of HCHO
were prepared and analyzed.
Before the voltammetric measurements, baths containing gold and formaldehyde or baths containing gold, sulite and formaldehyde (1, 10 or 100 mL L-1), were prepared in a polypropylene ependorph and
stored for tests of stability. The analysis of the voltammograms were also based on the results obtained through a program for chemical equilibrium simulation (CHEAQS Pro).16
Electrodeposits of gold were obtained at -800 mVAg/AgCl during
30 min, before and after purge of 30 min with N2. The electrode-positions were performed with PalmSens from Ivrium Technology, during constant agitation.
deposited at the working electrode were discounted from the total areal concentration obtained from the RBS spectra. The surface rough-ness was obtained from RBS spectra through a Gaussian distribution, deined by the full width at half maximum (FWHM).17
In addition, proilometry was employed to evaluate the peak-valley surface roughness of CV samples and ield emission scanning electron microscopy (FESEM) was employed to evaluate the surface morphology of the electrodeposited ilms.
RESULTS AND DISCUSSION Stability
At irst, baths containing HCHO and KAuCl4 presented yellow
color and the time interval for precipitation decreased as the concen-tration of HCHO increased. As can be seen in Table 1, the bath with 100 mL L-1 of HCHO allowed one deposits with small amount of gold
on the wall of the ependorph after 5 days. In contrast, the bath with 10 mL L-1 of HCHO also allowed deposits with small amount of gold,
but only after 45 days. Finally, the bath with 1 mL L-1 of HCHO was
stable for 250 days. Therefore, addition of less than 1 mL L-1 HCHO
(35%) in a solution of KAuCl4 does not markedly change the grade in
which Au(I) remains complexed with chlorine at room temperature. On the other hand, addition of Na2SO3 to the KAuCl4 bath,
followed or not by the addition of HCHO, makes the bath colourless. The time interval for precipitation of these baths became 400 days for HCHO concentration of 1 mL L-1 and more than 600 days for
10 mL L-1. It should be caused due to the complexation of the sulite
by the HCHO.18 In this case, Au(I) complexes with sulite ions and
their excess also complexes with formaldehyde as shown by the following reaction:19
NaSO3 + HCHO + H2O H2COSO3H +OH
- (3)
Reaction 3 was corroborated by measuring pH before and after addition of sodium sulite in the bath (Table 1). In this case, pH varied from about 2.7-3.2 (before) to 8.3-13.0 (after). Also, it was noteworthy that the pH varied from 8.3 to 13.0 when formaldehyde concentration varied from 0 to 100 mL L-1, respectively, which is
predicted by the increase of the OH- concentration in reaction 3. In
addition, the complex molecules Au(I)-sulite and HCHO-sulite avoids the oxidation of sulite to sulfate in alkaline media, according to reaction 4 as follows:19,20
SO3
2- + 2 OH- SO 4
2- + H 2O + 2e
-, (4)
Despite the HCHO-sulite complexation (reaction 3), for higher formaldehyde concentrations (100 mL L-1), it was observed
sponta-neous precipitation of gold due to the electrocatalytic oxidation of the formaldehyde excess (reaction 1).
Voltammetry measurements
Since the bath containing Au salt and 100 mL L-1 HCHO is very
unstable, as mentioned before, cyclic voltammograms were extracted only for baths with 1 or 10 mL L-1 HCHO.
Simulations of ionic strength for solutions containing only KAu-Cl4 or KAuCl4 and Na2SO3 give values of 0.0314 and 0.886 mol L
-1,
respectively, which indicated that baths containing only KAuCl4
can present high ohmic drop. Indeed, this was observed for cyclic voltammograms recorded at 1 mV s-1 for Au electrode in a 5 g L-1
KAuCl4 bath in comparison with a 5 g L -1 KAuCl
4 + 60 g L -1 Na
2SO3
bath. In addition, the bath containing only KAuCl4 presented
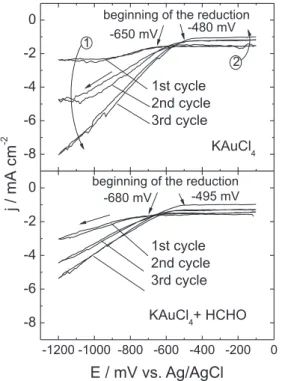
non-repetitive shapes with increasing cathodic current (at -1200 mVAg/AgCl)
from 2.2 to 8.0 mA cm-2 for sequential cycles in the range of -100
to -1200 mVAg/AgCl (Figure 1), possibly due to the inluence of ionic
strength changing during the cycles.21 As the ionic strength of the
5 g L-1 KAuCl
4 bath is low, the ionic strength may substantially
increase during the cycles what could be made responsible by the increase of the cathodic current (arrow 1 in Figure 1) and the decrease of the ohmic drop (arrow 2 in Figure 1). The beginning of the Au(I) reduction was obtained when the current density varied 50 µA cm-2
from the current base line in the cathodic region.
The reduction of gold (Figure 1) at the working electrode occured when the scanning potential overcomes –650 mVAg/AgCl at the irst
cycle, and this value decreased in the next cycles to a ixed value of approximately -480 mVAg/AgCl (beginning of the reduction). Initial
sur-face conditioning can be made responsible for this difference between the irst and the other cycles, this is to say, the surface concentration of active sites must have changed when surface gold, previously treated in d-HF, is introduced in the gold bath.22
A possible single step reaction of gold reduction is:19,20
AuCl2
- + e- Au + 2 Cl-, E0 = 1.15 V
H (5)
Adjusting the potential with the Nernst equation, considering the simulated chloride activity of 4.45 10-2 mol L-1, the simulated AuCl
2
-activity of 4.85 10-27 mol L-1 and the reference electrode potential
of 210 mVH, the potential of the reaction 5 became -453 mVAg/AgCl,
which is very close of the extracted value at the beginning of reduc-tion in Figure 1.
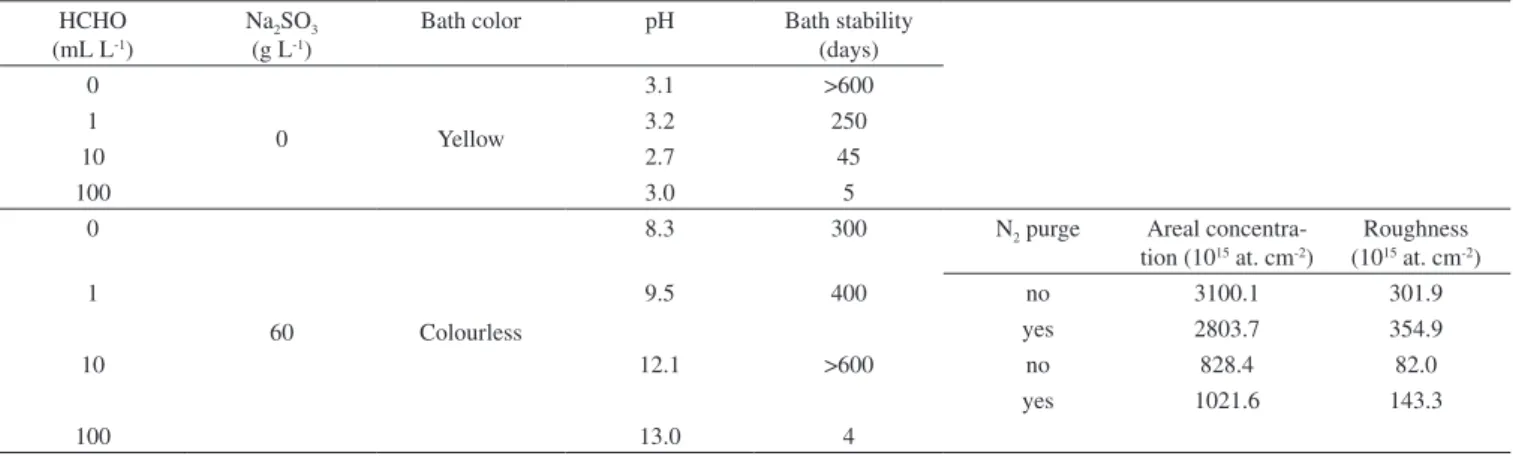
Table 1. Bath stability, color, pH, areal concentration and roughness of baths containing 5 g L-1 of KAuCl
4, used to evaluate HCHO and Na2SO3 concentration
or N2 purge inluences
HCHO (mL L-1)
Na2SO3
(g L-1)
Bath color pH Bath stability
(days) 0
0 Yellow
3.1 >600
1 3.2 250
10 2.7 45
100 3.0 5
0
60 Colourless
8.3 300 N2 purge Areal
concentra-tion (1015 at. cm-2)
Roughness (1015 at. cm-2)
1 9.5 400 no 3100.1 301.9
yes 2803.7 354.9
10 12.1 >600 no 828.4 82.0
yes 1021.6 143.3
The gold reduced during the irst cycle remains on the elec-trode surface during the anodic scanning. At potentials higher than –650 mVAg/AgCl, Au electroplating rate is very slow, while at potentials
lower than –650 mVAg/AgCl plating is possibly controlled by diffusion
(constant current levels). The deposited gold was rough (16 µm peak-valley roughness after the three cycles shown in Figure 1a) and porous, enlarging the electrode area and increasing the current density of the following cycles. A gas evolution was also observed as bubbles formed at the working electrode, indicating probably the evolution of H2.
The contribution of formaldehyde to the current density can be analyzed comparing the voltammograms of the Figure 1b. The irst cycle is very similar for both voltammograms. The area of the electrode from the bath without sulite ions increased, because of the rougher deposit associated to higher current density. The addition of formaldehyde has low inluence at the pH of the KAuCl4 bath, as
indicated in Table 1.
Formaldehyde induces decreasing of the electrodeposition cur-rent density. The addition to the bath of only Na2SO3 reduces the
roughness (4 µm peak-valley roughness after three cycles shown in Figure 1b) but the deposit is not as lat as with the presence of formaldehyde (600 nm peak-valley roughness after the three cycles). The Na2SO3 also changed the pH of this bath to alkaline values, as
already mentioned (Table 1).
The visual appearance of the electrode after cyclic voltammetry experiments changed drastically. Deposits obtained from bath con-taining only Au(I)-sulite complex are usually light yellow, but they are opaque. The addition of formaldehyde to this bath substantially improved the deposit characteristics (bright light-yellow deposits).
The addition of Na2SO3 to the bath changed the bath color from
yellow to colourless and the aspect of the voltammogram, as shown in Figure 2a, due to the complexation gold-sulite ([AuSO3]
- and
[Au(SO3)2]
3-).1 Now, the beginning of the reduction changes to
ap-proximately -600 mVAg/AgCl, possibly due to a different surface
con-ditioning promoted by sulite. Also, it is observed a cathodic peak, indicated by a dashed arrow at -950 mVAg/AgCl. This cathodic peak
suggests a diffusion limiting current,23 possibly due to reduction of
Au(I)-sulite complex ions.
On the other hand, the values of the achieved current density (at -1200 mVAg/AgCl) are ten times lower than that for the bath with
only KAuCl4 and HCHO. The complexation of sulite ion with Au(I)
decreases the content of free Au(I) and diminishes the current and deposition rate of metal. Possibly, the Au(I)-sulite complex, due its higher energetic barrier, decreased the maximum current density, which meant lower deposition rate and better quality of deposition to obtain a better deposit with high deposition rate.24
The adherence of deposits obtained from baths containing only KAuCl4 are poor (qualitatively evaluated using a sellotape), mainly
because of the high deposition rate. The addition of sodium sulite to the Au bath improves the adherence, which is kept after the addition of formaldehyde.
The inluence of oxygen in the solution containing gold, sulite and formaldehyde was also investigated. After purge, the voltammo-gram presented a slight improvement in the current density achieved at the peak, indicating that the presence of oxygen reduces the efi-ciency of gold deposition from this solution.
The addition of formaldehyde in the Au(I)-sulite solution reduces the maximum of current achieved during the voltammetry (Figure 3), which justify the decreasing of the areal concentration. The re-duction of the current permits a better control of the gold deposition, with deposits thinner and latter. The potential which the deposition begins are also changed, this is to say, they are approximately -570 and -740 mVAg/AgCl for 1 mL L
-1 and 10 mL L-1 of formaldehyde,
respectively.
RBS analysis and SEM images
Considering the results obtained through cyclic voltammetry, electrodepositions were carried out with the baths containing 5 g L-1
KAuCl4, 60 g L -1 Na
2SO3 and 1 and 10 mL L
-1 of HCHO, at -800
mVAg/AgCl during 30 min. This potential was elected because it is a
middle point between the base line and the cathodic peak in the voltammogram, which should avoid achieve any reduction reaction associated to the cathodic peak.
Figure 1. Cyclic voltammograms recorded at 1 mV s-1 for Au electrode in
5 g L-1 KAuCl
4 and, 5 g L -1 KAuCl
4 and 10 mL L
-1 HCHO
Figure 2. Cyclic voltammograms recorded at 1 mV s-1 for Au electrode in
5 g L-1 KAuCl
4 with 60 g L -1 Na
2SO3 and, 5 g L -1 KAuCl
4 with 60 g L -1 Na
2SO3
The values of areal concentration and roughness from all the samples obtained through RBS are in Table 1.
From the bath containing 1 mL L-1, the RBS results indicated that
the areal concentration of the deposit decreased with the N2 purge
and or the presence of O2 (without purge) contributes to improve
the deposition, increasing the areal concentration of the deposited layer. The roughness is lower for the deposit obtained before purge and higher after the purge, as indicated in Table 1, probably due to a change in the deposition rate, which was conirmed in the FESEM images of these deposits.
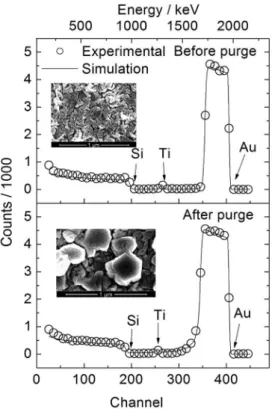
Figure 4 presents the RBS results for the bath containing 10 mL L-1. The increase in the HCHO concentration decreased the
areal concentration achieved in the deposits, around 3.2 times com-pared to the bath containing 1 mL L-1 of HCHO and the roughness
was also reduced.
FESEM images of the deposits from solution containing 10 mL L-1
of HCHO are shown in Figure 4. The deposit aspect before the purge is latter, however, after the purge, the current density increased, and whiskers were observed on the surface (Figure 4b). The formation of whiskers is a typical indicator of the increase of the current density.25
In this case, the current achieved after purge in N2 should be closer
to the limiting current for whisker formation.25 In addition, whiskers
were also observed for baths containing 1 mL L-1 due to higher current
density (before and after purge) at -800 mVAg/AgCl.
CONCLUSION
It was investigated the inluence of formaldehyde on the stability of Au(I)-sulite baths and its role on the growth characteristics of the electroplated gold. The most stable gold bath was obtained for 10 mL L-1 of formaldehyde,5 g L-1 of KAuCl
4 and 60 g L -1 of Na
2SO3,
without any precipitation for time intervals higher than 600 days. That superior lifetime is possibly due to the additional complexation of formaldehyde with sulite ions in the baths.
From cyclic voltammograms (CV), it was observed for KAuCl4-only or KAuCl4-Na2SO3 baths that the higher the
concentra-tion of both formaldehyde and dissolved O2, the lower the
electrodepo-sition current density and, the thinner and the latter are the deposits. In addition, RBS analysis revealed that the thinnest and the lattest deposits were obtained for baths containing 10 mL L-1 of
formaldehy-de, 5 g L-1 of KAuCl
4 and 60 g L -1 of Na
2SO3 and FESEM images
showed that the nitrogen purge of the bath promotes the appearance of “whiskers” on the surface of the deposits, which can be made responsible for the increase of the surface roughness.
ACKNOWLEDGMENTS
We are grateful to FAPESP (proc. 07/01336-1) and CNPq (proc. 140627/07-3 and proc. 140304/10-0) for the inancial support. REFERENCES
1. Green, T. A.; Roy, S.; J. Electrochem. Soc.2006, 153, C157.
2. Zhang, X.; Li, D.; Bourgeois, L.; Wang, H.; Webley, P. A.; Chem. Phys.
Chem.2009,10, 436.
3. Osaka, T.; Okinaka, Y.; Sasano, J.; Masaru, K.; Sci. Technol. Adv. Ma-Technol. Adv. Ma-ter. 2006, 7, 425; Weisberg, A. M.; Products Finishing 1997, 61, 180; Wilkinson, P.; Gold Bulletin 1986, 19, 75.
4. Kato, M.; Sato, J.; Otani, H.; Homma, T.; Okinaka, Y.; Osaka, T.; Yoshioka, O.; J. Electrochem. Soc.2002, 149, C164.
5. Sato, Y.; Osawa, T.; Kaieda, K.; Kabayakawa, K.; Plat. Surf. Finish.
1994, 81, 74.
6. Inoue, T.; Ando, S.; Okudaira, H.; Ushio, J.; Tomizawa, A.; Takehara, H.; Shimazaki, T.; Yamamoto, H.; Yokono, H.; 45th Electronic Components
and Technology Conference, Las Vegas, USA, 1995.
7. Honma, H.; Hasegawa, A.; Hotta, S.; Hagiwara, K.; Plat. Surf. Finish.
1995, 82, 89.
8. Menon, V. P.; Martin, C. R.; Anal. Chem.1995, 67, 1920. 9. Annex I of Directive 67/548/EEC, 1967.
10. Bulovas, A.; Talaikyte, Z.; Niaura, G.; Kazemekaite, M.; Marcinkeviciene, L; Bachmatova, I.; Meskys, R.; Razumas, V.; Chemija
2007, 18, 9.
11. Sun, S.-G.; Lu, G.-Q.; Tian, Z.-W.; J. Electroanal. Chem.1995, 393, 97; Olivi, P.; Bulhões, L. O. S.; Léger, J.-M.; Hahn, F.; Beden, B.; Lamy,
C.; J. Electroanal. Chem.1994, 370, 241; Beltowska-Brzezinska, M.;
Heitbaum, J.; J. Electroanal. Chem.1985, 183, 167.
12. Díaz, D. J.; Williamson, T. L.; Guo, X.; Sood, A.; Bohn, P. W.; Thin Solid Films2006, 514, 120.
Figure 3. Cyclic voltammograms recorded at 1 mV s-1 for Au electrode after
30 min N2 purge, for solution containing 5 g L -1 KAuCl
4 and 60 g L -1 Na
2SO3,
and after addition of 1 mL L-1 formaldehyde and 10 mL L-1 formaldehyde
Figure 4. RBS spectrum and FESEM surface images of electrodeposits
obtained from electrodeposition at -800 mVAg/AgCl during 30 min in 5 g L -1
KAuCl4, 60 g L
-1 Na
2SO3 and 10 mL L
-1 formaldehyde, before and after N
2
13. Sun, W.; Sun, G.; Qin, B.; Xin, Q.; Sens. Actuators, B2007, 128, 193; Ballarini, N.; Cavani, F.; Maselli, L.; Passeri, S.; Rovinetti, S.; J. Catal.
2008, 256, 215; Watanabe, H.; Abe, S.; Honma, H.; J. Appl. Electro-chem.1998, 28, 525.
14. Arai, S.; Funaoka, Y.; Kaneko, N.; Shinohara, N.; Electrochemistry2001, 69, 319.
15. Ohno, I.; Mater. Sci. Eng.1991, A146, 33.
16. Verweij, W.; http://home.tiscali.nl/cheaqs/, accessed October 2010. 17. Mayer, M.; SIMNRA, Max-Planck-Institut für Plasmaphysik: Garching,
1997.
18. Perrin, D. D.; Organic complexing reagents: structure, behavior, and
application to inorganic analysis, R. E. Krieger Pub. Co.: New York,
1978.
19. Kiryushov, V. N.; Skvortsova, L. I.; Russ. J. Appl. Chem.2005, 78, 552. 20. Dean, J. A.; Lange’s Handbook of Chemistry, 15th ed., McGraw-Hill:
New York, 1999.
21. Hamelin, A.; J. Electroanal. Chem.1996, 407, 1.
22. Lei, H.-W.; Uchida, H.; Watanabe, M.; Langmuir1997,13,3523; Ignaczak, A.; Gomes, J. A. N. F.; J. Electroanal. Chem.1997, 420,71. 23. Kissinger, P. T.; Heineman, W. R.; J. Chem. Educ. 1983, 60, 702. 24. Dini, J. W.; Electrodeposition: The Materials Science of Coatings and
Substrates, Noyes Publications: Park Ridge, 1993.