ARTIGO ORIGINAL
The Effect of Changing Regular Care Provider in Type 2
Diabetes Mellitus: A Retrospective Study
O Impacto da Mudança de Médico Assistente
na Diabetes Mellitus Tipo 2: Um Estudo Retrospectivo
Francisco SOUSA SANTOS1, Carlos TAVARES BELLO1, Catarina ROQUE1, Ricardo CAPITÃO1, Ricardo CASTRO FONSECA1, Clotilde LIMBERT1, João SEQUEIRA DUARTE1, Manuela OLIVEIRA1, Carlos VASCONCELOS1
Acta Med Port 2019 Sep;32(9):580–587 ▪ https://doi.org/10.20344/amp.11304
1. Departamento Endocrinologia. Hospital Egas Moniz. Centro Hospitalar de Lisboa Ocidental. Lisboa. Portugal. Autor correspondente: Francisco Sousa Santos. [email protected]
Recebido: 19 de setembro de 2018 – Aceite: 09 de abril de 2019 | Copyright © Ordem dos Médicos 2019 ABSTRACT
Introduction: Several studies have demonstrated the benefits of having a regular care provider on the control of chronic diseases. Our study intends to clarify the effects of the transition to a new diabetologist on metabolic control in type 2 diabetes patients followed-up in a tertiary care setting.
Material and Methods: Retrospective study performed in an endocrinology outpatient clinic. We randomly selected 50 type 2 diabetes patients for a control group and 50 for a study group. In the study group, we registered the last evaluation before the physician change (year 0) and at the end of each year (year 1, 2 and 3) with the new doctor. Evaluated variables — body mass index, blood pressure, HbA1c and lipid profile — were compared yearly between groups.
Results: There was a decrease in mean HbA1c levels (0.4% – 0.5%, p < 0.05) in year 1 and 2 when compared to year 0 in the study group, but not in the control group. This reduction was superior (0.5% – 1.4%, p < 0.05) in patients whose baseline HbA1c was greater than 7%. The other studied variables did not vary significantly throughout follow-up in either group.
Discussion: In our study the transition to a different type 2 diabetes physician was associated with a decrease in mean HbA1c and this difference was greater in less well controlled patients.
Conclusion: Switching to a new physician may not be harmful and may actually have benefits for the glycemic control of some type 2 diabetes patients.
Keywords: Continuity of Patient Care; Diabetes Complications; Diabetes Mellitus, Type 2; Patient Care Team
RESUMO
Introdução: Vários estudos já demonstraram ser benéfico para o controlo de várias doenças crónicas manter seguimento com um mesmo médico assistente de forma prolongada. O nosso estudo pretende esclarecer os efeitos no controlo da doença associados à transição para um novo médico diabetologista em doentes diabéticos tipo 2 seguidos em cuidados de saúde terciários.
Material e Métodos: Estudo retrospetivo realizado num serviço de consultas externas de Endocrinologia. Seleccionámos aleatoria-mente 50 doentes diabéticos tipo 2 para um grupo controlo e 50 para um grupo estudo. No grupo estudo, registámos a última avaliação antes da mudança de médico (ano 0) e no fim de cada ano (ano 1, 2 e 3) com o novo médico. As variáveis avaliadas — índice de massa corporal, tensão arterial, HbA1c e perfil lipídico — foram comparadas anualmente entre os grupos.
Resultados: Verificou-se uma diminuição na média da HbA1c (0,4% – 0,5%, p < 0,05) no ano 1 e 2 por comparação com o ano 0 no grupo estudo, mas não no grupo controlo. Esta redução foi maior (0,5% – 1,4%, p < 0,05) em doentes cuja HbA1c basal era superior a 7%. As outras variáveis estudadas não variaram significativamente em qualquer um dos grupos.
Discussão: Neste estudo, a transição de doentes diabéticos tipo 2 para um novo médico diabetologista assistente associou-se a uma diminuição na média de HbA1c, de forma mais marcada em doentes com menor controlo metabólico.
Conclusão: A mudança para um novo médico diabetologista assistente pode não ser prejudicial e inclusivamente associar-se a bene-fícios para o controlo glicémico de alguns doentes diabéticos tipo 2.
Palavras-chave: Complicações da Diabetes; Continuidade de Cuidados ao Doente; Diabetes Mellitus Tipo 2; Equipa de Cuidados aos Doente
INTRODUCTION
Type 2 diabetes (T2D) is a highly prevalent chron-ic disease associated with an increased cardiovascular risk. Adequate risk factor control such as blood glucose, low-density lipoprotein cholesterol (cLDL), blood pressure (BP) and weight is important in order to prevent various dis-ease complications, being therefore recommended by sev-eral international clinical practice guidelines.1–4
While recent technological advances have contributed greatly to a better pathophysiological disease knowledge, the impact of the human aspect of medical care and the importance of the doctor-patient relationship are still poorly understood. Several studies have suggested that continuity
of care, defined as follow-up by the same health care pro-vider for a period of time, can have a positive impact on the control of various chronic diseases such as asthma and hypertension, besides increasing patient satisfaction.5–8 A recent systematic review (including specialist and gen-eralist clinicians) also found continuity of care to be asso-ciated with lower mortality.9 Regarding T2D, most available studies were carried out in the primary care setting and results diverge. Some studies suggest that maintaining a regular provider offers various benefits such as — more adequate monitoring and disease complication screening; improved medication adherence; better glycemic control and decreased mortality and hospitalization rates — while
ARTIGO ORIGINAL
others show similar results in patients with no steady pro-vider.6,10–14 In theory, the development of a long-term rela-tionship between physician and patient should lead to a better understanding and communication. Nevertheless, in clinical practice, one could argue that changing to a differ-ent provider could sometimes have a beneficial effect due to the introduction of different approaches and perhaps increase in patient motivation, at least for a certain period of time. There is little data on whether physician continuity is superior to care site continuity by itself, although a study using data from the Third National Health and Nutrition Examination Survey database suggested that having a usual provider was not superior to just having a usual site of care.11
To the best of our knowledge there is no published data regarding T2D patients who transitioned from one care pro-vider to another in the same care site. Our work aims to clarify the effects on the control of diabetes (and its associ-ated conditions) of transitioning from an established regular diabetes care provider (an Endocrinology physician) to a new one in a sample of adult patients with T2D in a tertiary care setting.
MATERIAL AND METHODS
We performed a retrospective, observational study including patients followed-up in the Endocrinology depart-ment outpatient clinic of a Lisbon Central University Hospital because of T2D for at least five years with the same phy-sician. We compared patients who, after this initial time period, changed their regular physician (study group) with patients who did not (control group).
For the study group (SG) we randomly selected 50 patients who transitioned to a different physician in the same department (all of them because the initial doctor left the department, due to various reasons) between 2012 and 2016. Patients included in the control group (CG) (n = 50) were randomly selected from a pool of patients (followed by one of three clinicians — selected because they had com-plete recorded data) who did not change their regular dia-betes physician between 2012 and 2016. Baseline evalua-tion was established as year 0 — the year before changing physician in the SG or equivalent in the CG — and this was between 2011 and 2014 in both groups. For patients in the CG, we assigned the year to be considered year 0 in order to match the number of civil years seen in the SG as year 0 – 2011: 17 patients; 2013: 7 patients; 2014: 26 patients, in either group.
Complete clinical, demographic and laboratory data available from all patients was reviewed and the diagnosis of T2D was confirmed (according to the criteria of America Diabetes Association) in each case.3 Additionally, other diag-noses were sought: hypertension (patients on antihyperten-sive medication or with at least two sitting blood pressure measurements in at least two appointments above 140/90 mmHg), dyslipidemia (patients treated with antidyslipidemic medication, total cholesterol above the laboratory reference range (200 mg/dL) or LDL-cholesterol above treatment
targets), microvascular diabetic complication (presence of at least one of the following: diabetic retinopathy, diabetic nephropathy or diabetic neuropathy — as coded by the phy-sician) and macrovascular diabetic complication (presence of at least one of the following: peripheral artery disease; coronary artery disease or cerebrovascular disease — as coded by the physician).15 Patients were also characterized in the first assessed appointment according to their age and diabetes duration.
Evaluated parameters in each appointment included: body mass index (BMI — body mass in kilograms divided by the square of the body height in meters); sitting blood pres-sure (as meapres-sured in mmHg in the physician office); num-ber of antidiabetic, antihypertensive and antidyslipydemic drugs; number of daily insulin administrations and total daily dose (as reported by the patient); estimated glomerular fil-tration rate (eGFR) (according to CKD-EPI formula); fasting lipid profile [LDL cholesterol (cLDL), as calculated by the Friedewald formula] and HbA1c (as measured by the hospi-tal laboratory).16,17 We evaluated these different variables at the last appointment before the physician change or equiv-alent in the CG (year 0) and by the end of each complete year with the new clinician or equivalent in the CG (year 1, year 2 and year 3).
All data was collected from the Endocrinology-Diabetes registry and the patient’s clinical records. Given this was a retrospective study and that the analysis of data was anonymous, Ethical Committee approval was not consid-ered required. Nevertheless all the procedures were done according to the rules provided by the instituitions Ethical Comitee and to the Declaration of Helsinki.
Statistical analysis
Results for continuous variables are presented as mean and standard deviation in case of an approximately normal distribution or median and first (Q1) and third (Q3) quar-tiles if otherwise. In order to compare mean values between SG and CG we used the independent sample t-test, after confirming continuous variables as approximately follow-ing a normal distribution. To compare in each group the yearly evaluation with the baseline evaluation we used the paired sample t-test in the case of an approximately nor-mal distribution and more than 30 patients considered or the Wilcoxon signed-rank test if otherwise. We considered statistically significant results if p - value was < 0.05. IBM SPSS Statistics v.25 was the utilised software.
RESULTS
Baseline patient characteristics (Table 1)
A total of 100 patients were included — 50 in the CG and 50 in the SG. In the CG, there were 50 patients who had recorded follow-up in year 1; 38 had recorded year 1 and 2 and 27 had year 1, 2 and 3. In the SG, 50 patients had recorded follow-up in year 1; 33 had recorded year 1 and 2 and 18 had year 1, 2 and 3.
There was a non-significant difference in the percentage of male patients between both groups (54% in the SG vs
ARTIGO ORIGINAL Table 1 – Comparison of patient characteristics between the control group and study group, as considered in year 0Control group Study group p value
Age (years) 67.2 ± 10.4 69.2 ± 10.6 0.352
Gender (male) 36% 54% 0.070
Diabetes duration (years) 21.6 ± 10.3 20.2 ± 13.3 0.551
Diabetic macrovascular complications 42.0% 36.0% 0.539
Diabetic microvascular complications 78.0% 50.0% 0.004*
Hypertension 96.0% 90.0% 0.240
Dyslipidemia 94.0% 78.0% 0.021*
Therapeutic non-compliance 14.0% 18.0% 0.585
Insulin therapy 64% 54% 0.309
Total daily insulin dose (units) 18.0 [Q1 = 0; Q3 = 48.5] 16.0 [Q1 = 0; Q3 = 34.5] 0.212
Number of daily insulin injections 1.4 ± 1.4 1.0 ± 1.2 0.157
Number of daily antidiabetic drugs 1.8 ± 1.0 1.9 ± 1.0 0.433
Number of daily antihypertensive drugs 2.3 ± 1.5 2.2 ± 1.6 0.742
Number of daily antidyslipidemic drugs 0.8 ± 0.6 0.9 ± 0.6 0.871
HbA1c (%) 7.6 ± 1.3 7.5 ± 1.4 0.631 cLDL (mg/dL) 83.9 ± 22.4 84.8 ± 32.6 0.874 eGFR (mL/min/1.73 m2) 62.8 ± 21.2 62.7 ± 20.9 0.964 BMI (kg/m2) 32.6 ± 7.2 29.4 ± 4.5 0.011* SBP (mmHg) 141.8 ± 23.2 145.7 ± 23.7 0.416 DBP (mmHg) 73.2 ± 11.9 73.4 ± 12.8 0.925
Continuous variables presented as mean ± standard deviation in case of an approximately normal distribution and median [Q1; Q3] if otherwise. cLDL: LDL cholesterol; eGFR: estimate glomerular filtration rate; BMI: body mass index; SBP: systolic blood pressure; DBP: diastolic blood pressure. * p < 0.05
36% in the CG, p = 0.070). The mean age (67.2 years in the CG vs 69.2 in the SG, p = 0.352) and diabetes duration (21.6 years in the CG vs 20.2 in the SG) did not significantly differ between the two groups. Regarding diabetic compli-cations, there was a higher incidence of microvascular (78% vs 50%, p = 0.004) complications in the CG. No statistically significant differences were found between groups regard-ing the incidence of macrovascular complications between CG and SG (42% vs 36%, p = 0.539). Lack of therapeutic compliance was mentioned in 14% of patients in the CG and 18% of the SG (p = 0.585).
Studied variables
Applying a paired sample t-test/ Wilcoxon signed-rank test, comparing the various follow-up years with the base-line year (year 0) we obtained the following results:
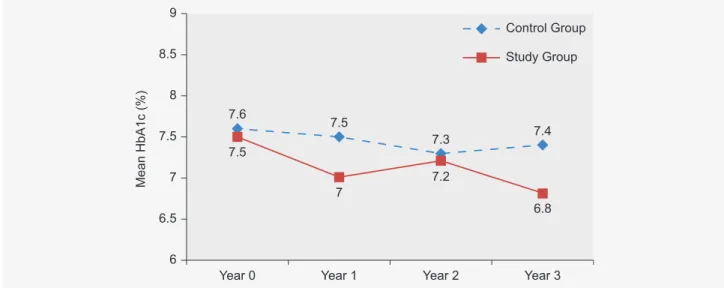
• HbA1c (%): No statistically significant difference was
found in the CG after comparing year 0 with year 1 (7.6 vs 7.5, p = 0.479), year 2 (7.5 vs 7.3, p = 0.341) or year 3 (7.5 vs 7.4, p = 0.522). In the SG, there was a statistically significant reduction in mean HbA1c levels when comparing year 0 with year 1 (7.5 vs 7.0, p = 0.028) and year 2 (7.6 vs 7.2, p = 0.017), but not year 3 (7.3 vs 6.8, p = 0.127). The percentage of patients with HbA1c < 7% increased in every follow-up year in the CG (year 0 = 38%; year 1 year 2 = 60%; year 3 = 86%).
Considering only patients whose HbA1c was > 7% at
the year 0 evaluation, HbA1c difference was greater in the SG (n = 28 vs n = 31 in the CG) comparing year 0 with each subsequent year: year 1 – 8.4 vs 7.2, p < 0.001; year 2 – 8.2 vs 7.5, p = 0.001 and year 3 – 8.2 vs 6.8, p = 0.005.
When comparing patients who changed physician and who had therapeutic non-compliance registered (9 patients) with those who did not (41 patients): the former did not show statistically significant improvements in HbA1c (8.3 vs 7.4, p = 0.155) while the latter improved their HbA1c with statistical significance (7.3 vs 6.9, p = 0.011) — comparing Year 0 with the last recorded year.
• cLDL (mg/dL): In the CG, we only observed
statis-tically significant improvements when comparing year 0 and year 3 (89.7 vs 79.0, p = 0.018), while changes in the other years did not reach significance: year 1 (85.8 vs 85.2, p = 0.871) and year 2 (88.1 vs 79.1, p = 0.100). In the SG, we did not observe any statistically significant reduction when comparing year 0 with year 1 (85.8 vs 79.1, p = 0.062), year 2 (87.1 vs 77.8, p = 0.083) or year 3 (83.5 vs 81.9, p = 0.728).
• BMI (kg/m2): We found minimal and statistically
non-significant reductions in BMI in the CG when compar-ing year 0 with each follow-up year: year 1 – 32.6 vs 32.4, p = 0.305; year 2 – 32.5 vs 32.2, p = 0.431; year 3 – 32.3 vs 32.3, p = 0.957. In the SG we found a statistically significant decrease in BMI during follow-up when comparing year 2 with year 0 (29.2 vs 30.0, p = 0.022) but not year 1 (29.6
ARTIGO ORIGINAL
vs 29.8, p = 0.164) or year 3 (28.9 vs 29.9, p = 0.147) with year 0.
• SBP (mmHg) and DBP (mmHg): We did not find any
statistically significant changes in SBP or DBP in either group after comparing each follow-up year with year 0. Regarding SBP, in the CG the comparison was as follows: year 0 vs year 1 – 141.8 vs 143.6, p = 0.551; year 0 vs year 2 – 145.6 vs 140.8, p = 0.072; year 0 vs year 3 – 145.3 vs 144.6, p = 0.840. In the SG the results were: year 0 vs year 1 – 145.5 vs 140.3, p = 0.109; year 0 vs year 2 – 152.0 vs 143.5, p = 0.055; year 0 vs year 3 – 147.9 vs 141.4, p = 0.157.
Regarding DBP, in the CG the comparison was: year 0 vs year 1 – 73.2 vs 73.2, p = 0.898; year 0 vs year 2 – 73.5 vs 71.0, p = 0.121; year 0 vs year 3 – 75.7 vs 74.9, p = 0.667. In the SG the results were: year 0 vs year 1 – 73.1 vs 70.5, p = 0.145; year 0 vs year 2 – 77.3 vs 76.8, p = 0.814; year 0 vs year 3 – 76.5 vs 77.1, p = 0.856.
Comparison of the mean of each of these variables in each follow-up year between the CG and SG are presented in Figs. 1, 2, 3, 4 and 5.
Characteristics in the last recorded year
In the last evaluated year, when compared with the baseline (year 0), we noticed an increase in the percentage of patients receiving insulin therapy in the SG (54% vs 66%, p < 0.01), although no significant differences were found regarding the median insulin total daily dose (16 units in both instances). In the CG the percentage of patients on insulin therapy remained the same (64% of patients) as well as the mean insulin total daily dose (18.0 vs 22.5 units, p = 0.929). The mean number of different daily antidiabetic, antihypertensive and antidyslipidemic drugs remained sim-ilar in the SG and the CG [1.8 vs 1.9 (p = 0.851), 2.3 vs 2.7 (p = 0.182) and 1.0 vs 0.9 (p = 0.634), respectively].
Table 2 – Comparison of patient characteristics between the control group and the study group, as considered in the last recorded follow-up year
Control group Study group p value
Insulin therapy 64% 66% 0.309
Total daily insulin dose (units) 22.5 [Q1 = 0; Q3 = 48.5] 16 [Q1 = 0; Q3 = 41.2] 0.656
Number of daily insulin injections 1.4 ± 1.4 1.3 ± 1.3 0.657
Number of daily antidiabetic drugs 1.8 ± 1.0 1.9 ± 1.1 0.851
Number of daily antihypertensive drugs 2.7 ± 1.3 2.3 ± 2.4 0.182
Number of daily antidyslipidemic drugs 0.9 ± 0.6 1 ± 0.7 0.634
HbA1c (%) 7.4 ± 1.4 7.0 ± 1.1 0.083 cLDL (mg/dL) 80.1 ± 24.4 79.3 ± 27.8 0.879 eGFR (mL/min/1.73 m2) 59.3 ± 19.6 57.3 ± 24.2 0.654 BMI (kg/m2) 32.6 ± 7.1 29.0 ± 4.5 0.006* SBP (mmHg) 142.2 ± 19.4 140.1 ± 19.5 0.590 DBP (mmHg) 72.3 ± 10.6 73.4 ± 12.6 0.659
Continuous variables presented as mean ± standard deviation in case of an approximately normal distribution and median [Q1; Q3] if otherwise. cLDL: LDL cholesterol; eGFR: estimate glomerular filtration rate; BMI: body mass index; SBP: systolic blood pressure; DBP: diastolic blood pressure. * p < 0.05
Year 0 Year 1 Mean HbA1c (% ) 6 6.5 7 7.5 8 8.5 9 7 7.5 7.6 7.5 7.2 7.3 6.8 7.4 Year 2 Year 3 Study Group Control Group
ARTIGO ORIGINAL Year 0 Year 1 Mean HbA1c (% ) 6 6.5 7 7.5 8 8.5 9 7.2 8 8.4 8.3 7.5 7.6 6.8 7.7 Year 2 Year 3 Study Group Control Group
Figure 3 – Comparison of mean cLDL (mg/dL) between the control group and the study group throughout follow-up
Figure 4 – Comparison of mean BMI (Kg/m2) between the control group and the study group throughout follow-up
Year 0 Year 1 Mean cLDL (mg/dL) 74 76 78 80 82 84 86 81.7 82.5 8.4 8.3 77.8 80 79.7 84.3 Year 2 Year 3 Study Group Control Group
Figure 2 – Comparison of mean HbA1c (%) between the control group (n = 31) and the study group (n = 28) throughout follow-up, consid-ering patients with HbA1c > 7% in year 0
Year 0 Year 1 Mean BMI (Kg/m2) 26 27 28 29 30 31 32 33 29.2 32.4 32.6 29.4 28.8 32.2 28.4 32.3 Year 2 Year 3 Study Group Control Group
ARTIGO ORIGINAL
The only evaluated clinical/biochemical variable that demonstrated a statistically significant difference between groups was BMI, which was lower in the SG – 32.6 vs 29.0, p = 0.006. In the CG 12% of patients abandoned follow-up at some point, whereas in the SG only 8% was lost to fol-low-up. Only one death was recorded — one patient includ-ed in the CG.
DISCUSSION
A sustained patient-physician connection with the devel-opment of an interpersonal trust relationship is thought to be important for the optimal management of patients with chronic diseases and this is one justification for the persis-tence of continuity of care models. Various studies have investigated the benefits of continuity of care (mostly in the primary care setting) in T2D patients but results have been mixed.6,10,11 It‘s not clear whether a regular site of medical care may provide the same benefits as having a regular physician.11,18 To the best of our knowledge there is no pub-lished data on the effects of transitioning from one regular diabetes main care provider to another in the same continu-ity of care setting.
Our study aimed to clarify the short/medium term effects on the control of T2D associated with the transition from one regular diabetes care provider to a new one in a ter-tiary care setting. As such we randomly selected a sample of T2D patients followed at the Endocrinology-Diabetes out-patient clinic of a Portuguese central hospital between 2011 and 2014 who subsequently either changed their personal diabetes physician — SG — or maintained the same provid-er for more than 5 years — CG.
Patients who changed their diabetes care provider showed improvements in their mean HbA1c levels in the first two completed years of follow-up with the new physi-cian — 0.4% – 0.5% of HbA1c — and this result was even better when considering only patients with HbA1c > 7% in the baseline evaluation (decrease of mean HbA1c of
0.5% – 1.4% which reached statistical significance in year 1, 2 and 3). In fact, in the SG, mean HbA1c concentration was below 7% by the end of the last evaluated year — year 3. In contrast, patients in the CG did not experience a statistically significant reduction of their mean HbA1c. The percentage of patients who intensified antihypergly-cemic therapy with insulin increased throughout the fol-low-up period in the SG but not in the CG and this is one possible explanation for this difference. Treatment inertia, defined as the failure to change or up titrate treatment when a disease is uncontrolled, has been documented in multiple settings as a cause for underachieved glycemic targets in T2D.19 Although it can be argued that HbA1c targets should be individualized and that hypoglycemic events were not accounted, it is interesting to notice that in fact a greater proportion of patients achieved HbA1c levels of less than 7% in the SG and this could further raise the suspicion of some treatment inertia in the CG. One could also speculate that perhaps after medium/long term follow-up with a single care provider, changing to a new one could introduce some newfound motivation and therapeutic approaches which could ultimately help the patient further achieve an optimal metabolic control. Better assessment of patient satisfaction, motivation and therapeutic adherence scores would be interesting to clarify this matter. In fact, there was a differ-ence in the HbA1c change between patients who changed physician and had therapeutic non-compliance registered and those who did not — the former did not improve their HbA1c significantly while the latter showed statistical signif-icant improvement (decreased by 0.4%) when comparing year 0 and the last recorded year. Nevertheless, another factor to consider is the frequency of vascular complications which was greater in the CG and this could have contribut-ed to a lesser intensification of the therapeutic regimen (and ultimately worse results) than in the SG.
Effects in the other studied variables (cLDL, BMI and blood pressure) were less pronounced in either group
Figure 5 – Comparison of mean systolic blood pressure (SBP) and diastolic blood pressure (DBP) (mmHg) between the control group and the study group throughout follow-up
Year 0 Year 1 Blood Pressure (mmHg) 60 70 80 90 100 110 120 130 140 150 73 70.6 143.6 139.7 141.8 145.7 73.4 73.2 76.6 71 142.6 140.8 76.1 74.9 144.6 141 Year 2 Year 3 Study Group SBP Control Group SBP Control Group DBP Study Group DBP
ARTIGO ORIGINAL although we did not identify worsening of any of these parameters when comparing the baseline assessment with any of the yearly evaluations. One possible global expla-nation is that clinicians had their focus on achieving a bet-ter control of the glycemic profile rather than improving other cardiovascular risk factors. However, this hypothesis lacks investigation.
Blood pressure measurements are highly dynamic and subject to various interfering factors in everyday practice and so the individual evaluations performed in each of the considered clinical consultations are difficult to interpret correctly. Nevertheless, patients in either group remained with mean levels close to the goals proposed in the 2018 Standards of Medical Care by the American Diabetes Association (ADA) for most patients with T2D (systolic blood pressure < 140 and diastolic blood pressure < 90 mmHg).3
LDL cholesterol concentration is one of the treatment targets in T2D management, especially with established atherosclerotic cardiovascular disease, with a recently proposed European Society of Cardiology and European Atherosclerosis Society target of cLDL < 70 mg/dL, although objectives have varied throughout the years.15 We did not find any statistically significant changes in mean cLDL levels throughout follow-up in the SG. The fact that treatment goals should be tailored taking into account other cardiovascular risk factors and that a minority of patients had macrovascular complications, could possibly mean that indeed these patients were well controlled throughout the analysed follow-up period and so there was no need to opti-mize treatment. Interestingly, the only significant improve-ment was observed when comparing year 0 and year 3 in the CG and we could speculate if this could perhaps be a sign of the growing availability of more effective lipid-lower-ing drugs.
Regarding BMI, we found a statistically significant change (a 0.8 Kg/m2 decrease in its mean value) when comparing year 0 and year 2 in the SG, but not in the CG or in any other yearly comparison. This data does not seem conclusive, but one could speculate, however, whether die-tary and lifestyle modifications were perhaps more mean-ingfully achieved, even if only for a period of time, in the group of patients that were allocated a different physician given how the mean daily insulin dose and number of antidi-abetic drugs remained the same. This hypothesis is some-thing that should be further investigated.
We acknowledge some problems with our methodology. First, the sample size, especially the number of patients with evaluations in year 2 and year 3 after the baseline evalua-tion, was rather small. Second, we only evaluated patients, at most, 3 years after the baseline and this could be a rela-tively small period to fully conclude about the effects of the change in provider or how long there is some difference. Third, in the CG we included patients followed by one of three physicians (selected due to having complete record-ed data), while in the SG patients transitionrecord-ed from one of four to one of five new physicians and neither of these were
those included in the CG. It can be hypothesized that per-haps with different providers, different results would have been obtained and that the real difference lies in the chosen physicians rather than the change by itself, however this issue remains difficult to address with this study design. It should also be said that while most of available studies on continuity of care were performed in primary care setting, ours was done in tertiary care and so our results should not be extrapolated to these other sites of care. Finally, we did not register cardiovascular events that occurred during the evaluated period and this is one of the most important outcomes to measure in T2D patients rather than only addressing risk factors.
CONCLUSION
Despite our methodological issues, our study suggests that, in a tertiary care setting, transitioning from a long-term diabetes care provider to a new one does not seem harmful on a short-medium term basis, regarding T2D disease con-trol. Furthermore, an improvement in glycemic control was observed in patients (particularly those with a sub-optimal glycemic control) who changed their provider, although this is something that should merit further investigation to con-firm and clarify which factors are contributing. The establish-ment of a long-term physician-patient relationship seems important in the case of chronic diseases. Our study seems to argue that perhaps some therapeutic inertia can grow with the duration of follow-up and that maybe the change in physician can introduce new motivation or therapeutic strat-egies that can ultimately have a positive impact in disease control. While our results raise an interesting hypothesis, for now it seems that evidence is still too scarce to suggest changing regular care provider in case of sub-optimally con-trolled T2D patients.
PROTECTION OF HUMANS AND ANIMALS AND DATA CONFIDENTIALITY
The authors declare that all the procedures of this study were done according to the rules provided by the Ethical Comitee (“Comissão de Investigação Clínica e Ética”) of our institution and to the Declaration of Helsinki.
DATA CONFIDENTIALITY
The confidentiality and privacy of the data were guar-anteed according to the Declaration of Helsinki regarding patients’ data publication.
CONFLICTS OF INTEREST
The authors certify that there is no conflict of interest with any financial organization regarding the material dis-cussed in the manuscript
FUNDING SOURCES
This study received no specific grant from any funding agency in the public, commercial, or not-for-profit sectors.
ARTIGO ORIGINAL
REFERENCES
1. Group UPDS (UKPDS). Blood-glucose control with sulphonylureas or insulin compared with conventional treatment and risk of complications in patients with type 2 diabetes (UKPDS 33). Lancet. 1998;352:837–53. 2. The Diabetes Control and Complications Trial Research Group. The
effect of intensive treatment of diabetes on the development and progression of long-term complications in insulin-dependent diabetes mellitus. N Engl J Med. 1993;329:977–86.
3. American Diabetes Association. Standards of medical care in diabetes. Diabetes Care. 2018;41:S13–27.
4. Garber AJ, Abrahamson MJ, Barzilay JI, Blonde L, Bloomgarden ZT, Bush MA, et al. Consensus statement by the American Association of Clinical Endocrinologists and American College of Endocrinology on the comprehensive type 2 diabetes management algorithm — 2018 executive summary. Endocr Pract. 2018;24:91–120.
5. Haggerty JL, Reid RJ, Freeman GK, Starfield BH, Adair CE, McKendry R. Continuity of care: a multidisciplinary review. BMJ. 2003;327:1219–21. 6. Dearinger AT, Wilson JF, Griffith CH, Scutchfield FD. The effect of
physician continuity on diabetic outcomes in a resident continuity clinic. J Gen Intern Med. 2008;23:937–41.
7. Gill J, Mainous A, Diamond J, Lenhard M. Impact of provider continuity on quality of care for persons with diabetes mellitus. Ann Fam Med. 2003;1:162–70.
8. Wasson JH, Sauvigne AE, Mogielnicki RP, Frey WG, Sox CH, Gaudette C, et al. Continuity of outpatient medical care in elderly men. A randomized trial. JAMA. 1984;252:2413–7.
9. Pereira Gray DJ, Sidaway-Lee K, White E, Thorne A, Evans PH. Continuity of care with doctors — a matter of life and death? A systematic review of continuity of care and mortality. BMJ Open. 2018;8:e021161. 10. Hueston WJ. Does having a personal physician improve quality of care
in diabetes? J Am Board Fam Med. 2010;23:82–7.
11. Mainous AG, Koopman RJ, Gill JM, Baker R, Pearson WS. Relationship between continuity of care and diabetes control: evidence from the Third National Health and Nutrition Examination Survey. Am J Public Health. 2004;94:66–70.
12. Lustman A, Comaneshter D, Vinker S. Interpersonal continuity of care and type two diabetes. Prim Care Diabetes. 2016;10:165–70.
13. Chen CC, Tseng CH, Cheng SH. Continuity of care, medication adherence, and health care outcomes among patients with newly diagnosed type 2 diabetes a longitudinal analysis. Med Care. 2013;51:231–7.
14. Weir DL, Mcalister FA, Majumdar SR, Eurich DT. The interplay between continuity of care, multimorbidity, and adverse events in patients with diabetes. Med Care. 2016;54:386–93.
15. Catapano AL, Graham I, De Backer G, Wiklund O, Chapman MJ, Drexel H, et al. 2016 ESC/EAS Guidelines for the Management of Dyslipidaemias. Eur Heart J. 2016;37:2999–3058l.
16. Levey AS, Stevens LA, Schmid CH, Zhang YL, Castro AF, Feldman HI, et al. A new equation to estimate glomerular filtration rate. Ann Intern Med. 2009;150:604–12.
17. Friedewald WT, Levy RI, Fredrickson DS. Estimation of the concentration of low-density lipoprotein cholesterol in plasma, without use of the preparative ultracentrifuge. Clin Chem. 1972;18:499–502.
18. Mainous AG, Gill JM. The importance of continuity of care in the likelihood of future hospitalization: Is site of care equivalent to a primary clinician? Am J Public Health. 1998;88:1539–41.
19. Simon D. Therapeutic inertia in type 2 diabetes: insights from the PANORAMA study in France. Diabetes Metab. 2012;38:S47–52.