Cancer Risk: A Replication Study in Chinese Population
and a Meta-Analysis
Xuzai Lu1,3., Juntao Ke1., Xia Luo2., Yaowu Zhu2
, Li Zou1, Huijun Li2, Beibei Zhu1, Zhigang Xiong2, Wei Chen1, Lingyan Deng2, Jiao Lou1, Xianxiu Wang2, Yu Zhang1, Zhenling Wang1, Xiaoping Miao1*, Liming Cheng2*
1State Key Laboratory of Environment Health (Incubation), MOE (Ministry of Education) Key Laboratory of Environment & Health, Ministry of Environmental Protection Key Laboratory of Environment and Health (Wuhan), and Department of Epidemiology and Biostatistics, School of Public Health, Tongji Medical College, Huazhong University of Science and Technology, Wuhan, China,2Department of Laboratory Medicine, Tongji Hospital, Tongji Medical College, Huazhong University of Science and Technology, Wuhan, China,3Guangdong Maternal and Child Health Care Hospital, Guangzhou, China
Abstract
Background:Lung cancer is the most commonly diagnosed cancer and leading cause of cancer mortality in the world. A single nucleotide polymorphism (SNP), rs402710, located in 5p15.33, was firstly identified to be associated with the lung cancer risk in a genome-wide association study. However, some following replication studies yielded inconsistent results.
Methodology and Findings:A case-control study of 611 cases and 1062 controls in a Chinese population was conducted, and then a meta-analysis integrating the current and previously published studies with a total 31811 cases and 36333 controls was performed to explore the real effect of rs402710 on lung cancer susceptibility. Significant associations between the SNP rs402710 and lung cancer risk were observed in both case-control study and meta-analysis, with ORs equal to 0.77 (95%CI = 0.63–0.95) and 0.83 (95%CI = 0.81–0.86) in dominant model, respectively. By stratified analysis of our case-control study, the associations were also observed in never smoker group and non-small cell lung cancer(NSCLC) group with ORs equal to 0.71 (95%CI = 0.53–0.95) and 0.69 (95%CI = 0.55–0.87), which was remarkable that larger effect of the minor allele T was seen in the two groups than that in overall lung cancer. Besides, the sensitive and cumulative analysis indicated the robust stability of the current results of meta-analysis.
Conclusion:The results from our replication study and the meta-analysis provided firm evidence that rs402710 T allele significantly contributed to decreased lung cancer risk, and the case-control study implied that the variant may yield stronger effect on NSCLC and never smokers. However, the mechanism underlying the polymorphism conferring susceptibility to lung cancer is warranted to clarify in the follow-up studies.
Citation:Lu X, Ke J, Luo X, Zhu Y, Zou L, et al. (2013) The SNP rs402710 in 5p15.33 Is Associated with Lung Cancer Risk: A Replication Study in Chinese Population and a Meta-Analysis. PLoS ONE 8(10): e76252. doi:10.1371/journal.pone.0076252
Editor:Ramon Andrade de Mello, Faculty of Medicine, University of Porto, Portugal ReceivedApril 11, 2013;AcceptedAugust 21, 2013;PublishedOctober 23, 2013
Copyright:ß2013 Lu et al. This is an open-access article distributed under the terms of the Creative Commons Attribution License, which permits unrestricted use, distribution, and reproduction in any medium, provided the original author and source are credited.
Funding:The authors have no support or funding to report.
Competing Interests:The authors have declared that no competing interests exist. * E-mail: [email protected] (XM); [email protected] (LC)
.These authors contributed equally to this work.
Introduction
Lung cancer is the most commonly diagnosed cancer and leading cause of cancer mortality worldwide, with 1.61 million newly confirmed cases and 1.38 million death from lung cancer annually [1].There are multiple factors attributing to lung cancer, of which environmental exposure, primarily to smoking, is the major risk factor. However, not all lung cancers are due to smoking, and increasing evidence for the association between genetic factors and lung cancer risk is being identified by hundreds of studies [2,3]. The existing evidence suggested that the genetic factors may play a very important role in the development of lung cancer.
various tissue, including lung tissue and overexpress in cisplatin-resistant cell lines, encodes an enzyme—cleft lip and palate trans-membrane 1-like that may be associated with apoptosis [13]. In consideration of the premises, this associated SNP rs402710 has attracted many investigators’ attention from multiple countries and regions. Several follow-up replication studies have resound-ingly replicated the significant association of the SNP with lung cancer risk, in Caucasian [14,15,16] and Asian [16,17,18,19] population. However, some other replication studies showed the inconsistent outcomes [20,21,22]. Two Chinese replication studies failed to identify the similar effect in separate Chinese population [20,21], which may be due to the small sample size. Additionally, owing to the phenomena ‘‘winner’s curse’’ that the effect sizes of initial positive study are usually overestimated, the following replication studies are possibly to be underpowered and then very likely to fail if the necessary sample sizes are based on the initially overestimated effect sizes [23]. Nevertheless, meta-analysis, a method combining data together to make sample size exponential growth to get enough power, can clarify inconsistent results in genetic association studies [24]. Therefore, we conducted a case-control study to examine the association between rs402710 and lung cancer risk in Chinese population, after that, a meta-analysis combining previously published studies and our current study was conducted to provide a more precise estimate of this association.
Materials and Methods
Study population
Between 2009 and 2011, a total of 611 newly confirmed cases and 1062 cancer-free controls were obtained from the Tongji Hospital of Huazhong University of Science and Technology (HUST). All of them were genetically unrelated ethnic Han Chinese residing in Wuhan City or surrounding regions in Hubei Province of central China. The 611 cases were histopathologically confirmed without any treatment (such as radiotherapy or chemotherapy) prior to blood samples collection. All controls were randomly selected from the individuals who participated in a health check-up program at the same hospital during the same period as the cases were recruited. The controls had no history of cancer and were frequency matched to the cases by age (65 years), sex, gender and residential area (urban or rural). After a written informed consent was obtained, a 5-ml peripheral blood sample and a questionnaire were collected from each subject. Smoker was defined as one person who had smoked at least one cigarette per day.1 year or longer at any time in their life, while never-smokers were defined as those who had not. This study was approved by ethics committee of Tongji Hospital of Huazhong University of Science and Technology.
Genotyping
Genomic DNA was extracted from 5-mL of peripheral blood sample using the Relax Gene Blood DNA System DP319-02 (Tiangen, Beijing, China) according to the manufacturer’s instructions. The genotypes of rs402710 SNP was performed by the TaqMan SNP Genotyping Assay(Applied Biosystems, Foster city, CA) using the 7900HT Fast Real-Time PCR System (Applied Biosystems, Foster city, CA) without knowing the subjects’ case or control status. To validate the results, 5% duplicated samples were randomly selected to assess the reproducibility, with a concor-dance rate of 100%.
Statistical analysis
Differences in the distributions of demographic characteristics, selected variables and genotypes between cases and controls were
examined byx2test andttest. The Hardy–Weinberg equilibrium
(HWE) was tested by a goodness of fit x2 test in the control
subjects. Unconditional logistic regression was used to estimate crude odds ratio (OR), adjusted OR and their 95% confidence intervals (CIs) for the effect of rs402710 genotypes on lung cancer risk, with adjustment for age, sex and smoking status, where appropriate. In order to avoid the assumption of genetic models, dominant (TT plus CT vs CC), recessive (TT vs CT plus CC) and additive models were also analyzed. All the analyses were performed using SPSS version 19.0. The criterion of statistical significance except for heterogeneity test was P,0.05, and all statistical tests were two sided.
Meta-analysis of rs402710 in association with lung cancer risk
Followed the methods proposed by the Preferred Reporting Items for Systematic Reviews and Meta-Analyses (PRISMA) [25] and Meta-analysis Of Observational Studies in Epidemiology (MOOSE) guidelines [26], we using the search terms rs402710, 5q15.33orCLPTM1L, combined withlung cancer, lung neoplasia, lung adenoma,lung carcinoma, orlung tumorin the PubMed, Embase and ISI Web of Knowledge databases for published studies without language restriction. References cited by the retrieved articles were also scanned for additional information. Eligible studies had to meet the following criteria: (a) a case-control or nested case-control study assessing the association between rs402710 and lung cancer risk; (b) contained sufficient information about genotype or allele frequency for risk estimates, or original data through which we can calculate what we need; (c) genotypes in controls were in Hardy-Weinberg equilibrium (P.0.01); (d) studies of humans. If there was parallel publication, we selected the study with larger sample size. If more than one ethnic population were involved in one report, each population was considered separately.
The following data were extracted from eligible study by two independent authors (Xuzai Lu & Xia Luo): first author, year of publication, geographic location, ethnicity of study population, study design, genotyping method, numbers of cases and controls, male/female rate, mean age, family history of cancer, source of control group, frequencies of genotypes in cases and controls. ORs and 95% CIs as the metrics of effect size were re-calculated for the allele T versus C, genotypes CT versus CC and TT versus CC and so were the dominant, recessive and additive models respectively. The x2-based Cochran’s Q statistic test was utilized to test
heterogeneity (true variance of effect size across studies), and we considered that the heterogeneity was significant ifP,0.100 forQ
(P,0.05 for Egger’s test or Begg’s test), was applied. All statistical analyses were carried out by Stata Version 11.0. AllPvalues are two-tailed with a significant level at 0.05. If we got a significant association between the SNP and lung cancer risk, bioinformatics analyses were further carried out to predict the function of rs402710 using three comprehensive bioinformatics tools ‘‘FastSNP’’ (http:// fastsnp.ibms.sinica.edu.tw/pages/input_CandidateGeneSearch. jsp), ‘‘SNP Info’’ (http://manticore.niehs.nih.gov/snpfunc.htm) and ‘‘F-SNP’’ (http://compbio.cs.queensu.ca/F-SNP/).
Results
Results of case-control study
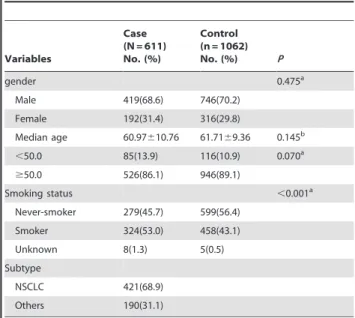
Characteristics of study population. A total of 611 lung cancer cases and 1062 cancer-free controls were enrolled in our study. The characteristics of all subjects were listed in Table 1. Males were 68.6% among cases compared with 70.2% among controls (P= 0.475). The mean age was 60.97 (610.76) years for cases and 61.71 (69.36) years for controls (P= 0.145). There was also no significant difference in distribution of age (,50 and$50 years old, P= 0.070). More smokers were observed in cases compared with subjects in control group (P,0.001), considering that most lung cancers are attributable to smoking. 421 (68.9%) of the cases were histopathologically confirmed as non-small-cell lung cancer (NSCLC), including squamous cell carcinomas, adenocar-cinomas and large cell lung caradenocar-cinomas, meanwhile NSCLC accounts for approximately 80% of primary lung cancers in general.
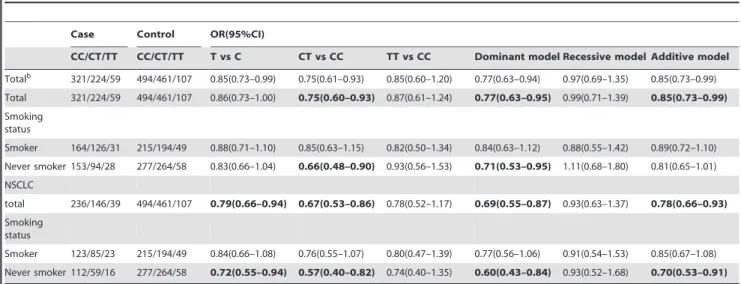
Association analysis. The call rate of genotyping was 99.6% for the SNP rs402710. The distribution of the SNP genotypes in cases and controls was showed in Table 2. Genotypes in controls were in accordance with Hardy-Weinberg equilibrium (P= 0.955). Significant difference was observed in distribution of genotypes between cases and controls (x2= 4.368,P= 0.037).
By multivariate logistic regression model adjusted for age, sex and smoking status, the significant association between rs402710 and lung cancer was observed in heterozygote model (CT versus CC: OR = 0.75, 95%CI = 0.60–0.93), which indicated that the
individuals with the CT genotype had a significantly decreased risk of lung cancer compared to the CC genotype carriers. Likewise, significant associations were found in dominant and additive models (dominant model: OR = 0.77, 95%CI = 0.63–0.95, addi-tive model: OR = 0.85, 95%CI = 0.73–0.99). A dominant model was a T carrier (TT plus CT) group which was combined the TT carriers with the CT carriers to increase statistical power. The per-T-allele OR could be calculated in an additive model. Considering smoking is a major factor contributing to lung cancer, we respectively stratified the cases and controls into two groups, smoker and never smoker, to detect the association between rs402710 and lung cancer. The same effect between rs402710 and lung cancer was also observed in heterozygote and dominant models in never smoker group (heterozygote model: OR = 0.66, 95%CI = 0.48–0.90; dominant model: OR = 0.71, 95%CI = 0.53– 0.95). However, no valid associations were found under any models of smoker group, suggesting that the T carriers who never smoke might have less risk of lung cancer than those smokers.
To explore the rs402710’s effect on NSCLC, we also compared the genotype distribution between the NSCLC cases and controls. Like total lung cancers, similar positive association and stronger genetic effect were found in three models of NSCLC (heterozygote model: OR = 0.67, 95%CI = 0.53–0.86; dominant model: OR = 0.69, 95%CI = 0.55–0.87; additive model: OR = 0.78, 95%CI = 0.66–0.93). It is remarkable that larger effect of the minor allele T was seen in NSCLC than that in overall lung cancer. But beyond that, in the allelic model, T allele carriers also showed significantly protective effect compared to those with the C allele (OR = 0.79, 95%CI = 0.66–0.94). Subsequently, the NSCLC and controls were once again stratified into two groups: smoker and never smoker Likewise, under the same four models of never smoker group, positive association and stronger genetic effect were found. However, significant associations were still not detected under any models of smoker group.
Results of meta-analysis
Characteristic of included studies. As show in Figure S1, we found 16 potentially relevant reports after comprehensive searching, of which, 2 reports with insufficient information were omitted after contacting with authors by e-mail [35,36]. However, the data of a report accomplished by Xun et al [37] completely came from a GWA study by McKay et al [12], which firstly identified the association between rs402710 and lung cancer risk. One study conducted by Truong et al [16] contained two ethnicities of Caucasian and Asian. Finally, as shown in Table 3, 13 reports plus our case-control study comprising 21 studies of 31811 cases and 36333 controls were included in this meta-analysis [12,14,15,16,17,18,19,20,21,22,38,39,40], involving 13 Caucasian studies and 8 Asian studies.
Pooled frequency of risk allele. HapMap database dis-played that the T allele frequencies of rs402710 in Caucasians, Chinese and Japanese were 36.5%, 31.5% and 30.9% respectively. And we similarly found the pooled T allele frequencies were 35.0% (95%CI = 34.5%–35.4%) in Caucasian controls and 31.7% (95%CI = 30.6%–32.9%) in Asian controls in our meta-analysis, under fixed and random model respectively.
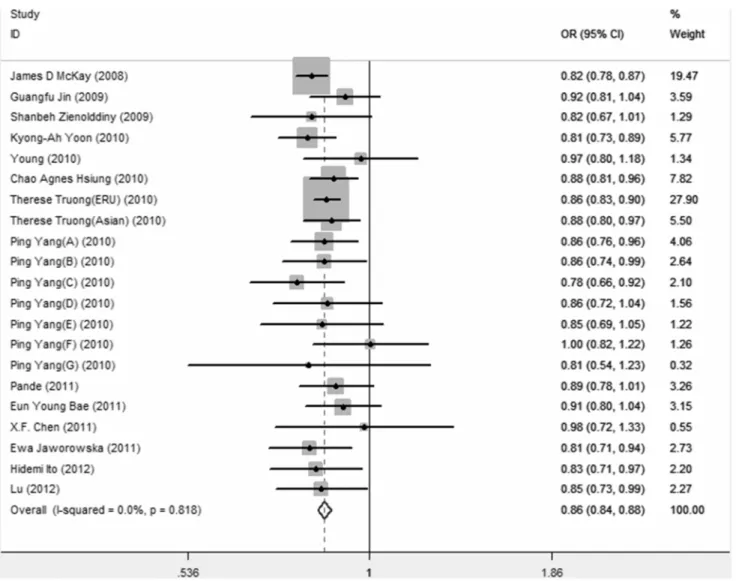
Overall meta-analysis of rs402710 in associated with lung cancer. As shown in Table 4, no significant evidence of heterogeneity was detected in all genetic models (P.0.10), therefore a fix-effects model was employed to pool the OR for all models. In allelic model, as shown in figure 1, the T allele presented a pooled OR of 0.86 (95%CI = 0.84–0.88) compared to the C allele. Genotypic ORs of the TT versus CC and CT versus CC were 0.73(95%CI = 0.69–0.77) and 0.86(95%CI = 0.83–0.89).
Table 1.The characteristics of our study population.
Variables
Case (N = 611) No. (%)
Control (n = 1062)
No. (%) P
gender 0.475a
Male 419(68.6) 746(70.2)
Female 192(31.4) 316(29.8)
Median age 60.97610.76 61.7169.36 0.145b
,50.0 85(13.9) 116(10.9) 0.070a
$50.0 526(86.1) 946(89.1)
Smoking status ,0.001a
Never-smoker 279(45.7) 599(56.4)
Smoker 324(53.0) 458(43.1)
Unknown 8(1.3) 5(0.5)
Subtype
NSCLC 421(68.9)
Others 190(31.1)
aPvalue was calculated by thex2test; bPvalue was calculated by thettest.
Similarly, the dominant, recessive and additive models were all significantly associated with lung cancer risk (dominant model: OR = 0.83, 95%CI = 0.81–0.86; recessive model: OR = 0.79, 95%CI = 0.75–0.83; additive model: OR = 0.86, 95%CI = 0.84– 0.88).
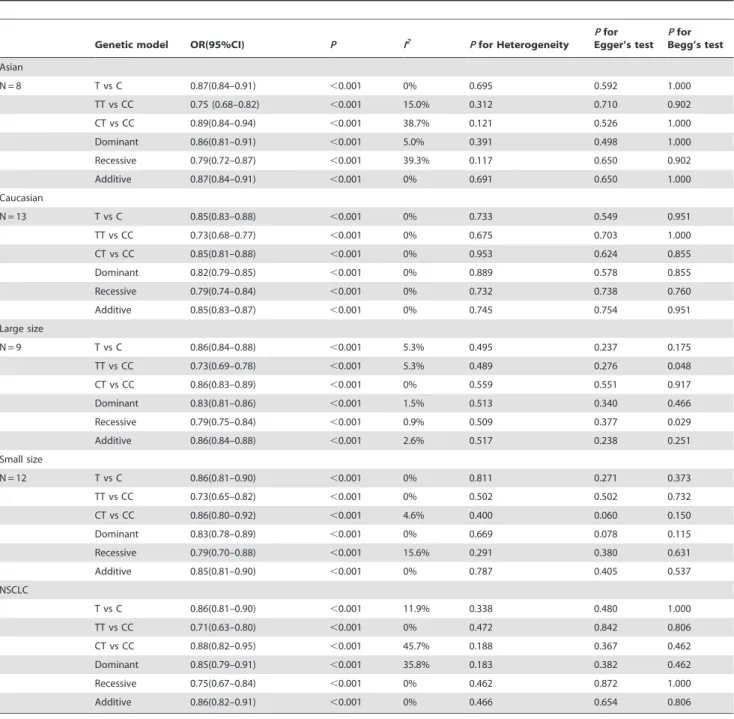
Stratified analyses. We performed stratified analyses to explore the potential source of heterogeneity by ethnicity and sample size (Table 5). After stratified by ethnicity, no significant between-study heterogeneity was detected in Caucasian (P heterogeneity.0.1, all I2= 0%), meanwhile the heterogeneity in Table 2.Association between rs402710 and lung cancer risk in a Chinese populationa.
Case Control OR(95%CI)
CC/CT/TT CC/CT/TT T vs C CT vs CC TT vs CC Dominant model Recessive model Additive model Totalb 321/224/59 494/461/107 0.85(0.73–0.99) 0.75(0.61–0.93) 0.85(0.60–1.20) 0.77(0.63–0.94) 0.97(0.69–1.35) 0.85(0.73–0.99)
Total 321/224/59 494/461/107 0.86(0.73–1.00) 0.75(0.60–0.93) 0.87(0.61–1.24) 0.77(0.63–0.95) 0.99(0.71–1.39) 0.85(0.73–0.99) Smoking
status
Smoker 164/126/31 215/194/49 0.88(0.71–1.10) 0.85(0.63–1.15) 0.82(0.50–1.34) 0.84(0.63–1.12) 0.88(0.55–1.42) 0.89(0.72–1.10)
Never smoker 153/94/28 277/264/58 0.83(0.66–1.04) 0.66(0.48–0.90) 0.93(0.56–1.53) 0.71(0.53–0.95) 1.11(0.68–1.80) 0.81(0.65–1.01) NSCLC
total 236/146/39 494/461/107 0.79(0.66–0.94) 0.67(0.53–0.86) 0.78(0.52–1.17) 0.69(0.55–0.87) 0.93(0.63–1.37) 0.78(0.66–0.93) Smoking
status
Smoker 123/85/23 215/194/49 0.84(0.66–1.08) 0.76(0.55–1.07) 0.80(0.47–1.39) 0.77(0.56–1.06) 0.91(0.54–1.53) 0.85(0.67–1.08)
Never smoker 112/59/16 277/264/58 0.72(0.55–0.94) 0.57(0.40–0.82) 0.74(0.40–1.35) 0.60(0.43–0.84) 0.93(0.52–1.68) 0.70(0.53–0.91)
Abbreviations: OR, Odds ratio; 95%CI, 95% confidence interval.
aORs and their corresponding 95% CIs were calculated by multivariate logistic regression model after adjusting for age, sex and smoking. bCrude ORs and their corresponding 95% CIs were calculated without adjustment.
doi:10.1371/journal.pone.0076252.t002
Table 3.Characteristics of studies on rs402710 polymorphisms and risk of lung cancer included in the meta-analysis.
First author Year Country Ethnicity Study method Study design Genotyping
Tumor
subtype Case/control James D McKay 2008 France Caucasian Cohort/CC GWAS+Replication Illumina/Taqman Lung cancer 5223/7624
Guangfu Jin 2009 China Asian CC Replication PCR NSCLC 1199/1329
Shanbeh Zienolddiny 2009 Norway Caucasian CC Replication Taqman-PCR NSCLC 356/432
Kyon-Ah Yoon 2010 Korea Asian CC GWAS/Replication Affymetrix/Taqman NSCLC 1425/3011
Young 2010 New ZealandCaucasian CC Replication Sequenom Lung cancer 453/487
Chao Agnes Hsiung 2010 TaiWan Asian Cohort/CC GWAS+Replication Illumina/Taqman AD 2659/2844
Therese Truong(ERU) 2010 USA Caucasian CC Replication Mix Lung cancer 8860/9198
Therese Truong(Asian) 2010 USA Asian CC Replication Mix Lung cancer 1680/2117
Ping Yang(A) 2010 Ireland Caucasian CC Replication Taqman-PCR Lung cancer 1735/1036
Ping Yang(B) 2010 Ireland Caucasian CC Replication Taqman-PCR Lung cancer 651/1206
Ping Yang(C) 2010 Ireland Caucasian CC Replication Taqman-PCR Lung cancer 1406/412
Ping Yang(D) 2010 Ireland Caucasian CC Replication Taqman-PCR Lung cancer 415/614
Ping Yang(E) 2010 Ireland Caucasian CC Replication Taqman-PCR Lung cancer 771/260
Ping Yang(F) 2010 Ireland Caucasian CC Replication Taqman-PCR Lung cancer 329/624
Ping Yang(G) 2010 Ireland Caucasian CC Replication Taqman-PCR Lung cancer 82/133
Pande 2011 USA Caucasian CC Replication Illumina Lung cancer 1074/1091
XF Chen 2011 China Asian CC Replication Taqman-PCR AD 225/193
Ewa Jaworowska 2011 Poland Caucasian CC Replication Taqman-PCR Lung cancer 848/845
Eun Young Bae 2012 Korea Asian CC Replication PCR Lung cancer 1094/1099
Hidemi Ito 2012 Japan Asian CC Replication Taqman-PCR Lung cancer 716/716
Lu 2012 China Asian CC Replication Taqman-PCR Lung cancer 611/1062
heterozygous (I2= 38.7%) and recessive (I2= 39.3%) model among Asian studies slightly increased from no heterogeneity grade to moderate grade. It might be due to that the heterogeneity largely came from Asian studies and the heterogeneity in Caucasian studies was little. Even the heterogeneity in Asian studies which could be accounted for different study design and genotyping methods reached moderate grade, the values ofPfor heterogeneity
were all greater than 0.10. In other words, the results of meta-analysis in Asian studies were credible and representative. In spite of this, the significant association between the SNP rs402710 and lung cancer risk was still identified in all genetic models of both Caucasian and Asian groups. Subsequently, the data of genotypes was stratified by sample size, which was defined large group when it was more than 1000, otherwise was small group. In the two
Figure 1. Forest plot of association of rs402710 with lung cancer under allelic model. doi:10.1371/journal.pone.0076252.g001
Table 4.Pooled OR with 95% CI for the association between rs402710 and lung cancer risk in the meta-analysis.
Genetic model OR(95%CI) P I2 P
for Heterogeneity
Pfor Egger’s test
Pfor Begg’s test Overall
N = 21 T vs C 0.86(0.84–0.88) ,0.001 0% 0.818 0.296 0.833
TT vs CC 0.73(0.69–0.77) ,0.001 0% 0.602 0.777 0.880
CT vs CC 0.86(0.83–0.89) ,0.001 0% 0.566 0.335 0.740
Dominant 0.83(0.81–0.86) ,0.001 0% 0.734 0.276 0.740
Recessive 0.79(0.75–0.83) ,0.001 1.4% 0.440 0.977 0.833
Additive 0.86(0.84–0.88) ,0.001 0% 0.810 0.444 1.000
subgroups, all genetic models exhibited significant association with decreased lung cancer risk, and showed no significant between-study heterogeneity.
To provide a more precise estimate of the effect of rs402710 on NSCLC, we combined our current study and previously published studies which displayed detailed information about NSCLC, including 5 studies of 6060 NSCLC cases and 8678 controls. The heterogeneity in heterozygous (I2= 45.7%) and dominant (I2= 35.8%) model among NSCLC studies was moderate, which might be due to different study design and genotyping methods. Under fixed-effects model, the significant association with decreased lung cancer risk was exhibited in all genetic models.
Sensitivity analyses and Cumulative meta-analyses. To assess the effect of individual study on the pooled estimate,
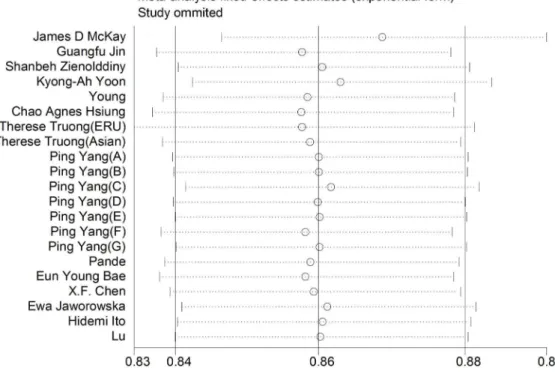
we performed a sensitivity analysis by omitting each study in turn. As shown in Table 6, the result of the allelic model was particularly robust when we eliminated each study. There was almost no change of the ORs and 95%CIs after each deletion (Figure 2). Analogous results existed in other genetic models and no single study conspicuously changed the pooled ORs.
Cumulative meta-analyses were also conducted in all genetic models via assortment of studies by chronological order. As shown in Figure 3, in the allelic model, the 95% CIs for the pooled OR became gradually narrower with each accumulation of more studies, which indicated that the precision of the estimation was progressively boosted by continual adding more sample. Similar results were also observed in other genetic models.
Table 5.Stratified analysis of the association between rs402710 genotype and lung cancer risk.
Genetic model OR(95%CI) P I2 P
for Heterogeneity
Pfor Egger’s test
Pfor Begg’s test Asian
N = 8 T vs C 0.87(0.84–0.91) ,0.001 0% 0.695 0.592 1.000
TT vs CC 0.75 (0.68–0.82) ,0.001 15.0% 0.312 0.710 0.902
CT vs CC 0.89(0.84–0.94) ,0.001 38.7% 0.121 0.526 1.000
Dominant 0.86(0.81–0.91) ,0.001 5.0% 0.391 0.498 1.000
Recessive 0.79(0.72–0.87) ,0.001 39.3% 0.117 0.650 0.902
Additive 0.87(0.84–0.91) ,0.001 0% 0.691 0.650 1.000
Caucasian
N = 13 T vs C 0.85(0.83–0.88) ,0.001 0% 0.733 0.549 0.951
TT vs CC 0.73(0.68–0.77) ,0.001 0% 0.675 0.703 1.000
CT vs CC 0.85(0.81–0.88) ,0.001 0% 0.953 0.624 0.855
Dominant 0.82(0.79–0.85) ,0.001 0% 0.889 0.578 0.855
Recessive 0.79(0.74–0.84) ,0.001 0% 0.732 0.738 0.760
Additive 0.85(0.83–0.87) ,0.001 0% 0.745 0.754 0.951
Large size
N = 9 T vs C 0.86(0.84–0.88) ,0.001 5.3% 0.495 0.237 0.175
TT vs CC 0.73(0.69–0.78) ,0.001 5.3% 0.489 0.276 0.048
CT vs CC 0.86(0.83–0.89) ,0.001 0% 0.559 0.551 0.917
Dominant 0.83(0.81–0.86) ,0.001 1.5% 0.513 0.340 0.466
Recessive 0.79(0.75–0.84) ,0.001 0.9% 0.509 0.377 0.029
Additive 0.86(0.84–0.88) ,0.001 2.6% 0.517 0.238 0.251
Small size
N = 12 T vs C 0.86(0.81–0.90) ,0.001 0% 0.811 0.271 0.373
TT vs CC 0.73(0.65–0.82) ,0.001 0% 0.502 0.502 0.732
CT vs CC 0.86(0.80–0.92) ,0.001 4.6% 0.400 0.060 0.150
Dominant 0.83(0.78–0.89) ,0.001 0% 0.669 0.078 0.115
Recessive 0.79(0.70–0.88) ,0.001 15.6% 0.291 0.380 0.631
Additive 0.85(0.81–0.90) ,0.001 0% 0.787 0.405 0.537
NSCLC
T vs C 0.86(0.81–0.90) ,0.001 11.9% 0.338 0.480 1.000
TT vs CC 0.71(0.63–0.80) ,0.001 0% 0.472 0.842 0.806
CT vs CC 0.88(0.82–0.95) ,0.001 45.7% 0.188 0.367 0.462
Dominant 0.85(0.79–0.91) ,0.001 35.8% 0.183 0.382 0.462
Recessive 0.75(0.67–0.84) ,0.001 0% 0.462 0.872 1.000
Additive 0.86(0.82–0.91) ,0.001 0% 0.466 0.654 0.806
Figure 2. Sensitivity analysis of allelic model. doi:10.1371/journal.pone.0076252.g002
Table 6.Sensitivity analysis of the allelic model.
Study omitted OR(95%CI) P I2 Pfor Heterogeneity
James D McKay(2008) 0.87(0.84–0.89) ,0.001 0% 0.920
Guangfu Jin(2009) 0.86(0.84–0.88) ,0.001 0% 0.842
Shanbeh Zienolddiny(2009) 0.86(0.84–0.88) ,0.001 0% 0.780
Kyon-Ah Yoon(2010) 0.86(0.84–0.88) ,0.001 0% 0.850
Young(2010) 0.86(0.84–0.88) ,0.001 0% 0.854
Chao Agnes Hsiung(2010) 0.85(0.83–0.88) ,0.001 0% 0.806
Therese Truong(ERU)(2010) 0.86(0.83–0.88) ,0.001 0% 0.777
Therese Truong(Asian)(2010) 0.86(0.84–0.88) ,0.001 0% 0.783
Ping Yang(A)(2010) 0.86(0.84–0.88) ,0.001 0% 0.770
Ping Yang(B)(2010) 0.86(0.84–0.88) ,0.001 0% 0.770
Ping Yang(C)(2010) 0.86(0.84–0.88) ,0.001 0% 0.842
Ping Yang(D)(2010) 0.86(0.84–0.88) ,0.001 0% 0.770
Ping Yang(E)(2010) 0.86(0.84–0.88) ,0.001 0% 0.770
Ping Yang(F)(2010) 0.86(0.84–0.88) ,0.001 0% 0.893
Ping Yang(G)(2010) 0.86(0.84–0.88) ,0.001 0% 0.773
Pande(2011) 0.86(0.84–0.88) ,0.001 0% 0.791
Eun Young Bae(2011) 0.86(0.84–0.88) ,0.001 0% 0.826
XF Chen(2011) 0.86(0.84–0.88) ,0.001 0% 0.813
Ewa Jaworowska(2011) 0.86(0.84–0.88) ,0.001 0% 0.798
Hidemi Ito(2012) 0.86(0.84–0.88) ,0.001 0% 0.778
Lu(2012) 0.86(0.84–0.88) ,0.001 0% 0.771
Combined 0.86(0.84–0.88) ,0.001 0% 0.818
Publication bias. As reflected by the funnel plot, the Egger’s test and the Begg’s test, there was no publication bias under all genetic models (P Egger.0.05, P Begg.0.05) and funnel plot was
visually symmetrical.
The bioinformatics analyses of rs402710. Only one of the three bioinformatics tools, ‘‘F-SNP’’ forecasted that the SNP was likely to participate in transcriptional regulation with a low score.
Discussion
In our case-control study, a significant association between the SNP rs402710 and lung cancer risk was revealed under heterozygous, dominant and additive model in Chinese popula-tion. Additionally, the following meta-analysis integrating our current study and 13 previous studies with a total of 31811 cases and 36333 controls, concordantly demonstrated the association between rs402710 and lung cancer under all six genetic models. Subsequently, with each accumulating of more chronological data, cumulative meta-analysis displayed the more precise effect of this variant with 95% CIs of the pooled ORs becoming progressively narrower. Before and after the deletion of each study, estimates of
all genetic models were similar in sensitivity analysis, manifesting the robust stability of the meta-analysis. Little publication bias was detected.
The rs402710 is located in intron 4 of theCLPTM1Lgene on chromosome 5p15.33, which contains two biologically relevant genes for lung cancer, TERT (telomerase reverse transcriptase) and CLPTM1L. The copy number gain of this region of chromosome 5p is the most frequent cytogenetic event in the early stages of NSCLC [41]. However, for a long time, the functions ofCLPTM1Lgene were poorly understood, and it was observed as a cisplatin-resistance factor in ovarian cancer-cell lines which can’t be taken as a function of CLPTM1L gene on oncogenesis [42]. Remarkably, published in June of 2012, James MA et al [43] demonstrated thatCLPTM1L, as an overexpressed protein in lung tumor cells, protected from genotoxic stress induced apoptosis through regulation of Bcl-xL, which implicated that the anti-apoptotic CLPTM1L function may be a potential mechanism of susceptibility to lung tumorigenesis.
TheCLPTM1Lgene variant rs402710 is associated with higher DNA adduct formation in tumor adjacent lung tissue [38]. Levels of these DNA adducts (formed by polycyclic aromatic
bons and aldehydes found in cigarette smoke) can be used as a biomarker accounting exposure to tobacco carcinogen. It is possible that the rs402710 variant may enhance formation and persistence of DNA adducts. However, the association between this variant and the CLPTM1L gene is not clear. Through bioinformatics analysis, we found that this variant may participate in transcriptional regulation. But the effect of the SNP in lung tumorigenesis needs to be affirmed by further studies.
The susceptibility locus rs402710 was firstly identified in a GWA study of Caucasian population by Mckay JD et al [12], however, the follow-up replication studies showed inconsonant results. The association between rs402710 and lung cancer has been respectively confirmed in some of the genetic models in Japan population [18], Korea population [19,40] and mixed Asian population [17], but two replication studies in Chinese population failed to carry out the similar results [20,21]. Although a meta-analysis about this SNP rs402710 by Simone Mocellin et al [44] drew a positive conclusion, it contained 10 studies before 2011 and only demonstrated allelic model. In our case-control study in Chinese population, the association between rs402710 and protective effect of lung cancer was identified in heterozygote, dominant and additive models but failed in allelic, homozygous and recessive models, may be due to the small sample size of the study. In NSCLC, it is remarkable that larger effect of the minor allele T was detected in NSCLC than that in overall lung cancers. Additionally, the following meta-analysis comprising 31811 cases and 36333 controls consistently suggested the significant association of rs402710 with protective effect of lung cancer in all genetic models. After stratification by ethnicities or study sample size, the significant associations between SNP rs402710 and lung cancer were identified in all genetic models of all subgroups. However, the genetic effect on Caucasian was stronger than that of Asian under every genetic model, likely relating to different allele frequencies between Asian and Caucasian. In NSCLC, the significant associations with decreased lung cancer risk were explored in all genetic models, which further supported our findings in case-control study.
Although no heterogeneity was detected in all genetic models among included studies, stratified analyses was still performed to explore the differences between ethnicities or study sample size. In
Caucasians, no significant heterogeneity was detected, whereas the heterogeneity in heterozygous and recessive model among Asian studies increased from no heterogeneity grade to moderate grade. The same phenomenon, that the heterogeneity between large sample size studies removed and the small group increased, existed after stratified by study sample size, which may be due to the sampling error in small studies. Furthermore, the sensitivity analysis and publication bias estimation illustrated the current results of this meta-analysis were robust.
Despite the clear strength of the current study possessing enough power, some limitations should be seriously considered. Firstly, the sample size of our case-control study was relatively small. Secondly, absent data or insufficient data restricted us to perform further analysis. Thus we couldn’t analysis the association between the SNP rs402710 and lung cancer subtypes including adenocarcinoma, non-small cell lung cancer, small cell lung cancer and others. Finally, lung cancer is a complex disease caused by both genetic and environmental factors, but the gene-environment interaction can’t be evaluated owing to the absence of environ-mental information.
In conclusion, the current case-control study and the follow-up meta-analysis helped to strongly clarify the significant association between rs402710 and lung cancer, and our study implied that the variant may yield stronger effect on NSCLC and never smokers. However, it is needed to implement fine-mapping of 5p15.33 region or function analysis to identify causal variant.
Supporting Information
Figure S1 Follow chart of study selection. (TIF)
Checklist S1 PRISMA checklist. (DOC)
Author Contributions
Conceived and designed the experiments: LC XM. Performed the experiments: X. Lu Y. Zhang LZ. Analyzed the data: JK X. Luo HL BZ ZX WC. Contributed reagents/materials/analysis tools: XL JK Y. Zhu LZ LD JL XW ZW. Wrote the paper: X. Lu. Revised the manuscript: X. Lu JK.
References
1. Ferlay J, Shin H-R, Bray F, Forman D, Mathers C, et al. (2010) Estimates of worldwide burden of cancer in 2008: GLOBOCAN 2008. International Journal of Cancer 127: 2893–2917.
2. Brennan P, Hainaut P, Boffetta P (2011) Genetics of lung-cancer susceptibility. Lancet Oncology 12: 399–408.
3. Liu L, Wu J, Wu C, Wang Y, Zhong R, et al. (2011) A functional polymorphism (-1607 1GR2G) in the matrix metalloproteinase-1 promoter is associated with development and progression of lung cancer. Cancer 117: 5172–5181.
4. Chung CC, Magalhaes WCS, Gonzalez-Bosquet J, Chanock SJ (2009) Genome-wide association studies in cancer–current and future directions. Carcinogenesis 31: 111–120.
5. Wu C, Miao X, Huang L, Che X, Jiang G, et al. (2012) Genome-wide association study identifies five loci associated with susceptibility to pancreatic cancer in Chinese populations. Nat Genet 44: 62–66.
6. Garcia-Barcelo MM, Yeung MY, Miao XP, Tang CS, Cheng G, et al. (2010) Genome-wide association study identifies a susceptibility locus for biliary atresia on 10q24.2. Hum Mol Genet 19: 2917–2925.
7. Wang L, Wu XP, Zhang W, Zhu DH, Wang Y, et al. (2011) Evaluation of genetic susceptibility loci for chronic hepatitis B in Chinese: two independent case-control studies. PLoS One 6: e17608.
8. Hung RJ, McKay JD, Gaborieau V, Boffetta P, Hashibe M, et al. (2008) A susceptibility locus for lung cancer maps to nicotinic acetylcholine receptor subunit genes on 15q25. Nature 452: 633–637.
9. Amos CI, Wu X, Broderick P, Gorlov IP, Gu J, et al. (2008) Genome-wide association scan of tag SNPs identifies a susceptibility locus for lung cancer at 15q25.1. Nature Genetics 40: 616–622.
10. Thorgeirsson TE, Geller F, Sulem P, Rafnar T, Wiste A, et al. (2008) A variant associated with nicotine dependence, lung cancer and peripheral arterial disease. Nature 452: 638–642.
11. Wang Y, Broderick P, Webb E, Wu X, Vijayakrishnan J, et al. (2008) Common 5p15.33 and 6p21.33 variants influence lung cancer risk. Nature Genetics 40: 1407–1409.
12. McKay JD, Hung RJ, Gaborieau V, Boffetta P, Chabrier A, et al. (2008) Lung cancer susceptibility locus at 5p15.33. Nature Genetics 40: 1404–1406. 13. Yamamoto K, Okamoto A, Isonishi S, Ochiai K, Ohtake Y (2001) A novel
gene,CRR9, which was up-regulated in CDDP-resistant ovarian tumor cell line, was associated with apoptosis. Biochem Biophys Res Commun 280: 1148–1154. 14. Jaworowska E, Trubicka J, Lener MR, Masojc B, Zlowocka-Perlowska E, et al. (2011) Smoking related cancers and loci at chromosomes 15q25, 5p15, 6p22.1 and 6p21.33 in the Polish population. PLoS One 6: e25057.
15. Pande M, Spitz MR, Wu XF, Gorlov IP, Chen WV, et al. (2011) Novel genetic variants in the chromosome 5p15.33 region associate with lung cancer risk. Carcinogenesis 32: 1493–1499.
16. Truong T, Hung RJ, Amos CI, Wu X, Bickeboller H, et al. (2010) Replication of lung cancer susceptibility loci at chromosomes 15q25, 5p15, and 6p21: a pooled analysis from the International Lung Cancer Consortium. J Natl Cancer Inst 102: 959–971.
17. Hsiung CA, Lan Q, Hong YC, Chen CJ, Hosgood HD, et al. (2010) The 5p15.33 Locus Is Associated with Risk of Lung Adenocarcinoma in Never-Smoking Females in Asia. Plos Genetics 6.
19. Yoon KA, Park JH, Han J, Park S, Lee GK, et al. (2010) A genome-wide association study reveals susceptibility variants for non-small cell lung cancer in the Korean population. Hum Mol Genet 19: 4948–4954.
20. Chen XF, Cai S, Chen QG, Ni ZH, Tang JH, et al. (2012) Multiple variants of TERT and CLPTM1L constitute risk factors for lung adenocarcinoma. Genet Mol Res 11: 370–378.
21. Jin G, Xu L, Shu Y, Tian T, Liang J, et al. (2009) Common genetic variants on 5p15.33 contribute to risk of lung adenocarcinoma in a Chinese population. Carcinogenesis 30: 987–990.
22. Yang P, Li Y, Jiang R, Cunningham JM, Zhang F, et al. (2010) A rigorous and comprehensive validation: common genetic variations and lung cancer. Cancer Epidemiol Biomarkers Prev 19: 240–244.
23. Zhong H, Prentice RL (2009) Correcting ‘‘winner’s curse’’ in odds ratios from genomewide association findings for major complex human diseases. Genetic Epidemiology: n/a-n/a.
24. Pabalan NA (2010) Meta-Analysis in Cancer Genetics. Asian Pacific Journal of Cancer Prevention 11: 33–38.
25. Knobloch K, Yoon U, Vogt PM (2011) Preferred reporting items for systematic reviews and meta-analyses (PRISMA) statement and publication bias. Journal of Cranio-Maxillofacial Surgery 39: 91–92.
26. Stroup DF, Berlin JA, Morton SC, Olkin I, Williamson GD, et al. (2000) Meta-analysis of observational studies in epidemiology - A proposal for reporting. Jama-Journal of the American Medical Association 283: 2008–2012. 27. Higgins JPT, Thompson SG (2002) Quantifying heterogeneity in a
meta-analysis. Statistics in Medicine 21: 1539–1558.
28. Higgins JP TS, Deeks JJ, Altman DG (2003) Measuring inconsistency in meta-analyses. BMJ 327: 557–560.
29. Mantel N, Haenszel W (1959) Statistical aspects of the analysis of data from retrospective studies of disease. Journal of the National Cancer Institute 22: 719– 748.
30. Mullen B, Muellerleile P, Bryant B (2001) Cumulative meta-analysis: A consideration of indicators of sufficiency and stability. Personality and Social Psychology Bulletin 27: 1450–1462.
31. Thakkinstian A, McElduff P, D’Este C, Duffy D, Attia J (2005) A method for meta-analysis of molecular association studies. Statistics in Medicine 24: 1291– 1306.
32. Begg CB, Mazumdar M (1994) Operating characteristics of a rank correlation test for publication bias. Biometrics 50: 1088–1101.
33. Egger M, Davey Smith G, Schneider M, Minder C (1997) Bias in meta-analysis detected by a simple, graphical test. BMJ 315: 629–634.
34. Duval S, Tweedie R (2000) Trim and fill: A simple funnel-plot-based method of testing and adjusting for publication bias in meta-analysis. Biometrics 56: 455– 463.
35. Broderick P, Wang Y, Vijayakrishnan J, Matakidou A, Spitz MR, et al. (2009) Deciphering the Impact of Common Genetic Variation on Lung Cancer Risk: A Genome-Wide Association Study. Cancer Research 69: 6633–6641. 36. Landi MT, Chatterjee N, Yu K, Goldin LR, Goldstein AM, et al. (2009) A
Genome-wide Association Study of Lung Cancer Identifies a Region of Chromosome 5p15 Associated with Risk for Adenocarcinoma. The American Journal of Human Genetics 85: 679–691.
37. Xun WW, Brennan P, Tjonneland A, Vogel U, Overvad K, et al. (2011) Single-nucleotide polymorphisms (5p15.33, 15q25.1, 6p22.1, 6q27 and 7p15.3) and lung cancer survival in the European Prospective Investigation into Cancer and Nutrition (EPIC). Mutagenesis 26: 657–666.
38. Zienolddiny S, Skaug V, Landvik NE, Ryberg D, Phillips DH, et al. (2009) The TERT-CLPTM1L lung cancer susceptibility variant associates with higher DNA adduct formation in the lung. Carcinogenesis 30: 1368–1371. 39. Young RP, Hopkins RJ, Whittington CF, Hay BA, Epton MJ, et al. (2011)
Individual and cumulative effects of GWAS susceptibility loci in lung cancer: associations after sub-phenotyping for COPD. PLoS One 6: e16476. 40. Bae EY, Lee SY, Kang BK, Lee EJ, Choi YY, et al. (2012) Replication of results
of genome-wide association studies on lung cancer susceptibility loci in a Korean population. Respirology 17: 699–706.
41. Kang JU, Koo SH, Kwon KC, Park JW, Kim JM (2008) Gain at chromosomal region 5p15.33, containing TERT, is the most frequent genetic event in early stages of non-small cell lung cancer. Cancer Genetics and Cytogenetics 182: 1– 11.
42. Yamamoto K, Okamoto A, Isonishi S, Ochiai K, Ohtake Y (2001) A Novel Gene, CRR9, Which Was Up-Regulated in CDDP-Resistant Ovarian Tumor Cell Line, Was Associated with Apoptosis. Biochemical and Biophysical Research Communications 280: 1148–1154.
43. James MA, Wen W, Wang Y, Byers LA, Heymach JV, et al. (2012) Functional Characterization of CLPTM1L as a Lung Cancer Risk Candidate Gene in the 5p15.33 Locus. PLoS ONE 7: e36116.