Reciprocal Interactions between Breast Tumor and Its
Adipose Microenvironment Based on a 3D Adipose
Equivalent Model
Laetitia Delort1,2*, Charlotte Lequeux4, Virginie Dubois1,2, Alice Dubouloz4, Hermine Billard1,2, Ali Mojallal4,5, Odile Damour4, Marie-Paule Vasson1,2,3, Florence Caldefie-Che´zet1,2
1Clermont Universite´, Universite´ d’Auvergne, UFR Pharmacie, Laboratoire SVFp, Clermont-Ferrand, France,2INRA, UMR 1019, ECRIN, CRNH Auvergne, Clermont-Ferrand, France,3Centre Jean Perrin, Unite´ de Nutrition, Clermont-Ferrand, France,4Banque de tissus et de cellules, Hoˆpital Edouard-Herriot, Lyon, France,5Service de chirurgie plastique, reconstructrice et esthe´tique, Hoˆpital Edouard-Herriot, Lyon, France
Abstract
Breast cancer has become the most common cancer among women in industrialized countries. Obesity is well established as a risk factor, in particular owing to the attendant secretion of the entities called adipokines; there is growing evidence for a role of cells and factors present in the mammary tumor microenvironment such as fibroblasts, preadipocytes, adipocytes and their secretions. To study how the microenvironment influences breast cancer growth, we developed a novel tridimensional adipose model epithelialized with normal human keratinocytes or with breast cancer cell lines. These mimicked a breast tumor in contact with an adipose microenvironment and allowed monitoring of the interactions between the cells. Leptin and adiponectin, two major adipokines, and their respective receptors, ObRt and AdipoR1, were expressed in the model, but not the second adiponectin receptor, AdipoR2. The differentiation of preadipocytes into adipocytes was greater when they were in contact with the breast cancer cell lines. The contact of breast cancer cell lines with the microenvironment completely modified their transcriptional programs by increasing the expression of genes involved in cell proliferation (cyclinD1, MAPK), angiogenesis (MMP9, VEGF) and hormonal pathways (ESR1, IL6). This tridimensional adipose model provides new insights into the interactions between breast cancer cells and their adipose microenvironment, and provides a tool to develop new drugs for the treatment of both cancer and obesity.
Citation:Delort L, Lequeux C, Dubois V, Dubouloz A, Billard H, et al. (2013) Reciprocal Interactions between Breast Tumor and Its Adipose Microenvironment Based on a 3D Adipose Equivalent Model. PLoS ONE 8(6): e66284. doi:10.1371/journal.pone.0066284
Editor:Surinder K. Batra, University of Nebraska Medical Center, United States of America
ReceivedSeptember 11, 2012;AcceptedMay 9, 2013;PublishedJune 4, 2013
Copyright:ß2013 Delort et al. This is an open-access article distributed under the terms of the Creative Commons Attribution License, which permits unrestricted use, distribution, and reproduction in any medium, provided the original author and source are credited.
Funding:This study received financial support from "Ligue Nationale contre le Cancer" (comite´ du Puy-de-Doˆme, Prof. F. Caldefie-Che´zet) and "Cance´ropole Lyon-Auvergne-Rhoˆne-Alpes". Virginie Dubois is supported by a French Ministry of Research and Technology fellowship. The funders had no role in study design, data collection and analysis, decision to publish, or preparation of the manuscript.
Competing Interests:The authors have declared that no competing interests exist.
* E-mail: [email protected]
Introduction
Breast cancer is by far the most common cancer among women worldwide, with 1.38 million new cases diagnosed in 2008, causing 458,000 deaths. The incidence of this cancer varies geographically being low in developing regions (South America, Africa and Asia) and a high incidence in developed countries (US and Western Europe) [1].
Obesity is now recognized as a risk factor for breast cancer, particularly in postmenopausal women, and is correlated with poor prognosis, larger tumor size, a higher incidence of lymph node metastasis and a high tumor grade [2]. In 2005, the world overweight population was 937 million (23.2%), of whom 396 million were obese (9.8%). In many industrialized countries, over one fifth of the adult population is obese, and this proportion is also increasing in developing countries [3].
Understanding the role of adipose tissue in breast cancer growth is of major interest in obese patients. There are several possible explanations of the relationship between breast cancer and adiposity. First, the larger amount of adipose tissue in obese patients is associated with a higher conversion of androgens to estrogens by aromatase, and higher circulating levels of insulin and
insulin-growth factor (IGF), which then enhance cell proliferation [4]. Second, adipose tissue can produce greater amounts of the entities called adipokines, whose concentrations are modulated by obesity. Some recent studies have shown that adipose tissue is not only fat storage tissue, but is also an endocrine organ. We have demonstrated that leptin and adiponectin, the two main adipokines studied, exert proliferative and antiproliferative activ-ities respectively on breast cancer cellsin vitro[5]. Leptin, whose serum concentration is increased in obesity and breast cancer [6], stimulates cell proliferation by up-regulating the expression of cdk2 and cyclinD1 [7]. Inversely, low levels of adiponectin are significantly associated with an increased risk of breast cancer [8,9]. However, in vitro assays have shown that adiponectin decreased the proliferation of breast cancer cell lines (MCF7, MDA-MB-231) and induced apoptosis and cell cycle arrest [10,11]. In addition, these two adipokines and their respective receptors (ObR, AdipoR1 and AdipoR2) are detected by immunohistochemistry in in situ carcinomas, invasive ductal carcinomas and healthy adjacent tissues [5].
cells are surrounded by stromal cells, such as preadipocytes, adipocytes, fibroblasts, and endothelial and inflammatory cells, and there is increasing evidence that factors produced by this tumor microenvironment, including extracellular matrix compo-nents and direct cell-cell contact, impact on breast carcinogenesis [12]. For example, adipocytes may promote cancer progression [13], and endothelial cells may regulate cancer cell proliferation and invasiveness. A recent study showed that the secretions of ‘‘dysfunctional’’ endothelial cells could enhance hyperplasia, angiogenesis and inflammation [14]. Variations in fibroblast distribution can also influence local breast estrogen synthesis and thereby promote tumor growth [15].
The role of this microenvironment in the proliferation of healthy or malignant cells is still not clear but warrants investigation in the case of breast cancer. We devised a tridimensional (3D) model to study the interactions between the adipose tumor microenvironment and breast cancer cells. For this purpose, an innovative adipose 3D model epithelialized with normal human keratinocytes or with breast cancer cell lines was developed. The latter mimicked a breast tumor, allowing a direct contact with the adipose microenvironment. A comparison of these models showed interactions in both directions: breast cancer cells were able to act on adipocyte differentiation, and the adipose microenvironment strikingly modified breast cancer cell transcrip-tional programs involved in major biological pathways.
Materials and Methods
Cell cultures
Primary cultures of keratinocytes and fibroblasts were estab-lished from human skin obtained from patients undergoing surgery, in accordance to ethical and safety guidelines drawn up in French regulation nuDC-2008-162.
Fibroblasts were isolated from the foreskin of a child donor (age,10 years). They were grown in Dulbecco’s modified Eagle’s medium (DMEM with glutamax-1, Invitrogen, Cergy-Pontoise, France) supplemented with 10% calf serum (HyClone, Logan, Utah, USA), 20mg/ml gentamicin (Pantapharm, Fouge`res,
France), 100 UI/ml penicillin (Sarbach, Suresnes, France) and 1mg/ml amphotericin B (Bristol Myers Squibb, Puteaux, France). Keratinocytes were obtained from the foreskin of a child donor (age,10 years). They were grown in a 3:1 mixture of DMEM and HAM F12 (Invitrogen), supplemented with 10% calf serum (HyClone), 10 ng/ml epidermal growth factor (EGF) (Austral biologic, San Ramon, California, USA), 0.12 UI/ml insulin (Lillly, Saint-Cloud, France), 0.4mg/ml hydrocortisone (Up John,
Saint-Quentin-en-Yvelines, France), 5mg/ml triiodo-L-thyronine (Sig-ma, Saint-Quentin-Fallavier, France), 24.3mg/ml adenine (Sigma) and antibiotics as above. All the skin samples were obtained with informed consent of their donors.
Human Adipose derived Stem Cells (ASC) from adipose tissue were isolated from lipoaspiration of donors undergoing optimized liposuction [16] using a 3 mm canula according to ethical and safety guidelines as approved by the local IRB and as described by Bjo¨rntorp [17]. Briefly, adipose tissue was digested with collage-nase (0.120 U/ml, Roche, Indianapolis, USA) at 37uC for 30 min and under constant shaking. Digestion was stopped by adding Dulbecco’s modified Eagle’s medium (DMEM with glutamax, Gibco (Invitrogen, Carlsbad, USA)) containing 10% fetal calf serum (FCS, HyClone, Logan, USA). Floating adipocytes were discarded and cells from the stromal-vascular fraction (SVF) were pelleted, rinsed with media, centrifuged (300 gmin21
for 5 min, 20uC) and incubated in an erythrocyte lysis buffer for 10 min at 37uC. This cell suspension was centrifuged (300 g.min21 for
5 min, 20uC) and cells were counted using trypan blue and seeded at a density of 86104cells/cm2.
The mammary cell lines MCF7, MDA-MB-231 and MCF10a were obtained from the American Type Culture Collection (ATCC). MCF7 cells, which possesses estrogen receptor a (ER+), were cultured in RPMI 1640 medium (Pan Biotech, France) supple-mented with 10% heat-inactivated fetal bovine serum (FBS, Abcys, France), 0.04 U/mL insulin, 50mg/mL gentamycin and
2 mML-glutamine (Pan Biotech, France) and incubated at 37uC in a humidified atmosphere containing 5% CO2. MDA-MB-231 cells, which are non-estrogen dependent cells and more invasive than MCF7, were grown in L15 Leibovitz (Pan Biotech, France) supplemented with 15% FBS, 50mg/mL gentamycin and 2 mM
L-glutamine and incubated at 37uC in a humidified atmosphere. MCF10a cells were cultured in DMEM/F-12 (Pan Biotech, France) supplemented with 10% horse serum (Pan Biotech, France), 20 ng/ml epidermal growth factor (EGF), 0.25 U/mL insulin, 0.5mg/ml hydrocortisone (Sigma,
Falla-vier, France), 100 ng/ml cholera toxin (Sigma, Saint-Quentin-Fallavier, France) and 50mg/mL gentamycin in a 5% CO2 -humidified incubator at 37uC
3D Culture
We used a 3D model of skin equivalent [18,19] (Patent PCT/ FR/8800303, 1989) replacing the skin equivalent by an adipose skin equivalent in which breast cancer cell lines were in contact with different cell types such as fibroblasts, preadipocytes and adipocytes (Figure 1). This 3D structure mimicked a breast tumor surrounded by a microenvironment, with breast cell lines being in contact with fibroblasts, preadipocytes and mature adipocytes, and with all their secretions.
Fibroblasts (125,000 cells/cm2) and preadipocytes (125,000 cells/cm2) were seeded on top of the collagen-glycos-aminoglycan-chitosan porous scaffold (dermal substrate) and cultured in DMEM/HAM F-12 (1:1) supplemented with 10% FBS,basicFGF (10 ng/mL), vitamin C and streptomycin (50mg/ mL), which was replenished every 2 days. After 3 weeks of culture, a fatty equivalent dermis was obtained and four different epithelial cell lines (one million) were seeded on the surface: keratinocytes (skin equivalent control), MCF10a, MCF7, and MDA-MB-231. Three independent specimens of each studied mammary cell line were used. At this step, the medium is a mixture between keratinocyte medium [20] and an optimized adipocyte differen-tiation medium [19]. Briefly it contains DMEM/HAM F12 (1:1) supplemented with 10% FBS, hydrocortisone, insulin, adenine, EGF, T3, vitamin C, dexamethazon, roziglitazone, IBMX (only the first three days), streptomycin and fungizon [19]. The medium was replenished every 2 days. After 1 week of culture, cells were grown at the air-liquid interface for 2 weeks to obtain the reconstructed fatty skin equivalent,i.e.3D adipose skin equivalent.
Histological analysis
3D adipose skin equivalent was fixed in 10% buffered formalin and embedded in paraffin. Tissue sections 5mm thick were stained
with hematoxylin phloxin safran (HPS) to visualize nucleus, cytoplasm and ECM formation.
Oil Red O staining for evaluation of adipose differentiation
Oil Red O (5 mg/ml, Sigma) and counterstained with Harris hematoxylin (Sigma).
Immunohistochemistry
3D adipose skin equivalent was fixed with formol and embedded in paraffin wax. Sections 0.5mm thick were cut. The procedure was as described previously [21,22]. Briefly, sections were deparaffinized and rehydrated in graded alcohol and distilled water. Slides were pretreated by boiling in citrate buffer for 40 minutes at pH = 6. The avidin/biotin kit (Vector Laboratories, Burlingame, USA) was used to block non-specific binding sites. Leptin, adiponectin, AdipoR1, AdipoR2, and Ob-Rt protein expression was investigated by immunohistochemical staining using affinity-purified polyclonal biotinylated antibodies raised against leptin, Ob-Rt (corresponding to the extracellular domain recognizing all six forms of Ob-R), adiponectin (R&D Systems, France), AdipoR1, AdipoR2 (Phoenix Pharmaceuticals, France) (1mg/mL) diluted in PBS-SAB 5% overnight at 4uC in a humidified chamber.
Antigen staining was performed using ABC peroxidase-conju-gated streptavidin kit for 30 min and the specimens treated with
DAB substrate for 10 minutes (Vector Laboratories, Burlingame, USA). Sections were then contrasted using hematoxylin, dehy-drated and mounted using the Vectastain mounting medium.
Molecular analysis
Epithelial cells were separated from the rest of the skin by treatment with thermolysin and immediately frozen on liquid nitrogen. Total RNA was extracted by grinding in nitrogen and with Trizol according to the manufacturer’s recommendations (Invitrogen). The quantity and quality of RNA was assessed by 260/280 ratio using a NanoDrop 8000 spectrophotometer (Thermo Fisher Scientific). cDNA was obtained with HighCap cDNA RT Kit RNAse inhib (Applied Biosystems).
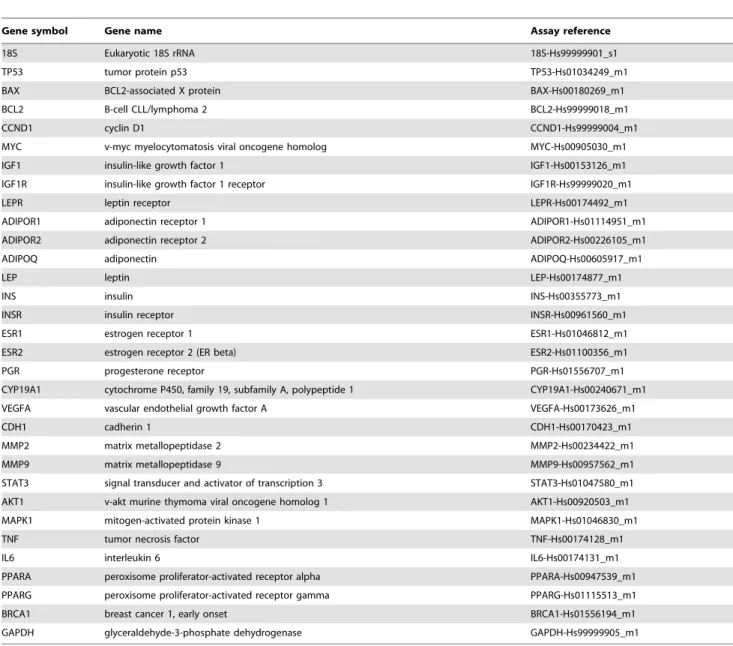
Relative expression of 32 genes of interest was assessed by Taqman Express plates on ABI PRISM 7900 HT (Applied Biosystems). Among the selected genes (Table 1), we determined the expression of genes coding for the two major adipokines (leptin and adiponectin) and their receptors (ObR, AdipoR1 and AdipoR2), genes involved in hormonal pathway (estrogen recep-tors, progesterone receptor, aromatase, insulin, IGF1), and genes Figure 1. Development of the adipose skin equivalent.1. Fibroblasts and preadipocytes were seeded on a dermal substrate. 2. After 3 weeks of culture, a fatty equivalent dermis was obtained and keratinocytes (control) or mammary cancer cells (MCF7, MDA-MB-231) or non-cancerous mammary cells (MCF10a) were then seeded on the dermis. 3. After one week of culture, these cells were grown at the air-liquid interface (2 weeks) to obtain the reconstructed fatty skin equivalent. 4. At the end of the experimentation, epithelial cells (n= 3) were separated from the dermis with a thermolysin treatment to extract RNA. The expression of 32 key genes was investigated by qRT-PCR and compared with the expression of cells cultured in normal conditions.
doi:10.1371/journal.pone.0066284.g001
coding for cytokines (IL6, TNF). We also determined the expression of genes involved in proliferation (AKT, MAPK1, cyclin D1), in apoptosis (Bax, Bcl2), in angiogenesis (MMP2, MMP9, VEGF), the expression of transcription factors (PPARa, PPARc, STAT3), tumor suppressor genes (BRCA1, TP53, e-cadherin) and oncogene (MYC).
The PCRs were performed in 96-well plates in a total volume of 20mL and 30 ng of cDNA. The program was as follows: two initial steps at 50uC for 2 min and 95uC for 10 min, and then 40 cycles of 95uC for 15 s and 60uC for 60 s.
Relative amount was calculated from the threshold cycles with the instrument’s software (SDS 2.0) according to the manufactur-er’s instructions. Genes were considered significantly expressed and their transcript measurable if their corresponding Ct value was less than or equal to 35. The expression levels of the target genes in the reconstructed skin fatty equivalent were compared with the expression of the same cell lines cultured under classic conditions, i.e.in their respective culture medium in flasks. The comparative cycle threshold (CT) method (22DDCT
) was used to
calculate the relative gene expression of a given sample in 3D skin equivalent, normalized within the sample to an endogenous reference gene (GAPDH), and relative to the expression of the same gene in another sample (cell cultured alone): 22DDCT
method with DDCT = [DCT (3D skin equivalent) - DCT (cell cultured alone)] and DCT = [CT(target gene) - CT(reference gene)]. Student’sttest was used for comparisons of gene expression levels in cells cultured in 3D and in cells cultured alone.
Statistical analysis
Principal component analysis (PCA), an unsupervised multivar-iate analysis, was carried out to explore the differences among samples and relationships among genes. Hierarchical cluster analysis (HCA) was used with Euclidian distance and Ward aggregation to classify samples and genes. Both techniques were performed with unit variance scaling on gene expression data.
For PCA, we used SIMCA-P+v12 software (Umetrics, Umea, Sweden) and for HCA Permutmatrix v1.93 [23].
Table 1.List of the selected genes.
Gene symbol Gene name Assay reference
18S Eukaryotic 18S rRNA 18S-Hs99999901_s1
TP53 tumor protein p53 TP53-Hs01034249_m1
BAX BCL2-associated X protein BAX-Hs00180269_m1
BCL2 B-cell CLL/lymphoma 2 BCL2-Hs99999018_m1
CCND1 cyclin D1 CCND1-Hs99999004_m1
MYC v-myc myelocytomatosis viral oncogene homolog MYC-Hs00905030_m1
IGF1 insulin-like growth factor 1 IGF1-Hs00153126_m1
IGF1R insulin-like growth factor 1 receptor IGF1R-Hs99999020_m1
LEPR leptin receptor LEPR-Hs00174492_m1
ADIPOR1 adiponectin receptor 1 ADIPOR1-Hs01114951_m1
ADIPOR2 adiponectin receptor 2 ADIPOR2-Hs00226105_m1
ADIPOQ adiponectin ADIPOQ-Hs00605917_m1
LEP leptin LEP-Hs00174877_m1
INS insulin INS-Hs00355773_m1
INSR insulin receptor INSR-Hs00961560_m1
ESR1 estrogen receptor 1 ESR1-Hs01046812_m1
ESR2 estrogen receptor 2 (ER beta) ESR2-Hs01100356_m1
PGR progesterone receptor PGR-Hs01556707_m1
CYP19A1 cytochrome P450, family 19, subfamily A, polypeptide 1 CYP19A1-Hs00240671_m1
VEGFA vascular endothelial growth factor A VEGFA-Hs00173626_m1
CDH1 cadherin 1 CDH1-Hs00170423_m1
MMP2 matrix metallopeptidase 2 MMP2-Hs00234422_m1
MMP9 matrix metallopeptidase 9 MMP9-Hs00957562_m1
STAT3 signal transducer and activator of transcription 3 STAT3-Hs01047580_m1
AKT1 v-akt murine thymoma viral oncogene homolog 1 AKT1-Hs00920503_m1
MAPK1 mitogen-activated protein kinase 1 MAPK1-Hs01046830_m1
TNF tumor necrosis factor TNF-Hs00174128_m1
IL6 interleukin 6 IL6-Hs00174131_m1
PPARA peroxisome proliferator-activated receptor alpha PPARA-Hs00947539_m1
PPARG peroxisome proliferator-activated receptor gamma PPARG-Hs01115513_m1
BRCA1 breast cancer 1, early onset BRCA1-Hs01556194_m1
GAPDH glyceraldehyde-3-phosphate dehydrogenase GAPDH-Hs99999905_m1
Results
Reconstructed three-dimensional (3D) adipose equivalent-Differentiation of preadipocytes
The experiment was validated with the results of culture control. Indeed, the 3D adipose model obtained with normal human keratinocytes (NHK) exhibited a balanced, pluristratified, and differentiated epidermis, close to human normal skin (Figure 2).
HPS staining showed that fibroblasts and preadipocytes colonized the dermal substrate. The negative Oil Red O staining specific to mature adipocytes showed that no differentiation of preadipocytes into mature adipocytes occurred.
In, contrast to the NHK model, the differentiation of preadipocyte to mature adipocytes was observed in our 3D model with breast epithelial cells. In addition, differences were observed according to the cell line. With cystic mammary cells (MCF10a Figure 2. Influence of epithelial cells on adipose connective tissue: a) and b). Hematoxylin Phloxin Safran (HPS) staining for nucleus (purple), cytoplasm (red) and extracellular matrix components (orange); c. Oil red staining: mature adipocytes appeared in red.
doi:10.1371/journal.pone.0066284.g002
cell line), cysts were present in the epithelium and with cancerous MCF7 and MDA-MB-231 cell lines, the epithelium appeared pluristratified but non-differentiated and completely disorganized. Deeper in adipose connective tissue, preadipocyte differentiation into mature adipocytes was greater with these two cancerous cell lines. These results suggest that preadipocyte differentiation into mature adipocytes was only possible in the presence of breast cells in their microenvironment with a greatest effect occurring with breast cancer cells. They also suggest that interactions take place between adipose and cancerous cells as a result of the secretion of biomolecules through mechanisms not yet fully understood.
Breast cancer cells expressed adipokines and their receptors except for AdipoR2
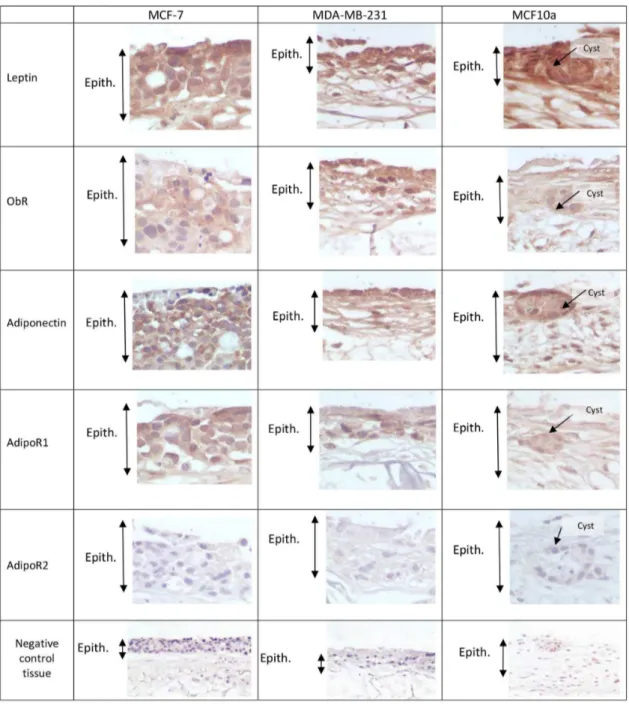
The two major adipokines, leptin and adiponectin, were strongly expressed in all three models whatever the mammary epithelial cells used, cancerous MCF7, MDA-MD-231 and non-cancerous mammary cells MCF10a (Figure 3), but not in the model epithelialized with NHK. Their respective receptors, ObRt and AdipoR1 were expressed to a lesser extent. Unexpectedly, AdipoR2 was not expressed.
Figure 3. Immunohistochemical staining of the tridimensional adipose skin equivalent using affinity-purified polyclonal biotinylated antibodies raised against Leptin, Ob-Rt, Adiponectin, AdipoR1, AdipoR2.(Manification:6400). Positive staining appears
in brown. (Epith: Epithelium)
Adipose microenvironment modified the expression of genes involved in major biological pathways
Quantitative real-time PCR was used to assess the expression of 32 genes coding for adipokines and their receptors, for proteins involved in hormonal pathways, and in major biological pathways such as proliferation and angiogenesis, and to compare breast epithelial cells cultured alone in monolayered culture and cells in 3D adipose connective tissue model. The presence of fibroblasts and adipose cells (preadipocytes and mature adipocytes) and their secretions strikingly modified gene expression in breast cells.
The analysis of gene expression was made by principal component analysis (PCA) (Figure 4). The first two principal components account for 63% of the total variance. On the first principal component, a clear discrimination can be seen between cells cultured in the adipose skin equivalent model and those cultured in normal conditions. The second principal component
discriminated the three studied cell lines (MCF7, MDA-MB-231 and MCF10a) in the control group. In contrast, PCA showed that the cell lines cultured in the adipose skin equivalent model tended to exhibit the same expression profile. However, two assays of the MDA-MB-231 cells cultured in the 3D model seemed to be at distance from this plot.
Hierarchical cluster analysis (HCA) (Figure 5) allowed us to evaluate the low to high expression of each gene in each control and 3D assay. It discriminated cells cultured in control conditions and cells cultured in the 3D model, except for one assay of MDA-MB-231 cultured in control condition. This representation led to the formation of expression blocks, red and green, of which the former was more strongly expressed.
The relative gene expression of a given sample in the 3D skin equivalent model calculated with the 22DDCT
method (Table 2), revealed significant modifications in genes coding for adipokines in Figure 4. Principal component analysis (PCA) carried out to explore the differences among samples and relationships among genes.The expression of genes by mammary cell lines (MCF7, MDA-MB-231) cultured in control conditions (MCF7_Ctrl, MDA_Ctrl, MCF10a_Ctrl) or cultured in the adipose skin equivalent model (MCF7_3D, MDA_3D, MCF10a_3D) was evaluated using unit variance scaling on gene expression data. On the first principal component, a clear discrimination can be noted between cells cultured in the adipose skin equivalent model versus cells cultured in normal conditions. The second principal component permitted to discriminate the three studied cell lines (MCF7, MDA-MB-231 and MCF10a) among the control group.
doi:10.1371/journal.pone.0066284.g004
MCF10a, with a 10-fold up regulation of leptin gene, 23-fold for adiponectin and 5-fold for AdipoR2. Up-regulation ofESR1was observed in MCF7 and MDA-MB-231 and that ofESR2in MCF7 and MCF10a. The expression of aromatase was unchanged irrespective of cell type. There was a marked increase inTNFand IGF1in MCF10a, and an increase inINSRin all three cell lines. Induction ofCyclin D1(9-fold in MCF7) andMAPK(11-fold in MCF7 and 4.2-fold in MCF10a) was observed. Key changes also involved the induction of tumor suppressor genes such asBRCA1 (7-fold), CDH1(13-fold), and oncogenes (MYC: 7-fold) in MCF7 cells, and the induction of transcription factors in MCF10a (PPARa: 3.6-fold;PPARb: 5.3-fold;STAT3: 5.2-fold).
Anti-apoptoticBcl2gene was consistently up-regulated (68-fold in MCF7; 2.8-fold in MDA-MB-231; 41.3 in MCF10a), and the expression ofBaxwas not modified.
The angiogenesis pathway was activated with a 3-fold increase forMMP9,a 15-fold increase forVEGFin MCF7 and a 21-fold increase for VEGFin MCF10a, but was not modified in MDA-MB-231 cells.
Discussion
To gain a fuller understanding of the role of the adipose microenvironment in breast cancer growth, we developed a novel model of reconstructed adipose connective tissue that could be epithelialized either with cutaneous NHK, to produce a skin equivalent, or with cystic or tumor breast epithelial cells, to allow interactions between these breast epithelial cells and different cell types (fibroblasts, adipose cells and their secretions). Three mammary cell lines were studied in our model: MCF10a cells derived from a fibrocystic disease, considered as non-tumorigenic, served as a breast cell control, and two cancer cell lines, MCF7, which possesses estrogen receptora (ER+), and MDA-MB-231, estrogen-insensitive cells which are considered to be more invasive. We observed a stronger differentiation of adipocytes in contact with cancer cells, and marked modifications of mammary cell transcriptional programs, which suggests the existence of recipro-cal interactions.
Breast tumors are surrounded by different cell types including endothelial cells, fibroblasts, preadipocytes and adipocytes, and each cell type has the ability to secrete biomolecules that can act on breast cancer cells. Adipose tissue is now considered as an endocrine organ, in addition to being a fat storage tissue. It secretes several entities called adipokines, the most widely studied of which are leptin and adiponectin, which are respectively increased and decreased in obese patients [24]. Leptin is produced by preadipocytes, adipocytes, mammary epithelial cells and other tissues [25]. Increased serum concentration of leptin is correlated with obesity, and a high level of leptin is associated with breast cancer risk [6]. This adipokine is known to exert its activity through its receptor ObR, and ObR mRNA and their protein expressions have been observed in breast cancer cell lines [7]. Adiponectin, considered as a protective factor because it decreases the proliferation of cancerous cells [7], is produced sparingly by cancerous mammary cells but abundantly by adipose cells. Also, lower serum adiponectin concentrations have been reported in obese patients and in menopausal women with breast cancer [26]. The high protein expression of leptin and its receptor and the surprising absence of AdipoR2 in the adipose skin equivalent seeded with normal human keratinocytes point to the possible role of an adipose microenvironment in increasing leptin proliferative activity and down-regulating the expression of adiponectin receptor. Immunohistochemical studies have shown that leptin, adiponectin and their receptors (Ob-R, AdipoR1 and AdipoR2) are detected in the cytoplasm of MCF-7 breast cancer cells [5]. The mRNA of the two adiponectin receptors were also found in MDA-MB-231 [27]. Immunoblotting of total protein lysates showed that the two major isoforms of Ob-R were expressed at similar levels in different cell lines including MCF-7 and MDA-MB-231 [28]. MCF10a cells expressed leptin [29]. These results are in agreement with studies conducted on human biopsies showing leptin and Ob-R protein expression in breast cancer cells and in benign breast lesions [30].
Cancer cells (MCF-7 and MDA-MB-231) expressed adipokines at the transcriptional level. Nevertheless, no significant increase in these expressions was observed in the presence of the adipose microenvironment. The transcriptional levels of adiponectin MCF10a cells were significantly higher in the 3D configuration, which could explain their benign character compared to invasive MCF-7 cells.
We suggest there is a cross-talk between cancerous and adipose cells that allows maximal differentiation of preadipocytes into mature adipocytes, irrespective of estrogen receptor status. The same process was reported by Wang et al., who observed that Figure 5. Hierarchical cluster analysis of the genes
differen-tially expressed between the three studied mammary cell lines (MCF7, MDA-MB-231, MCF10a) in control conditions (Ctrl) or cultured in the adipose skin adipose model (3D). Expression blocks were formed, the red block being more expressed than the green block.
tumor invasive potential was only obtained when these cells were cultured in a medium conditioned by both murine adipose cells and human breast cancer cells [13]. Inversely, media conditioned by MCF7 and MDA-MB-231 induced a reversion of human and murine adipose cells, the main component of the breast stroma, to a fibroblastic phenotypeviatwo soluble factors (TGF-b1 and TNF-a). Also, adipocytes cultured with this conditioned media presented a decreased lipid accumulation [31]. Thus tumor cells
may be able to modulate their microenvironment to favor tumor progression.
Estrogens are key biological factors in promoting breast carcinogenesis in estrogen receptor tumors. Adipose tissue becomes the most abundant producer of estrogen after meno-pause, as a result of aromatization of androgens by the aromatase. Our model shows differences in the hormonal pathways modified by the tumor environment. By contrast, the differentiation of mature adipocytes was not affected by estrogen receptor status. Table 2.Variation of gene expression in the different cell lines studied between.
MCF7 MDA-MB-231 MCF10A
Expression ratioaPvalueb Expression ratio Pvalue Expression ratio Pvalue
Adipokines
LEP - 14.2 0.10 10.3 0.01
LEPR - 1.2 0.82
-Adiponectin - 1.9 0.19 23.3 0.01
ADIPOR1 0.4 0.52 0.1 0.37 3.5 0.74
ADIPOR2 4.8 0.06 2.2 0.34 5.1 0.02
Hormonal pathway, cytokines
CYP19A1 1.9 0.01 8.3 0.09
-ESR1 16.1 0.01 281.6 0.04
-ESR2 2.1 0.03 3.3 0.11 18.6 0.01
PGR 2.5 0.01 3.9 0.33 21.9 0.01
IGF1 - 2.0 0.09 9.2 0.01
IGF1R 2.7 0.23
IL6 44.4 0.01 10.3 0.39 2.2 0.19
INS - -
-INSR 18.8 0.01 6.8 0.01 48.9 0.01
TNF 2.2 0.25 17.9 0.01
Angiogenesis
MMP2 - -
-MMP9 3.2 0.05 0.1 0.07
-VEGFA 15.9 0.02 2.9 0.19 21.8 0.01
Apoptosis
BAX 3.5 0.11 0.8 0.69 1.7 0.14
BCL2 68.7 0.01 2.8 0.01 41.3 0.01
Proliferation-survival
AKT1 2.2 0.32 1.4 0.15
-MAPK1 11.3 0.03 3.2 0.32 4.2 0.03
CCND1 9.1 0.04 1.7 0.48
-Transcription factors
PPARA 2.5 0.53 3.6 0.03
PPARG 3.9 0.08 3.4 0.39 5.3 0.02
STAT3 11.4 0.06 2.6 0.26 5.2 0.02
Tumor suppressor genes, oncogenes
BRCA1 7.1 0.02 1.6 0.63 2.7 0.13
TP53 1.7 0.48 0.7 0.17 2.8 0.06
CDH1 13.4 0.05 23.2 0.39
-MYC 7.0 0.01 2.6 0.33 1.2 0.81
aAverage expression level in 3D skin equivalent calculated with the 22DDCTmethod.
bPvalues were obtained using a two-tailed Student’sttest to identify genes whose average expression levels were statistically significantly different between 3D skin equivalent and cells cultured alone.
doi:10.1371/journal.pone.0066284.t002
We postulate that (i) fibroblasts in contact with breast cells have higher aromatase activity, thereby enhancing estrogen biosynthe-sis, which in turn favors the progression of breast cancer [15], and (ii) although aromatase expression in breast cancer cells was not increased in our model, other markers that are able to stimulate aromatase activity, such as IL6, TNFa, IGF-1, exhibited greater mRNA expression [32]. Hence, the secretions of fibroblasts and adipocytes could result in higher estrogen production and in turn could increase breast cancer proliferation by interacting with estrogen receptors on surrounding cancer cells in a paracrine manner.
Increased BMI in postmenopausal women is associated with hyperinsulinemia, insulin-resistant type 2 diabetes and metabolic syndrome, which in turn are associated with a small increase in hormonal breast cancer risk. These conditions lead to elevated glucose blood concentration, increased secretion of insulin and induction of ER+ breast cancer cell lines [33]. The increase of INSR expression in our model suggested that estrogen and insulin cooperate to promote cell-cycle progression [34]. Also, insulin and IGF1 are able to stimulate ER transcriptional activity in breast cancer cells, even in the absence of estrogen [35].
Molecular analysis demonstrated that the tumor microenviron-ment induced profound changes in breast cancer (MCF7, ER+)and non-cancerous (MCF10a) cell proliferation. In contrast, the invasive character of MDA-MB-231 cells did not seem to be influenced by the adipose microenvironment. These results are in agreement with our previous observations (unpublished data) and those of Binai [36] who reported that leptin had no impact on proliferation of these estrogen-receptor negative cells. In addition, MDA-MB-231 cells often exhibited high basal gene expressions, which could also explain why gene expression ratio was unchanged.
The up-regulation of VEGF and matrix metalloproteinase 9, which have the ability to degrade the extracellular matrix, led to an increased invasive potential in MCF7 cancer cells. Proliferation was also stimulated with an increased expression ofMAPK1and cyclinD1in these cells. The increase incyclin D1expression could be explained by the production of biomolecules from the adipose microenvironment that could stimulate cyclin D1 such as leptin. Thus, invasive potential was notably increased in cells surrounded
by adipose cells and their secretions, except for MDA-MB-231, which were initially the most invasive of the cells studied.
Conversely, an up-regulation ofCDH1andBRCA1could lead to the suppression of cellular transformation. However, studies have shown the enhanced expression of E-cadherin can represent an early stage in ovarian cancer [37]. Genetic alterations were identified in tumor-associated stroma from several independent cases of mammary carcinomas, suggesting the role of these mutations in the formation of epithelial tumors [38].
Co-cultures of mammary cancer cells and mature adipocytes from rats showed that mature adipocytes unlike preadipocytes promoted the growth of ER-positive cancer cells, but no effect was observed on apoptosis. In addition, preadipocytes, but not mature adipocytes, promoted a higher expression of the E-cadherin, suggesting a protective role of this cell type by an increase in cell adhesion [39].
Our model show, for the first time, the existence of a cross-talk between human adipose microenvironment and breast cell lines: the adipose microenvironment seems to modify the expression profile of tumor cells and the tumor cells seem to influence the differentiation of mature adipocyte. Determining the specific role of adipokines in breast cancer cells is of major importance. The cancer microenvironment, including adipocytes and fibroblasts, must be considered globally to understand breast cancerogenesis, particularly in obese patients in whom the expression of adipokines and estrogen is modified.
Acknowledgments
The authors thank Prof. Yves-Jean Bignon and Dominique Bernard-Gallon from the Laboratoire d’Oncologie Mole´culaire (Centre Jean-Perrin, Clermont-Ferrand) for the use of the ABI PrismH 7900HT Sequence Detection System (TaqMan, Applied Biosystems).
Author Contributions
Conceived and designed the experiments: LD CL AM OD MPV FCC. Performed the experiments: LD CL VD AD HB. Analyzed the data: LD CL VD HB. Contributed reagents/materials/analysis tools: LD CL VD HB. Wrote the paper: LD CL OD FCC.
References
1. Ferlay J, Shin HR, Bray F, Forman D, Mathers C, et al. (2010) Estimates of worldwide burden of cancer in 2008: GLOBOCAN 2008. Int J Cancer 2. Calle EE, Thun MJ (2004) Obesity and cancer. Oncogene 23: 6365–78. 3. Renehan AG, Soerjomataram I, Leitzmann MF (2010) Interpreting the
epidemiological evidence linking obesity and cancer: A framework for population-attributable risk estimations in Europe. Eur J Cancer 46: 2581–92. 4. Maccio A, Madeddu C, Mantovani G (2009) Adipose tissue as target organ in the treatment of hormone-dependent breast cancer: new therapeutic perspec-tives. Obes Rev 10: 660–70.
5. Jarde T, Caldefie-Chezet F, Goncalves-Mendes N, Mishellany F, Buechler C, et al. (2009) Involvement of adiponectin and leptin in breast cancer: clinical and in vitro studies. Endocr Relat Cancer 16: 1197–210.
6. Maccio A, Madeddu C, Gramignano G, Mulas C, Floris C, et al. (2010) Correlation of body mass index and leptin with tumor size and stage of disease in hormone-dependent postmenopausal breast cancer: preliminary results and therapeutic implications. J Mol Med (Berl) 88: 677–86.
7. Jarde T, Perrier S, Vasson MP, Caldefie-Chezet F (2011) Molecular mechanisms of leptin and adiponectin in breast cancer. Eur J Cancer 47: 33–43. 8. Mantzoros C, Petridou E, Dessypris N, Chavelas C, Dalamaga M, et al. (2004)
Adiponectin and breast cancer risk. J Clin Endocrinol Metab 89: 1102–7. 9. Takahata C, Miyoshi Y, Irahara N, Taguchi T, Tamaki Y, et al. (2007)
Demonstration of adiponectin receptors 1 and 2 mRNA expression in human breast cancer cells. Cancer Lett 250: 229–36.
10. Kang JH, Lee YY, Yu BY, Yang BS, Cho KH, et al. (2005) Adiponectin induces growth arrest and apoptosis of MDA-MB-231 breast cancer cell. Arch Pharm Res 28: 1263–9.
11. Wang Y, Lam JB, Lam KS, Liu J, Lam MC, et al. (2006) Adiponectin modulates the glycogen synthase kinase-3beta/beta-catenin signaling pathway and
attenuates mammary tumorigenesis of MDA-MB-231 cells in nude mice. Cancer Res 66: 11462–70.
12. Iyengar P, Combs TP, Shah SJ, Gouon-Evans V, Pollard JW, et al. (2003) Adipocyte-secreted factors synergistically promote mammary tumorigenesis through induction of anti-apoptotic transcriptional programs and proto-oncogene stabilization. Oncogene 22: 6408–23.
13. Dirat B, Bochet L, Dabek M, Daviaud D, Dauvillier S, et al. (2011) Cancer-associated adipocytes exhibit an activated phenotype and contribute to breast cancer invasion. Cancer Res 71: 2455–65.
14. Franses JW, Baker AB, Chitalia VC, Edelman ER (2011) Stromal endothelial cells directly influence cancer progression. Sci Transl Med 3: 66ra5. 15. Bulun SE, Price TM, Aitken J, Mahendroo MS, Simpson ER (1993) A link
between breast cancer and local estrogen biosynthesis suggested by quantifica-tion of breast adipose tissue aromatase cytochrome P450 transcripts using competitive polymerase chain reaction after reverse transcription. J Clin Endocrinol Metab 77: 1622–8.
16. Mojallal A, Auxenfans C, Lequeux C, Braye F, Damour O (2008) Influence of negative pressure when harvesting adipose tissue on cell yield of the stromal-vascular fraction. Biomed Mater Eng 18: 193–7.
17. Bjorntorp P, Karlsson M, Pettersson P (1982) Expansion of adipose tissue storage capacity at different ages in rats. Metabolism 31: 366–73.
18. La Vecchia C (2006) Oral contraceptives and ovarian cancer: an update, 1998– 2004. Eur J Cancer Prev 15: 117–24.
20. Black AF, Bouez C, Perrier E, Schlotmann K, Chapuis F, et al. (2005) Optimization and characterization of an engineered human skin equivalent. Tissue Eng 11: 723–33.
21. Dubois V, Delort L, Mishellany F, Jarde T, Billard H, et al. (2010) Zinc-alpha2-glycoprotein: a new biomarker of breast cancer? Anticancer Res 30: 2919–25. 22. Jarde T, Caldefie-Chezet F, Damez M, Mishellany F, Perrone D, et al. (2008)
Adiponectin and leptin expression in primary ductal breast cancer and in adjacent healthy epithelial and myoepithelial tissue. Histopathology 53: 484–7. 23. Caraux G, Pinloche S (2005) PermutMatrix: a graphical environment to arrange
gene expression profiles in optimal linear order. Bioinformatics 21: 1280–1. 24. Vona-Davis L, Howard-McNatt M, Rose DP (2007) Adiposity, type 2 diabetes
and the metabolic syndrome in breast cancer. Obes Rev 8: 395–408. 25. Cleary MP, Ray A, Rogozina OP, Dogan S, Grossmann ME (2009) Targeting
the adiponectin:leptin ratio for postmenopausal breast cancer prevention. Front Biosci (Schol Ed) 1: 329–57.
26. Tworoger SS, Eliassen AH, Kelesidis T, Colditz GA, Willett WC, et al. (2007) Plasma adiponectin concentrations and risk of incident breast cancer. J Clin Endocrinol Metab 92: 1510–6.
27. Dos Santos E, Benaitreau D, Dieudonne MN, Leneveu MC, Serazin V, et al. (2008) Adiponectin mediates an antiproliferative response in human MDA-MB 231 breast cancer cells. Oncol Rep 20: 971–7.
28. Ozbay T, Nahta R (2008) A novel unidirectional cross-talk from the insulin-like growth factor-I receptor to leptin receptor in human breast cancer cells. Mol Cancer Res 6: 1052–8.
29. O’Brien S N, Welter BH, Price TM (1999) Presence of leptin in breast cell lines and breast tumors. Biochem Biophys Res Commun 259: 695–8.
30. Caldefie-Chezet F, Damez M, de Latour M, Konska G, Mishellani F, et al. (2005) Leptin: a proliferative factor for breast cancer? Study on human ductal carcinoma. Biochem Biophys Res Commun 334: 737–41.
31. Guerrero J, Tobar N, Caceres M, Espinoza L, Escobar P, et al. (2010) Soluble factors derived from tumor mammary cell lines induce a stromal mammary adipose reversion in human and mice adipose cells. Possible role of TGF-beta1 and TNF-alpha. Breast Cancer Res Treat 119: 497–508.
32. Purohit A, Newman SP, Reed MJ (2002) The role of cytokines in regulating estrogen synthesis: implications for the etiology of breast cancer. Breast Cancer Res 4: 65–9.
33. Godden J, Leake R, Kerr DJ (1992) The response of breast cancer cells to steroid and peptide growth factors. Anticancer Res 12: 1683–8.
34. Mawson A, Lai A, Carroll JS, Sergio CM, Mitchell CJ, et al. (2005) Estrogen and insulin/IGF-1 cooperatively stimulate cell cycle progression in MCF-7 breast cancer cells through differential regulation of c-Myc and cyclin D1. Mol Cell Endocrinol 229: 161–73.
35. Yee D, Lee AV (2000) Crosstalk between the insulin-like growth factors and estrogens in breast cancer. J Mammary Gland Biol Neoplasia 5: 107–15. 36. Binai NA, Damert A, Carra G, Steckelbroeck S, Lower J, et al. (2010)
Expression of estrogen receptor alpha increases leptin-induced STAT3 activity in breast cancer cells. Int J Cancer 127: 55–66.
37. Auersperg N, Pan J, Grove BD, Peterson T, Fisher J, et al. (1999) E-cadherin induces mesenchymal-to-epithelial transition in human ovarian surface epithe-lium. Proc Natl Acad Sci U S A 96: 6249–54.
38. Moinfar F, Man YG, Arnould L, Bratthauer GL, Ratschek M, et al. (2000) Concurrent and independent genetic alterations in the stromal and epithelial cells of mammary carcinoma: implications for tumorigenesis. Cancer Res 60: 2562–6.
39. Manabe Y, Toda S, Miyazaki K, Sugihara H (2003) Mature adipocytes, but not preadipocytes, promote the growth of breast carcinoma cells in collagen gel matrix culture through cancer-stromal cell interactions. J Pathol 201: 221–8.